
 Abstract
- Human self-initiated behavior against epidemics is recognized to have significant impacts on disease spread. A few epidemic models have incorporated self-initiated behavior, and most of them are based on a classic population-based approach, which assumes a homogeneous population and a perfect mixing pattern, thus failing to capture heterogeneity among individuals, such as their responsive behavior to diseases. This article proposes an agent-based model that combines epidemic simulation with a relative agreement model for individual self-initiated behavior. This model explicitly represents discrete individuals, their contact structure, and most importantly, their progressive decision making processes, thus characterizing individualized response to disease risks. The model simulation and sensitivity analysis show the existence of critical points (threshold values) in the model parameter space to control influenza epidemic including minimum values for the initially positive population size, the communication rate, and the attitude uncertainty. These threshold effects shed insights on preventive strategy design to deal with the current circumstances that new vaccines are often insufficient to combat emerging communicable diseases.
- Keywords:
- Self-Initiated Behavior, Infectious Diseases, Agent-Based Modeling, Relative Agreement Rules, Social Network
Introduction
- 1.1
- Recent outbreaks of emerging infectious diseases, such as the new H1N1 flu in 2009 and Ebola in 2014, have attracted substantial interests in understanding human responsive behavior against diseases, from which practical intervention policies could be suggested (Funk et al. 2010; Perisic & Bauch 2009). Since effective vaccines require sufficient time to develop and manufacture, the best human response at an early stage of epidemics is the self-initiated preventive behavior, for example, wearing facemasks, performing hand hygiene, taking antiviral drugs, and avoiding close contact with people with symptoms (CDC 2008). Many studies have argued that these self-initiated behaviors can significantly change the course of epidemics (Poletti et al. 2009; Sahneh et al. 2012; Wu et al. 2012). Knowledge on the drivers and decision processes toward self-initiated behaviors is critical to the full understanding of disease spread and the early control of epidemics (Meloni et al. 2011).
- 1.2
- Although many computational and mathematical models have been developed to understand disease transmission dynamics, few of them have, until recently, incorporated the human self-initiated behavior (Funk et al. 2014; Sahneh, et al. 2012). Previous models of human behavior in the context of epidemics have been concentrated on gauging the effectiveness of various institutionally enforced public health measures such as school closures (Funk et al. 2010). Challenges in modeling self-initiated behavior lie in how to depict individuals' perception of disease risks, their influence on each other, and their psychological process to make decisions, along with the feedback of behavior on disease spread (Fenichel et al. 2011; Funk et al. 2014; Sahneh et al. 2012). To date, the few models that have considered human self-initiated behavior are mostly designed by a classic population-based approach, or in other words, depicted by mean-field differential equations (Fenichel et al. 2011; Funk et al. 2009; Kiss et al. 2010; Reluga 2010). These population-based models often assume a homogeneous population and a perfect mixing pattern, thus failing to capture the heterogeneity among individuals, such as personal traits, individualized contact structure, and individualized decision making processes (Bian & Liebner 2007; Koopman & Lynch 1999). There is a compelling need to develop a new class of disease-behavior models that explicitly differentiate individuals, their contacts, and decision making processes. The individual-based (also called agent-based) approach has been gradually recognized as a promising solution, but its application so far remains limited in integrating epidemics and human self-initiated behavior (Epstein et al. 2008; Sahneh et al. 2012).
- 1.3
- This article proposes an agent-based model that combines epidemic simulation with a relative agreement model for human self-initiated behavior. The relative agreement model has been developed in sociology and used to study dynamics of social opinions (Deffuant et al. 2005), but never been used in the context of epidemics. The inclusion of the relative agreement model allows a representation of step-by-step decision making processes for individuals, which has been widely recognized but not fully represented in existing models. With the proposed model, a sensitivity analysis is conducted to explore potential strategies that could promote preventive behaviors among the population and help control epidemics. The remainder of this article describes the model construction and its parameterization, and discusses simulation outcomes and research implications.
Methodology
design
-
Conceptual model and assumptions
- 2.1
- From a modeling perspective, both the transmission of
diseases and the self-initiated adoption of preventive behavior can be
conceptualized as diffusion processes. The disease spreads from
individual to individual through their physical contacts, while the
self-initiated preventive behaviors disperse through their social
contacts, such as communication and observation (Amblard & Deffuant 2004;
Glanz et al. 2002; Hägerstrand 1967). These
two diffusion processes spread simultaneously and interact with one
another. Once infected by diseases, individuals may adopt preventive
behavior to protect others, and meanwhile motivate others to adopt as
well. Conversely, the adoption of preventive behavior limits the
transmission of disease by reducing the likelihood of infection. In
this article, the disease-behavior diffusion model is established based
on six assumptions:
- Individuals in a population are linked together by a network structure. Individuals have contact with one another through the network.
- Every individual has an infection status, which can be susceptible, latent, infectious or recovered (Anderson & May 1992; Kermack & McKendrick 1927). The contact between individuals through the network triggers the change of infection status, which then follows the natural history of the disease.
- Every individual also holds an attitude toward the preventive behavior, which can be either positive, neutral, or negative. The initial attitude is a mixed product of the individual's knowledge, experiences, perceived barriers and benefits (Glanz et al. 2002). The attitude varies over time due to interpersonal influences, and determines whether to adopt the preventive behavior or not.
- During an epidemic, individuals observe and communicate with each other through the network, which in turn influences their attitudes toward the adoption of preventive behavior. The communication and observation between individuals drives the diffusion of preventive behavior throughout the population.
- The adoption of preventive behaviors can reduce the transmissibility of influenza to different degrees, dependent on infection status of individuals.
- The manifestation of disease symptoms will add positive effects to an individual's attitude toward the adoption of preventive behavior.
- 2.2
- To build a working simulation model, each of these six
assumptions are formulated and then programmed as elaborated in
following steps.
Step 1: Modeling the social network (Assumption 1)
- 2.3
- A hypothetic network of 5,000 individuals is modeled for simulation. The network structure is generated with following algorithm. First, individuals are grouped into families with an average size of 2.5 members per family, consistent with that of a typical American family. A k-mean clustering method is used to group individuals based on their proximity. Second, same individuals are redistributed and then grouped into workplaces with an average size of 10 members per workplace (similar to a typical American workplace) with the k-mean clustering method based on their proximity. Individuals are linked to all members in their families and workplaces, resulting in approximately 12 contacts per individual on average. This network is highly clustered because individuals are grouped based on proximity and meanwhile has short average path length due to two groups of connections each individual has. This algorithm, thus, produces a network with a small-world structure (Watts & Strogatz 1998).
- 2.4
- For simplicity, the model experiment assumes that both
infectious diseases and human self-initiated behaviors diffuse through
an identical network composed of people's close contacts, including
family members and co-workers. Empirical studies on human behavior and
social networks have reported that social distance between individuals
have significant effects on their behavior change, such as lifestyle,
substance use, and smoking (Bauman
& Ennett 1994; Christakis
& Fowler 2007, 2008).
Individuals' attitude and behavior are more likely to be changed by
people socially closer to them, such as their spouses and co-workers,
among whom the transmission of diseases would also occur. Those who are
socially distant to individuals may inform them, but are less likely to
influence their attitude and behavior. Hence, simulating the diffusion
of behavior and disease on the same network could be reasonable.
Step 2: Modeling the diffusion of influenza (Assumption 2)
- 2.5
- Influenza is taken as a typical example of infectious
diseases, and its diffusion is simulated by changing the infection
status of every individual over time. As shown in Figure 1, once having contact with an
infectious individual, a susceptible individual may
be infected by the influenza virus and enter into the latent
status. The likelihood of infection is formulated as a probability
referred to as the transmission rate (\(r\)), based on which the
Monte-Carlo method can be applied to determine the transmission. The
infection starts a latent period, during which influenza virus develops
internally and cannot be transmitted. The end of latent period moves
the individual into an infectious
status and
enables the individual to transmit influenza virus to other susceptible
contacts. During the infectious period, the individual may develop
symptoms of influenza or remain asymptomatic. At the end of the
infectious period, the individual recovers, and develops immunity in
the remaining period of an epidemic. The diffusion of influenza was
programmed by tracking susceptible contacts of infectious individuals
during every simulation day and emulating the transmission events
through the Monte-Carlo method.
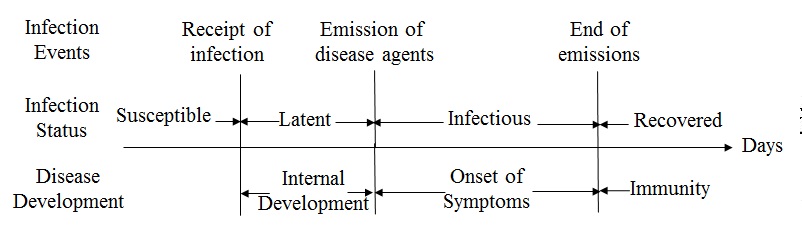
Figure 1. The infection events and status in the natural history of influenza Step 3: Modeling the diffusion of preventive behaviors (Assumption 3&4)
- 2.6
- In behavioral science, the diffusion of a self-initiated
behavior in a population can be modeled as gradual variations of
individuals' attitudes toward adoption (Granovetter
1978; Hägerstrand
1967; Valente 1995).
Following sub-steps depict the formulation of individuals' decision
making process, their attitude toward adoption, and the exchange of
individuals' attitudes.
Step 3.1: Decision process toward adoption
- 2.7
- An individual's decision making is formulated as a staged
process with a series of adoption status, following the concept of
Precaution Adoption Process Model (PAPM) (Deffuant et al. 2005; Weinstein & Sandman 1992).
As shown in Figure 2, the
individual starts with an Unaware status of the
preventive behavior. At some time point, this individual may be Informed
about the preventive behavior through communication with network
contacts. Once informed, this individual develops an initial attitude
(positive, neutral or negative) toward the adoption. If the initial
attitude is positive or neutral, this individual is moved to an Engaged
status, and is willing to spread this information to others. Otherwise,
this individual will disregard the information (staying at Informed).
After engaging in discussion for a certain period (the discussion
period \(t_c\)), this individual will move to a decision status (Deciding
about Adoption). The decision making finally leads to one of
three results according to the current attitude: Adopting
if currently holding a positive attitude, or Not to Adopt if
holding a negative attitude, or return to the Engaged stage
for further discussion if holding a neutral attitude. At the Adopting
stage, if an individual can keep the positive attitude for a certain
period (the maintenance period \(t_m\)), then the adoption is Maintained;
otherwise, the individual will give up the adoption during the
maintenance period.
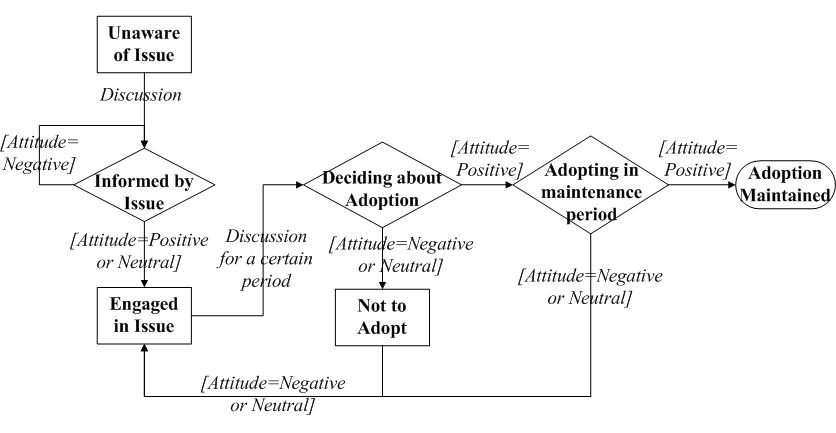
Figure 2. The staged process of an individual to adopt the preventive behaviors. The squares and diamonds represent adoption stages. The comments on arrows describe the conditions for transition. - 2.8
- To formulate individuals' attitude toward adoption, the model introduces a concept of attitude segment from previous work by Deffuant et al. (2002). The attitude segment of individual \(i\) is defined as a mathematic range within \(a_i\pm u_{ai}\), where \(a_i\) is the attitude value and \(u_{ai}\) is the associated uncertainty. The attitude value (\(a_i\)) is a negative or positive real number, initially drawn from a normal distribution \(N (m, \sigma)\). The associated uncertainty (uai) is a positive real number that represents a mix between individual \(i\)'s uncertainty, conviction, and openness to the attitudes of others. For simplicity, it is initialized with the same value for every individual.
- 2.9
- Turning back to Figure 2,
if \(a_i- u_{ai}>0\), individual \(i\) is positive toward
adoption. If \(a_i + u_{ai}<0\), individual \(i\) has a negative
attitude. Otherwise (\(a_i + u_{ai}\geq0\) and \(a_i- u_{ai}\leq0\)),
individual \(i\) is neutral (Deffuant
et al. 2002). Individuals' attitude values vary over time by
discussions with social contacts, and as a result, the staged decision
process is propelled.
Step 3.2: Discussion between individuals
- 2.10
- Corresponding to Assumption 4, once an individual has contact with another, there is a probability \(\gamma\) that they will discuss the adoption issue. This probability is assumed constant in the following experiments for model simplicity, but can be formulated in a more sophisticated manner (discussed in Section 3). During the discussion, an individual's attitude will be influenced by others following rules of "relative agreement" (Deffuant et al. 2002). These rules assume that: 1) the attitude segment with low uncertainty (e.g., strong minded people) are more influential than that with high uncertainty; 2) the more the overlap between attitude segments, the more likely that the individuals may influence one another; 3) when the overlap between two attitude segments is too small, there is no influence. These "relative agreement rules" are formulated as follows:
- 2.11
- Given that individual \(i\) has an attitude segment
\(a_i\pm u_{ai}\), the influence of individual \(i\) on individual
\(j\), when they communicate, is determined by their attitude
agreement, i.e., the overlap section (\(h_{ij}\)) of the two
individuals' attitude segments minus the non-overlap section
\((2u_{oi}-h_{ij})\) (Equation 1 and illustration in Figure 3).
$$ Agreement = h_{ij} - \left( 2 \mu _{ai} - h_{ij} \right) = 2\left( h_{ij} - \mu_{ai} \right) $$ where $$h_{ij} = | \min\{a_i+\mu_{ai}, a_j+\mu_{aj}\}-\max \{a_i-\mu_{ai}, a_j-\mu_{aj}\}|$$ (1) 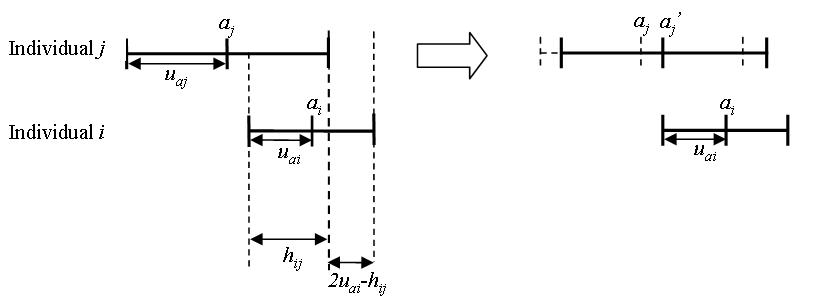
Figure 3. The influence of individual \(i\) on individual \(j\) based on the "relative agreement rules" proposed by Deffuant et al. (2002) - 2.12
- Then, the relative agreement between \(i\) and \(j\) is
calculated by the agreement divided by the total range of \(i\)'s
attitude segment \(2 u_{ai}\):
$$ \frac{2(h_{ij}-\mu_{ai}}{2\mu_{ai}} = \frac{h_{ij}}{\mu_{ai}}-1$$ (2) If \(h_{ij}> u_i\) (the relative agreement\(>0\)), then the modifications of \(a_j\) and \(u_{aj}\) by the interaction with \(i\) are updated as Equation 3:
$$ a_j^{\prime} = a_j + \left( \frac{h_{ij}}{\mu_{ai}} - 1 \right)\left( a_i - a_j \right) $$ $$\mu_{aj}^{\prime}= \mu_{aj} + \left( \frac{h_{ij}}{\mu_{ai}}-1 \right) \left( \mu_{ai}-\mu_{aj} \right)$$ (3) - 2.13
- By varying individuals' attitudes according to their social
network and these formulated interaction rules, the model emulates the
decision making process (Figure 2)
for every individual. As a result, the variation of individuals'
adoption status collectively leads to the diffusion of preventive
behaviors over the population.
Step 4: Interactions between the two diffusion processes (Assumption 5&6)
- 2.14
- Previous three steps have formulated the two diffusion
processes independently, and the last step is to model their
interactions. For model simplicity, the interactions are formulated
into two factors corresponding to Assumption 5 and 6, namely, the
efficacy of preventive behaviors (\(p\)) and the change of attitude by
infection (\(q\)). Specifically:
- If Individual \(i\) is susceptible, the adoption of preventive behaviors can reduce the probability of being infected by \(p\%\);
- If Individual \(i\) is in the latent status, the adoption can reduce the probability of becoming infectious by \(p\%/2\), following the same assumption from Longini et al. (2005);
- If Individual \(i\) is already infectious, the adoption may reduce the probability of infecting others by \(p\%/2\), following the same assumption from Longini et al. (2005);
- When Individual \(i\) starts to manifest symptoms, the attitude value will move toward positivity (Assumption 6). For the sake of simplicity, the attitude value \(a_i\) is assumed to increase by \(q\)% of its uncertainty \(u_{ai}\), i.e., \(a_i+q\%\cdot u_{ai}\). Further, if Individual \(j\) has discussed with \(i\), the attitude value will increase by \(q\%/2\) of associated uncertainty \(u_{aj}\), i.e., \(a_j+q\%\cdot u_{aj}/2\);
- 2.15
- Upon the completion of the four steps described above, a
disease-behavior (dual) diffusion model is established. This model is
then parameterized for simulation and sensitivity analysis.
Model parameterization for simulation
- 2.16
- Based on a pilot study and the literature, Table 1
specifies a default setting for model parameters during the simulation.
The transmissibility of influenza \(r\), its latent period \(t_l\) and
infectious period \(t_i\) are set to be close to a moderate seasonal
influenza (Chowell et al. 2007;
Heymann 2004).
Without much information about individuals' initial attitude, the mean
value (\(m\)) and its standard deviation (\(\sigma\)) are set to 0 and
0.1, respectively, to generate a population with equal proportions of
individuals holding positive, neutral and negative attitude before the
simulation, hereinafter called initially positive, neutral and negative
individuals, respectively. The uncertainty of individuals' attitude
(\(u_a\)), the probability of discussion (\(\gamma\)) are adopted from
previous settings of Deffuant et al. 2005. The efficacy of preventive
behavior on infection (\(p\)) follows findings on the use of antiviral
drugs (Longini et al. 2004).
Table 1: The default disease-behavior scenario for model simulation Components Parameters Values Social Network Population size 5000 Density 0.0026 Average number of contacts of an individual 12 Characteristic path length 5.1 Clustering coefficient 0.7 Number of connected components 1 Influenza Transmission rate (\(r\)) 0.1 Latent period (\(t_l\)) 1 day Infectious period (\(t_i\)) 4 days Preventive Behavior Mean of initial attitude distribution (\(m\)) 0 Standard deviation of initial attitude distribution (\(\sigma\)) 0.1 Initial uncertainty of individuals' attitude (\(u_a\)) 0.05 Probability of discussion (\(\gamma\)) 0.25 Discussion period (\(t_c\)) 1 day Maintenance period (\(t_m\)) 1 day Interaction Efficacy of preventive behavior on infection (\(p\)) 60% Change of attitude by infection (\(q\)) 50% - 2.17
- All individuals are initially assigned susceptible and
unaware of the adoption. The proportions of individuals with positive,
neutral, and negative attitude are equally split in the population. At
the first day of simulation, one individual is randomly selected to be
infectious to initialize the diffusion of influenza. Meanwhile, another
individual is randomly selected to be informed to initialize the
diffusion of preventive behavior. The simulation of both diffusion
processes takes a daily time step over 120 days.
Scenario and sensitivity analysis
- 2.18
- For model outcomes, the diffusion of influenza is described by an epidemic curve that depicts the percent of infection in the population through the course of the epidemic. The diffusion of preventive behaviors is described by an adoption curve that shows the percent of adoption in the population during the diffusion. In addition, the evolution of individuals' attitudes is also displayed by plotting respective proportions of positive, neutral and negative individuals in the population during the diffusion.
- 2.19
- This research first compares how one of the two processes diffuses with and without the other. In other words, the dual-diffusion scenario (from the default parameter settings) is compared to an adoption-only scenario (no disease epidemic: transmission rate \(r=0\)), and to an influenza-only scenario (no behavior diffusion: the probability of communication \(\gamma=0\)). For each of the three scenarios, the average value of 100 realizations is used to construct the epidemic curve, adoption curve, and the attitude evolution curves.
- 2.20
- Furthermore, a sensitivity analysis is conducted to explore effective strategies to control influenza epidemics. In particular, this research is interested in the minimum number of initially positive individuals required to control an epidemic by self-initiated preventive behavior. The proportion of initially positive individuals in the population, denoted as \(\beta_0\), is varied from 0 to 100% by increasing the mean of initial attitude distribution (\(m\)), and represents the effects of previous information campaigns or memory from last outbreaks in the population. The parameter \(\beta_0\) is paired with three other parameters respectively in the sensitivity analysis, including: 1) the transmission rate of influenza \(r\), varying from 0 to 0.2. When \(r\) ranges from 0.08–0.1, it represents a seasonal influenza scenario where the basic reproductive number R\({}_0\) is between 1.2–1.3 (Chowell et al. 2007). When \(r\) varies from 0.1–0.2, it represents a pandemic influenza scenario in which R\({}_0\) increases to 1.6–1.7(Mills et al. 2004; Yang et al. 2009); 2) the probability of discussion \(\gamma\) (from 0 to 1). When \(\gamma\) increases to very high values, like 90% or 100%, the modeled information diffusion could somewhat match the effects of mass media; and 3) the uncertainty of individuals' attitude (\(u_a\)), ranging from 0.01 to 0.2 with an increment of 0.01. Low values represent conservative populations, while high values represent progressive populations. Each pair of parameters is given alternative values while holding all of other parameters as default in Table 1. For any pair of parameter values, 100 model realizations are performed to estimate the percent of infection in the population. The epidemic is assumed to be controlled if the resultant percent of infection is less than 10% of the population.
Simulation
results and discussion
-
Scenario analysis
- 3.1
- Figure 4 compares
the diffusion of self-initiated preventive behavior with and without an
influenza epidemic. For the adoption-only scenario (transmission rate
\(r=0\)), the adoption curve starts with an abrupt rise during the
first 20 days, and then increases slowly till the last day (the red
dashed line in Figure 4a).
Approximately 50% of the population would adopt the preventive
behavior. The early abrupt rise can be attributed to the initially
positive individuals, who are informed through network communication
and quickly adopt the preventive behavior. The later slow increase can
be explained as a number of initially neutral individuals changing
their attitudes to positive after discussions (the red curve with
circles in Figure 4b), and
finally adopting the preventive behaviors. Compared to the
adoption-only scenario, adding the diffusion of influenza causes a
marked increase in adopters (the blue solid line in Figure 4a). The total number of adopters has
the same rise as the adoption-only scenario before Day 20, but remains
a fast increase from Day 20 to 60. This later fast increase is because
a number of negative individuals change to positive attitudes due to
infection (the blue curve with diamonds in Figure 4b).
More individuals, therefore, finally adopt the preventive behaviors and
the percent of adoption reaches a higher level (about 70% of the
population).
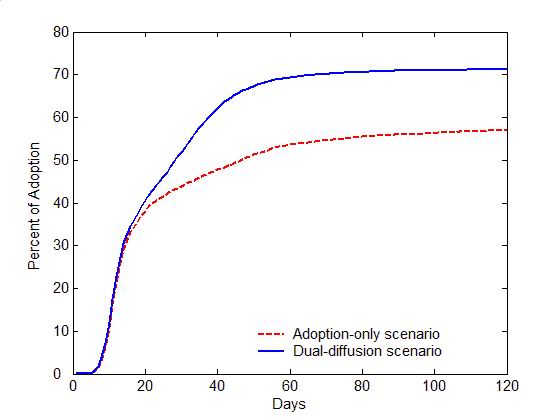
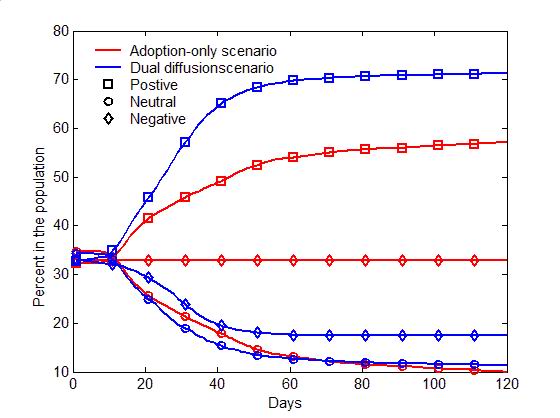
(a) Adoption curves (b) Evolution of attitudes Figure 4. The comparison of the dual-diffusion scenario (blue) to the adoption-only scenario (red). (a) The adoption curves depict the percent of adoption in the population over time. The solid line represents the dual-diffusion scenario (transmission rate \(r=0.1\)), while the dash line represents the adoption-only scenario with \(r=0\). (b) The evolution of the proportion of positive (square), neutral (circle) and negative (diamond) individuals in the population over time. - 3.2
- Figure 5
illustrates the difference between the spread of influenza with and
without the diffusion of preventive behaviors. For the influenza-only
scenario (the probability of discussion \(\gamma=0\)), influenza can
infect nearly entire population within 30 days (the red dash line in
Figure 5a). Due to the lack of
discussion, individuals are unaware of the preventive behavior, and no
one starts the decision making process toward adoption (the flat red
curves in Figure 5b). Once the
diffusion of preventive behaviors is added (\(\gamma=0.25\)), the
transmission of influenza can be significantly slowed with only half of
the population being infected (the blue solid line in Figure 5a). Through discussion, an
increasing number of individuals are gradually aware of the adoption
issue, change their attitude to positive, and decide to adopt
preventive behaviors, which reduce the transmissibility of influenza
(See the blue curves in Figure 5b).
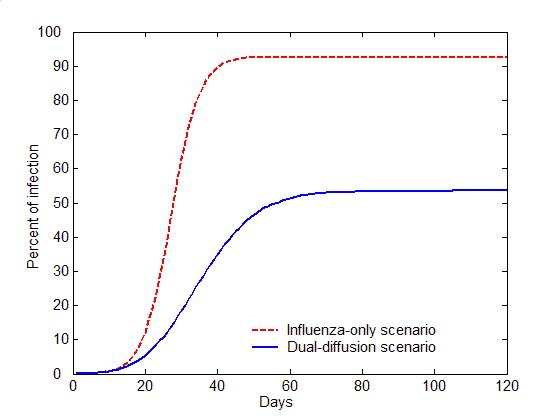
(a) Epidemic curves (b) Evolution of attitudes Figure 5. The comparison of the dual-diffusion scenario (blue) to the influenza-only scenario (Red). The epidemic curves depict the percent of infection in the population over time. The solid line represents the dual-diffusion scenario (discussion probability \(\gamma=0.25\)), while the dash line represents the influenza-only scenario with \(\gamma=0\). (b) The evolution of the proportion of positive (square), neutral (circle) and negative (diamond) individuals in the population over time. Sensitivity analysis
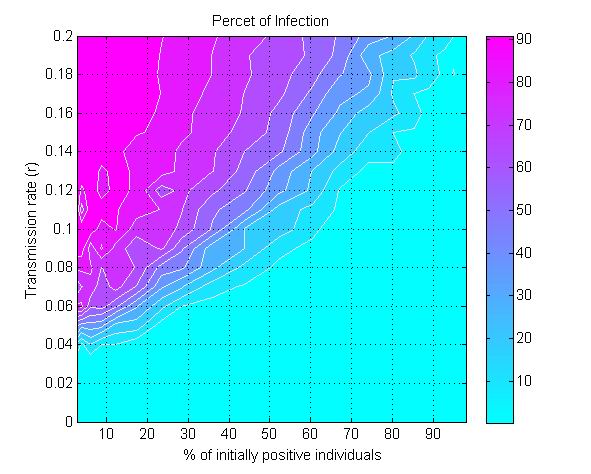
- 3.3
- The model is further used to explore the minimum value of
\(\beta_0\) (the proportion of initially positive individuals in the
population) needed to control influenza epidemic by self-initiated
preventive behavior. Figure 6a
displays the percent of infection as a function of \(\beta_0\) and the
transmission rate (\(r\)). For any given value of \(r\), there exists a
critical value for \(\beta_0\) to reduce the percent of infection under
10% (the cyan colored area in Figure 6a).
The greater the transmission rate \(r\), the higher the threshold value
for \(\beta_0\) will be. For a moderately transmissible influenza
(\(r=0.1\)), e.g., the seasonal influenza, the epidemic can be
controlled if at least 60% of the population initially holds positive
attitude (\(\beta_0\geq 60\)%). For a highly transmissible strain of
influenza (\(r=0.2\)), e.g., the 1918 pandemic strain (Ferguson et al. 2006), the
threshold value for \(\beta_0\) needs be raised to nearly 95% of the
population to control the epidemic.
(a) (b) 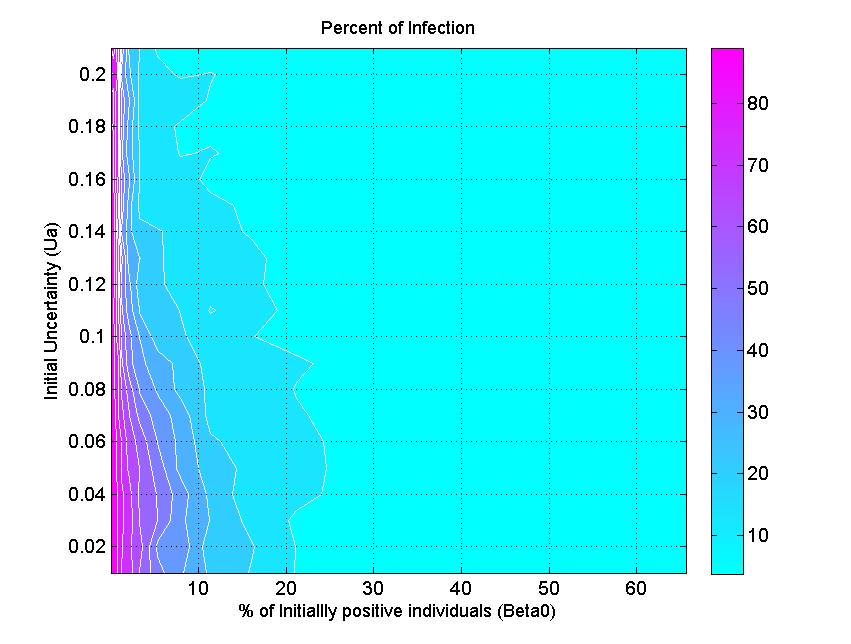
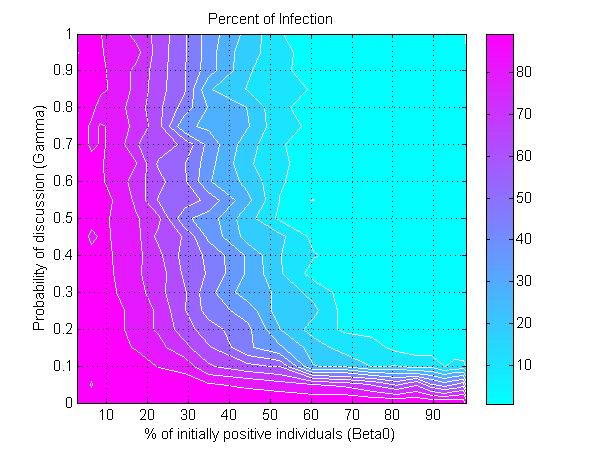
(c) Figure 6. The percent of infection (represented by color ramp) as a function of the proportion of initially positive individuals (\(\beta_0\)) and a) the transmission rate (\(r\)), b) the probability of discussion (\(\gamma\)), and c) the uncertainty of individual attitude (\(u_a\)). The full cyan area indicates that the percent of infection is under 10%, and the influenza epidemic is controlled. - 3.4
- Another parameter that impacts epidemics is the probability of discussion between individuals (\(\gamma\)). Figure 6b shows that a 10% chance of discussion between individuals (\(\gamma=0.1\)) is the minimum requirement to control an influenza epidemic. Given that all individuals are initially unaware of the preventive behavior, they need to be gradually informed to start their adoption processes. With a 10% chance of discussion, \(\beta_0\) must be greater than 90% (almost all individuals) to control the epidemics. If the probability of discussion can be raised to 0.5, the \(\beta_0\) only needs to reach 50% for a successful control. A higher probability of discussion means that individuals can be informed faster and make earlier decision toward adoption. The increasing number of early adopters could timely limit the transmission of influenza and thus reduces the disease incidence. This result suggests the importance of encouraging individuals to discuss the adoption issue. A mass media bombardment strategy could be useful to attract public attention onto the adoption issue through television, newspapers, and the internet.
- 3.5
- Figure 6c indicates
the effect of initial uncertainty of attitude (\(u_a\)) on the total
infection. The general pattern shows that a conservative population
with low attitude uncertainty (e.g., \(u_a=0.02\)) requires more
initially positive individuals to control the epidemics. When the
uncertainty elevated to 0.2, only 5% of the population is needed to
initially hold positive attitude for a successfully disease control.
There are several two possible reasons. First, the greater uncertainty
means wider individual attitude segments (Figure 3),
and thus their attitude segments are more likely to overlap, which in
turn triggers attitude influence between them. Second, the greater
uncertainty associated with individuals' attitude also means their
attitude would have a big turn toward adoption, when they were infected
or when they were aware of infection risks from surrounding people.
More adopters would occur in the early phase of disease transmission
and prevent the wide spread of the disease.
Limitations
- 3.6
- Still in its infancy, the presented model is so far a crude
approximation to the reality with following limitations. First, the
infectious diseases and human self-initiated behaviors can diffuse
through different networks, while this research assumed an identical
network for model simplicity. This assumption can be relaxed by linking
individuals with two networks: a contact network for disease
transmission and a communication network for behavior diffusion. The
two diffusion processes can be simulated on the two networks
respectively. Second, the information diffusion through the mass media
and Internet are not considered, which may play an important role in
the diffusion of preventive behaviors. An easy solution is to add into
the model a broadcasting rate (as a parameter), i.e., the chance of an
individual being informed through the mass-media or internet. With such
a rate, a number of individuals can be randomly selected to be informed
in every time step. Third, the communication rate between individuals
is assumed constant for model simplicity. To be more realistic, this
rate can vary with the size of epidemic, i.e., the more infections in
the population the more likely individuals will discuss. For example,
the discussion rate can be formulated as a function of the total number
of infections at a time step:
$$\gamma (t) = \frac{1 - e^{\frac{N_I(t)}{\beta}} }{1 + e^{\frac{N_I(t)}{\beta}} } \in [0,1] $$ where \(N_I(t)\) is the number of infections at time step \(t\) and \(\beta\) is the coupling parameter that relates discussion to infection. The compensation for these limitations can improve the model accuracy, but also increase the complexity. It is argued that the goal of modeling is not to look for exactly what may happen, but rather for differences in outcomes between different scenarios (McKenzie 2004). In this sense, the proposed model framework could be a valuable prototype to guide the design of more realistic working models.
Conclusions
- 4.1
- This article has proposed a new prototype model to simultaneously simulate the disease transmission and self-initiated preventive behaviors against the disease. Based on the relative-agreement rules, this model explicitly represents discrete individuals, their contact structure, and most importantly, their progressive decision making processes, resulting in individualized responses to disease risks. This model allows disease transmission to alter individuals' decision making toward preventive behavior, which in turn affects the disease transmission. The comparison study shows that any model that fails to account for this interaction mechanism could not accurately portray a realistic epidemic.
- 4.2
- Using the proposed model, this research also explored critical points (threshold values) in the model parameter space to control influenza epidemic solely by self-initiated preventive behavior, for example, minimum values for the initially positive population size, the communication rate, and the attitude uncertainty. For disease control, it is not practical to have all individuals holding positive attitude toward adoption at the beginning of an epidemic. Many individuals may be reluctant to adopt preventive behaviors because of their knowledge, prior experience, incomes, occupations, and other factors (Nichol & Zimmerman 2001; Toy et al. 2005). The sensitivity analysis estimates that at least 60% of the population with an initial positive attitude is necessary to successfully control a moderately transmissible influenza. This threshold would elevate as the transmissibility of influenza rises, but can also be reduced by encouraging discussions between individuals or by increasing the mind-openness of individuals' toward preventive behavior. These threshold effects shed insights on preventive strategy design to deal with the current circumstances that new vaccines are often insufficient to combat emerging communicable diseases.
References
- AMBLARD, F., &
Deffuant, G. (2004). The role of network topology on extremism
propagation with the relative agreement opinion dynamics. Physica
A: Statistical Mechanics and its Applications, 343(15),
725–738. [doi:10.1016/j.physa.2004.06.102]
ANDERSON, R. M., & May, R. M. (1992). Infectious Diseases of Humans: Dynamics and Control. New York: Oxford University Press.
BAUMAN, K. E., & Ennett, S. T. (1994). Peer influence on adolescent drug use. American Psychologist, 49(9), 820. [doi:10.1037/0003-066X.49.9.820]
BIAN, L., & Liebner, D. (2007). A network model for dispersion of communicable diseases. Transactions in GIS, 11(2), 155–173. [doi:10.1111/j.1467-9671.2007.01039.x]
CDC. (2008). Preventing Seasonal Flu, 2009, from http://www.cdc.gov/flu/protect/preventing.htm
CHOWELL, G., Miller, M. A., & Viboud, C. (2007). Seasonal influenza in the United States, France, and Australia: transmission and prospects for control. Epidemiology and Infection, 136(6), 852–864.
CHRISTAKIS, N. A., & Fowler, J. H. (2007). The Spread of Obesity in a Large Social Network over 32 Years. New England Journal of Medicine, 357(4), 370–379. [doi:10.1056/NEJMsa066082]
CHRISTAKIS, N. A., & Fowler, J. H. (2008). The collective dynamics of smoking in a large social network. New England Journal of medicine, 358(21), 2249–2258. [doi:10.1056/NEJMsa0706154]
DEFFUANT, G., Amblard, F., Weisbuch, G., & Faure, T. (2002). How can extremism prevail? A study based on the relative agreement interaction model. Journal of Artificial Societies and Social Simulation, 5(4), 1. https://www.jasss.org/5/4/1.html
DEFFUANT, G., Huet, S., & Amblard, F. (2005). An Individual-Based Model of Innovation Diffusion Mixing Social Value and Individual Benefit. American Journal of Sociology, 110(4), 1041–1069. [doi:10.1086/430220]
EPSTEIN, J. M., Parker, J., Cummings, D., & Hammond, R. A. (2008). Coupled contagion dynamics of fear and disease: mathematical and computational explorations. PLoS One, 3(12), e3955. [doi:10.1371/journal.pone.0003955]
FENICHEL, E. P., Castillo-Chavez, C., Ceddia, M., Chowell, G., Parra, P. A. G., Hickling, G. J., . . . Perrings, C. (2011). Adaptive human behavior in epidemiological models. Proceedings of the National Academy of Sciences, 108(15), 6306–6311. [doi:10.1073/pnas.1011250108]
FERGUSON, N. M., Cummings, D. A., Fraser, C., Cajka, J. C., Cooley, P. C., & Burke, D. S. (2006). Strategies for mitigating an influenza pandemic. Nature, 442(7101), 448–452. [doi:10.1038/nature04795]
FUNK, S., Bansal, S., Bauch, C. T., Eames, K. T., Edmunds, W. J., Galvani, A. P., & Klepac, P. (2014). Nine challenges in incorporating the dynamics of behaviour in infectious diseases models. Epidemics, 10, 21-15. [doi:10.1016/j.epidem.2014.09.005]
FUNK, S., Gilad, E., Watkins, C., & Jansen, V. A. (2009). The spread of awareness and its impact on epidemic outbreaks. Proceedings of the National Academy of Sciences, 106(16), 6872–6877. [doi:10.1073/pnas.0810762106]
FUNK, S., Salathé, M., & Jansen, V. A. (2010). Modelling the influence of human behaviour on the spread of infectious diseases: a review. Journal of the Royal Society Interface, 7(50), 1247–1256. [doi:10.1098/rsif.2010.0142]
GLANZ, K., Rimer, B. K., & Lewis, F. M. (2002). Health Behavior and Health Education: Theory, Research, and Practice (3rd ed.). San Francisco: Jossey-Bass.
GRANOVETTER, M. (1978). Threshold models of collective behavior. American journal of sociology, 83(6), 1420–1443. [doi:10.1086/226707]
HÄGERSTRAND, T. (1967). Innovation diffusion as a spatial process. Chicago: University of Chicago Press.
HEYMANN, D. L. (2004). Control of Communicable Diseases Manual (18th ed.). Washington, DC: American Public Health Association.
KERMACK, W. O., & McKendrick, A. G. (1927). A contribution to the mathematical theory of epidemics. Proceedings Royal Statistics Society, 115(772), 700–721. [doi:10.1098/rspa.1927.0118]
KISS, I. Z., Cassell, J., Recker, M., & Simon, P. L. (2010). The impact of information transmission on epidemic outbreaks. Mathematical biosciences, 225(1), 1–10. [doi:10.1016/j.mbs.2009.11.009]
KOOPMAN, J. S., & Lynch, J. W. (1999). Individual causal models and population system models in epidemiology. American Journal of Public Health, 89(8), 1170–1174. [doi:10.2105/AJPH.89.8.1170]
LONGINI, I. M., Halloran, M. E., Nizam, A., & Yang, Y. (2004). Containing pandemic influenza with antiviral agents. American Journal of Epidemiology, 159(7), 623–633. [doi:10.1093/aje/kwh092]
LONGINI, I. M., Nizam, A., Xu, S., Ungchusak, K., Hanshaoworakul, W., Cummings, D. A. T., & Halloran, M. E. (2005). Containing pandemic influenza at the source. Science, 309(5737), 1083–1087. [doi:10.1126/science.1115717]
MCKENZIE, F. E. (2004). Smallpox models as policy tools. Emerging Infectious Diseases, 10(11), 2044–2047. [doi:10.3201/eid1011.040455]
MELONI, S., Perra, N., Arenas, A., Gómez, S., Moreno, Y., & Vespignani, A. (2011). Modeling human mobility responses to the large-scale spreading of infectious diseases. Scientific reports, 1 (62): 62. [doi:10.1038/srep00062]
MILLS, C. E., Robins, J. M., & Lipsitch, M. (2004). Transmissibility of 1918 pandemic influenza. Nature, 432(7019), 904–906. [doi:10.1038/nature03063]
NICHOL, K. L., & Zimmerman, R. (2001). Generalist and Subspecialist Physicians' Knowledge, Attitudes, and Practices Regarding Influenza and Pneumococcal Vaccinations for Elderly and Other High-Risk Patients. Archives of Internal Medicine, 161(22), 2702–2708. [doi:10.1001/archinte.161.22.2702]
PERISIC, A., & Bauch, C. T. (2009). Social contact networks and disease eradicability under voluntary vaccination. PLoS computational biology, 5(2), e1000280. [doi:10.1371/journal.pcbi.1000280]
POLETTI, P., Caprile, B., Ajelli, M., Pugliese, A., & Merler, S. (2009). Spontaneous behavioural changes in response to epidemics. Journal of theoretical biology, 260(1), 31–40. [doi:10.1016/j.jtbi.2009.04.029]
RELUGA, T. C. (2010). Game theory of social distancing in response to an epidemic. PLoS computational biology, 6(5), e1000793. [doi:10.1371/journal.pcbi.1000793]
SAHNEH, F. D., Chowdhury, F. N., & Scoglio, C. M. (2012). On the existence of a threshold for preventive behavioral responses to suppress epidemic spreading. Scientific reports, 2(632), 10.1038/srep00632. [doi:10.1038/srep00632]
TOY, W. C., Janosky, J. E., & Laird, S. B. (2005). Influenza immunization of medical residents: knowledge, attitudes, and behaviors. AJIC: American Journal of Infection Control, 33(8), 473–475. [doi:10.1016/j.ajic.2005.06.003]
VALENTE, T. W. (1995). Network Models of the Diffusion of Innovations. Cresskill: Hampton Press.
WATTS, D. J., & Strogatz, S. H. (1998). Collective dynamics of'small-world networks. Nature, 393(6684), 409–410. [doi:10.1038/30918]
WEINSTEIN, N. D., & Sandman, P. M. (1992). A model of the precaution adoption process: Evidence from home radon testing. Health Psychology, 11(3), 170–180. [doi:10.1037/0278-6133.11.3.170]
WU, Q., Fu, X., Small, M., & Xu, X.-J. (2012). The impact of awareness on epidemic spreading in networks. Chaos: An Interdisciplinary Journal of Nonlinear Science, 22(1), 013101. [doi:10.1063/1.3673573]
YANG, Y., Sugimoto, J. D., Halloran, M. E., Basta, N. E., Chao, D. L., Matrajt, L., Potter, G., Kenah, E. Longini Jr, I. M. (2009). The transmissibility and control of pandemic influenza A (H1N1) virus. Science, 326(5953), 729–733. [doi:10.1126/science.1177373]