
 Abstract
- The bounded confidence model and its variants applied to moderate and extremist agents exhibit three types of attractors: central clusters, double extreme and single extreme clusters. These attractors are observed when the models include a dynamics on the uncertainties tending to decrease the moderate uncertainties when interacting with extremists. We show here that a new stationary state appears when the uncertainties are fixed, for large uncertainties of the moderates. In this stationary state, the opinions of moderate agents keep fluctuating without clustering, altogether forming a stable density which shape changes significantly when the parameters vary.
- Keywords:
- Bounded Confidence Model, Opinion Dynamics, Noise, Fluctuations, Extremists
Introduction
- 1.1
- Understanding how extremist minorities can influence moderate majorities is a major issue in social sciences. The spreading of minority opinions (Galam 2002) is of growing concern in order to evaluate the impact of new emerging opinions: spreading of a reform proposal, debates on fashion products etc. ... In social psychology for instance, Moscovici brought substantial advances in this understanding with famous experiments about the influence of minorities in small groups (Moscovici et al. 1969). It is more generally an issue in the history of the last century with the rise of extreme ideologies leading to totalitarian states or in the more recent period with terrorist attacks perpetrated by religious extremists. In these cases, the propagation of extremist views is considered as a cause of murder and destruction. However, opinions that were considered extremist two centuries ago, for instance defending equality between men and women, have become the majority view in western culture and hence the propagation of extremism can also be considered as a major progress. Therefore this issue of extremism propagation should be considered without any value judgment.
- 1.2
- Computer simulations can provide some insights on this issue, particularly when considering large populations on which it is impossible to perform experiments. This approach requires expressing clearly some hypotheses on the rules of interactions modifying agent opinions and then to explore the consequences of these hypotheses on the collective behaviour of interacting agents. Several models are available and already addressed the issue of extreme opinion propagation or minority influence.
- 1.3
- For some of them (Axelrod 1997; Galam & Moscovici 1991; Sznadj-Weron 2005), the opinion can only take two values (e.g. A or B) (see Castellano et al. 2009 for a review of opinion dynamics models). The general mechanism is based on a function of the opinion in the local neighbourhood that determines if agents switch their opinion or not. Binary opinions are simple and fit to decision-making issues, but it is impossible to state if opinion A is more extreme than opinion B.
- 1.4
- Other models include more possible values for the opinion. We consider here one of the most popular continuous opinion models, the bounded confidence (BC) model (Deffuant et al. 2001; Hegselmann & Krause 2002; Krause 2000; Weisbuch et al. 2002) from which several analytical models were developed (Canuto et al. 2012; Tabatabaei et al. 2014). Its principles are very close to the theory of social comparison (Festinger 1954) and to social judgment theory (Sherif & Hovland 1961). The agents are characterized by an initial opinion (generally supposed to be between -1 and 1 as in the present study, or between 0 and 1) and a threshold that can be interpreted as an uncertainty around this opinion. The dynamics in the version of (Deffuant et al. 2001) picks random pairs of agents that influence each other by slightly moving their opinions towards each other, but only if the distance between their opinions is lower than the uncertainty. When all the agents share the same uncertainty, the opinions progressively converge to a set of opinion clusters, with all agents of a cluster sharing the same opinion and with an increasing number of clusters when the uncertainty decreases.
- 1.5
- The model has been criticized because when, for some randomly chosen interactions with a low probability, the confidence is not bounded (i.e. any opinion can attract any other), the opinion distribution always converges to a single cluster (possibly after a very long number of iterations) (Mäs et al. 2010; Mäs & Flache 2013; Takács et al. 2014). However for other types of noise: adding to the opinion of each individual, a random number uniformly distributed between −0.3 and +0.3, multiplied by the uncertainty of this individual, the qualitative behaviour of the model holds, keeping a diversity of clusters (Deffuant 2006; Pineda et al. 2011), which weakens the criticisms.
- 1.6
- With variants of this model, Castellano et al. (2009) and Deffuant (2006) study the impact of extremists on moderate agents. The extremists are initialized with extreme opinions (+1 or -1) and all share the same small uncertainty, whereas the moderates are initialized with an opinion uniformly drawn between -1 and +1 and the same larger uncertainty. Moreover, in these models, both opinions and uncertainties are modified during interactions. The extremists tend to reduce the uncertainty of the moderates during interactions. By construction of the model, the extremists are more influential and less likely to change their opinions and uncertainties. More recently, there is a renewed interest in studying the effect of extremism propagation such as Hegselmann (2014) and Hegselmann and Krause (2015) who studied the influence of "radical" individuals on "normal" individuals, "radicals" being agents with low uncertainty and an opinion close to the upper bound.
- 1.7
- Depending on the initial number of extremists and the initial uncertainty of the moderates, three convergence types appear: central clusters, double extreme clusters, single extreme cluster. Recently Meadows and Cliff (2012) claimed to have found a different attractor map in the parameter space, but Deffuant et al. (2013) show that the difference is due to a different criterion for stopping the simulations. The single extreme cluster was somehow unexpected and subject of specific studies (Deffuant & Weisbuch 2008). More recent models of continuous opinions, instead of adding extremists in their initial population, study dynamics including a negative influence which can also lead to the emergence of polarization and extremism (Flache & Mäs 2008; Huet et al. 2008; Huet & Deffuant 2010; Jager & Amblard 2004; Mäs & Flache 2013; Moussaïd 2013).
- 1.8
- This paper comes back to the original BC model with fixed uncertainties and studies its behaviour when adding extremists. To the knowledge of the authors, such a study is not reported in the literature. The primary goal of this paper is to improve the knowledge of the BC model, broadly studied by scholars. Our main result is that the model with fixed uncertainties exhibits a stationary state that has not been observed in models with changing uncertainties. In this stationary state, the opinions of the moderate agents keep fluctuating with different amplitudes depending on the parameters (uncertainty, proportion of extremists) whereas the opinion density distribution remains stable.
- 1.9
- We study this stationary state in more details with a large number of agents (10 millions) and a model of evolving density, corresponding to the limit case of an infinity of agents. The density distribution shows several patterns, depending on the uncertainty of moderates, the proportion of extremists and sometimes the intensity of the interactions.
- 1.10
- In the next section, we describe the model and the rules determining the convergence types. Section 3 presents the map of steady states in the parameter space and gives more details about the new stationary state. The final section is devoted to a discussion of this result.
The
model and convergence patterns
-
The bounded confidence model (BC) with extremist and fixed uncertainties
- 2.1
- Following the model of Deffuant (2006), in a population of \(N\) agents, we consider two types of agents, the moderates and the extremists. The moderate agents share the same uncertainty \(u\) and the extremists the uncertainty \({u_e}\) (a positive real number). We take here a very small value of \({u_e}\) compared to \(u\) (typically \({u_e} \leqslant u/100\) ). It leads to very small opinion variations of extremists: extremist opinions can be considered as quasi static in view of these small variations. The opinions of the moderate agents are uniformly drawn between −1 and +1. We choose an opinion range equal to \([-1,+1]\), as in the original paper about the model with extremists (Deffuant et al. 2002), because it facilitates the interpretation of extreme opinions against (−1) or in favour (+1) a given issue; this choice has of course no impact on the patterns emerging from the dynamics. The proportion of extremists in the population is denoted \({p_e}\) and half of them is initialised with opinion +1 and the other half with opinion −1.
- 2.2
- The dynamics of the opinions is the BC model in its version of Deffuant et al. (2001) and the uncertainties remain constant, which is the major difference with Deffuant et al. (2002) and Deffuant (2006).
- 2.3
- At each time step, \(\frac{N}{2}\) random pairs interact:
each agent is paired once in one period. A randomly drawn agent \(i\)
with opinion \({x_i}\), an uncertainty \({u_i}\) meets with a randomly
drawn agent \(j\) with opinion \({x_j}\) and uncertainty \({u_j}\).
Their opinions are modified according the following rule:
$$\left\{ {\begin{array}{*{20}{l}} {{\kern 1pt} if\;{\kern 1pt} |{x_i} - {x_j}| < {u_i}{\kern 1pt} \;then\;{\kern 1pt} {x_i}: = {x_i} + \mu ({x_j} - {x_i})} \\ {{\kern 1pt} if\;{\kern 1pt} |{x_i} - {x_j}| < {u_j}{\kern 1pt} \;then\;{\kern 1pt} {x_j}: = {x_j} + \mu ({x_i} - {x_j})} \\ {} \end{array}} \right.$$ (1) - 2.4
- In this equation, \(\mu \) is a parameter of the model that
rules the intensity of the influence (generally \(0 < \mu
\leqslant 0.5\)). The interaction updating mainly depends on two
issues: 1) the number of individuals involved in the interactions; 2)
the updating procedure (synchronous or asynchronous, see Alizadeh & Cioffi-Revilla 2015
for more details). In our model we chose pair interactions, as in
Deffuant et al. (2002)
and Deffuant (2006). We
also chose a synchronal updating, i.e. all individuals' opinions are
updated simultaneously at each time step. Therefore, we have a
simultaneous updating of the opinions as in the probability
distribution version of the model described in section 3.
Indicators and rules defining convergence patterns
- 2.5
- Deffuant et al. (2002)
and Deffuant (2006)
identify three main patterns of convergence: central, double extreme
and single extreme convergence (see Figure 1).
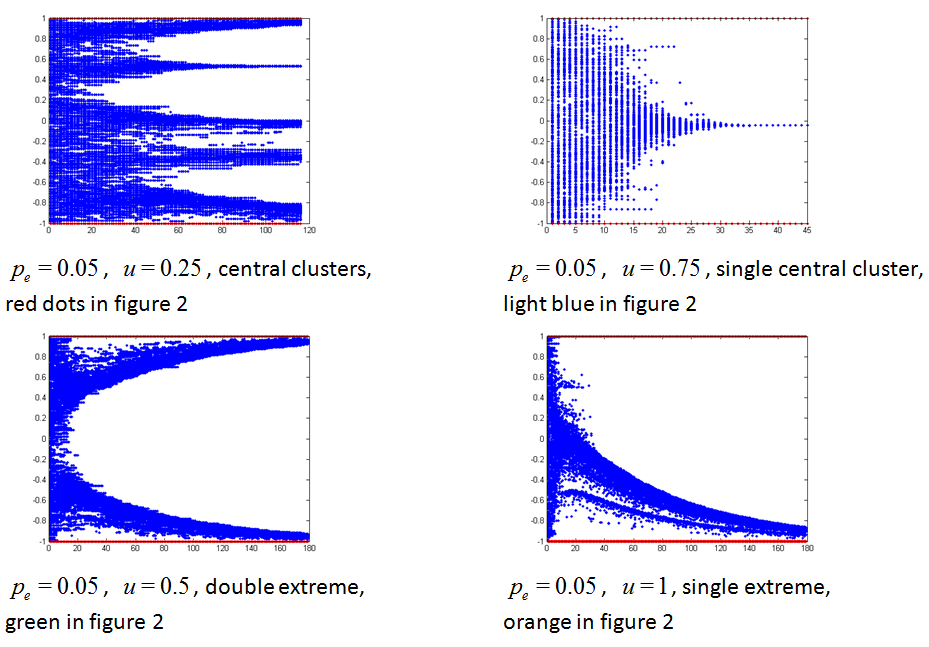
Figure 1. Examples of opinion trajectories for different usual convergence patterns. The vertical axis is the opinion value; the horizontal axis is the number of iterations; the opinions of the 400 agents are represented at each time step. \({p_e}\) is the proportion of extremists, \(u\) is the uncertainty of the moderates. - 2.6
- We use the same rules as in Deffuant (2006) for classifying
automatically the convergence patterns, that we are recalling in this
section. We sum all opinion variations of all individuals at each time
step. If this sum is lower than 0.001, we will consider the convergence
of the model and the simulation will stop. The indicators are based on
the generalized number of clusters and the average absolute value of
moderate opinions. We define the generalized number of clusters in a
population involving \(k\) opinion clusters \({x_i}\), each with a
proportion \({r_i}\) of agents as:
$$c = \frac{1}{{\sum\limits_{i = 1}^k r_i^2}}$$ (2) - 2.7
- It corresponds to a smooth number of clusters obtained following the method defined in Derrida and Flyvbjerg (1986). Note that the detailed algorithm can be found in Deffuant (2006) and in Appendix A. A cluster of opinions contains opinions which are different from each other from a maximum value equal to \(\varepsilon \).
- 2.8
- We also define the average of the absolute value of the
moderate opinions, noted \(X\), which indicates how extreme the
population is:
$$ X = \frac{{\sum\limits_{i = 1}^N \left| {{x_i}} \right|}}{N}$$ (3) - 2.9
- Finally, we combine these two indicators in order to
characterize the convergence type. We use the following rules, inspired
from Deffuant (2006):
- \(X < 0.75\) and \(c < 1.33\): convergence to a single moderate cluster, represented in "light blue" on Figure 2;
- \(X > 0.75\), \(c > 1.66\) and \(c < 2.33\): convergence to two extreme clusters, represented in "green" on Figure 2;
- \(X > 0.75\) and \(c < 1.66\): convergence to a single extreme cluster, represented in "orange" on Figure 2;
- \(c > 2.33\): convergence to several clusters, represented in "red" on Figure 2;
- no convergence after 2000 time steps (the opinions keep fluctuating), represented in "dark blue" on Figure 2.
- 2.10
- Using these rules, it is possible to classify the different convergence patterns obtained when the parameters vary.
Experiments
and map of stationary states
- 3.1
- We perform an experimental design with a population of 400
individuals and \(\mu = 0.5\) for the BC model. The parameters varying
in the experiments are: \({p_e}\) \( \in [0;1]\) (the proportion of
extremists ) and \(u\) \( \in [0.02;2]\) (the uncertainty of
moderates). We kept the ratio between moderates' and extremists'
uncertainties at the value of 100. The map of convergence types is
reported in Figure 2 (see
Appendix B for more details). Figure 1
shows examples of the usual patterns already identified in the
literature.
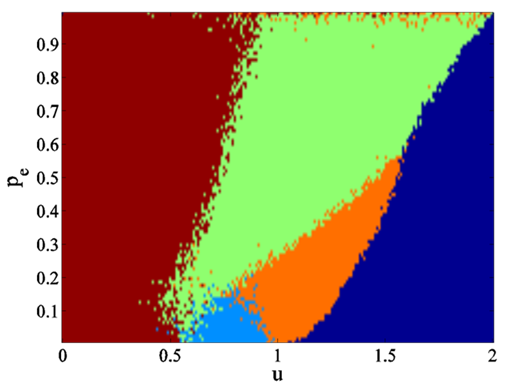
Figure 2. Map of convergence patterns for 400 agents. Each dot of the map represents a simulation and the dot's colour codes for the type of convergence: light blue: a single moderate cluster; green: double extreme clusters; orange: a single extreme cluster; red: several moderate clusters; dark blue: no clustering (opinions keep fluctuating). - 3.2
- The regions of central and double extreme patterns are
similar to the ones found with the BC model with changing
uncertainties. However, two main differences appear:
- the single extreme pattern appears in a different parameter zone (in orange on Figure 2) and in this zone the single extreme convergence is systematic, whereas with the model with changing uncertainties, there is a probability to get also a central convergence;
- in a large parameter zone (high values of \(u\)) the opinions do not stabilise. Even if we increase the number of time steps, the moderate opinions do not cluster and keep fluctuating. With the model with changing uncertainties, the model converges to a single extreme or a moderate cluster for the same values of \({p_e}\) and \(u\). Simulations with 10 millions agents (see Figure 3) show that the distribution of the agents reaches a steady state. The stable distribution shows several maxima at opinions \( - 0.5; - 0.25;0.25;0.5\). The previous research did not report this pattern, as far as we know.
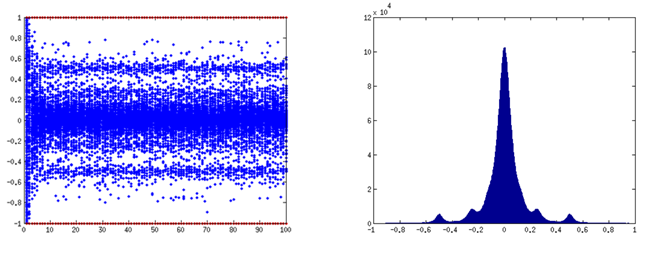
Figure 3. Stationary distribution of fluctuating moderates. \(u\)=1.8, \({p_e} = 0.05\) and \(\mu = 0.5\). Left panel: time trajectories of the opinions with 400 agents. Right panel: stationary distribution with 10 Million agents, dark blue in Figure 2. - 3.3
- We now analyse these differences in more details.
Systematic single extreme in a restricted parameter zone
- 3.4
- The single extreme convergence zone takes place for \(u\) around 1 and \({p_e} < 0.2\) (in orange on Figure 2). The process of single extreme convergence is similar to the one identified in previous research (Deffuant & Weisbuch 2008): in a first step a central cluster of opinions emerges. Then because the uncertainty is close to 1, when the distribution is narrow and not perfectly at the centre, there are significantly more agents that interact with only one extreme (positive or negative). Hence small fluctuations in this central cluster necessarily lead to the drift to this extreme (see Figure 1).
- 3.5
- With the model with changing uncertainties, the single
extreme convergence takes place for similar low proportion of
extremists but also for initial uncertainties of the moderates much
larger than 1. Indeed, the dynamics of uncertainties decreases these
larger uncertainties progressively when the moderates are in the
central cluster because of the influence of extremists, until these
uncertainties reach a value close to 1 that leads to the unstability.
However, the uncertainty may sometimes decrease below 1 before a
significant drift towards one or the other extreme, leading to a
central convergence (see Deffuant
& Weisbuch 2008). This decrease below 1 does not take
place when the uncertainties are fixed hence the unstability of the
central cluster systematically leads to a single extreme convergence
when the uncertainty of the moderates is adequate.
Moderate opinions keep fluctuating for large values of uncertainty
- 3.6
- When the opinions keep fluctuating, it seems particularly
interesting to study a density distribution model derived from the
agent model, and representing the case of an infinite number of agents.
This type of model makes the different phenomena more apparent because
the initial uniform distribution can be perfect and eliminate the
random irregularities of the agent based model. The model includes an
array of \(n\) values \({\rho _i}\) representing the probability that
agents have an opinion \(x\) located in an interval of size \(1/n\) and
centred on \(i/n\):
$${\rho _i} = P\left( {\frac{{2i - 1}}{{2n}} \leqslant x \leqslant \frac{{2i + 1}}{{2n}}} \right)$$ (4) - 3.7
- Initially, the density distribution of the moderate opinions is uniform, and for all \(i\), \({\rho _i} = \frac{{1 - {p_e}}}{n}\). The extreme values of the distribution are given a density \({p_e}/2\) of extremists. Then we classically compute the flows between the cells of the density because of the interactions and update iteratively (see for instance Deffuant & Weisbuch 2008 for details).
- 3.8
- On Figure 4 we can
check that the convergence density provides a good approximation of the
one derived from the agent model with a large population. Therefore, we
can use the density model to study the properties of this stationary
state.
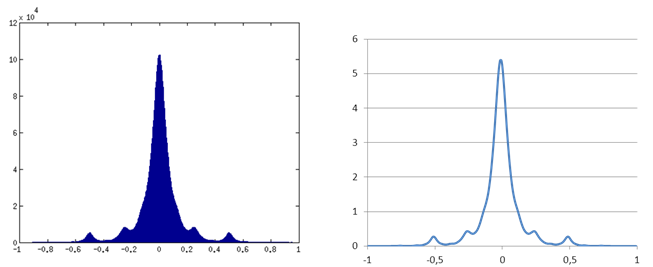
Figure 4. Stationary state with fluctuating moderates. Moderate uncertainty \(u\)=1.8 and proportion of extremists \({p_e} = 0.05\), intensity \(\mu = 0.5\). Left panel: histogram of number of agents for the model with 10 Millions agents. Right panel: convergence density with the density distribution model. - 3.9
- The patterns of convergence distribution are the result of
two opposite tendencies:
- while the opinions can be attracted by both extremes, the extremist influence makes them fluctuate strongly in both directions;
- the interactions between the moderates is averaging and tends to form a central peak of density, keeping the opinions in a zone where they can be attracted by both extremes.
- 3.10
- These opposite tendencies reach an equilibrium leading to a stable density of opinions. However, the opinions keep fluctuating and the stable density is the result of averaging the presence of always changing agents.
- 3.11
- Moreover, the model is ergodic: the positions of a single
agent over a large number of time steps describe the same distribution
as the positions of a large number of agents after convergence, as
shown on Figure 5. This implies
that the initial conditions are much less important: Many very
different initial distributions of the moderates lead to the same
stationary distribution.
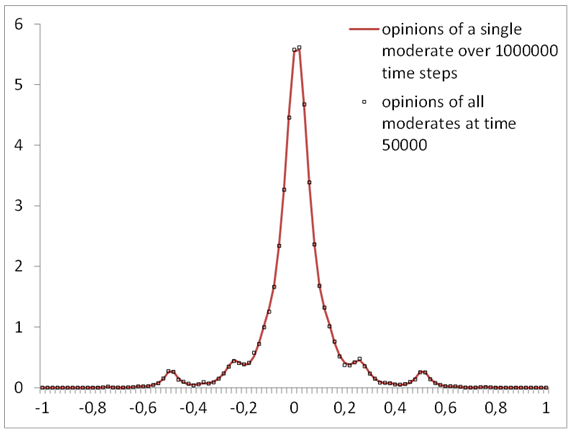
Figure 5. Ergodicity of the model. Comparing the density of opinions of a single agent over 1 Million time steps with the density of opinions of 1 Million agents at time step 50000 for \(u = 1.8\), \({p_e} = 0.05\), \(\mu = 0.5\). - 3.12
- Depending on the values of the parameters we get very
different patterns of distribution at convergence. For this purpose, we
study the density of opinions for different values of \({p_e}\), \(u\)
and \(\mu \). Using the continuous model (see equation 4), these
different densities of opinions are plotted in Figure 6. We note that:
- When the proportion of extremists \({p_e}\) is low, there is a central peak of density because the interactions between moderate agents tend to average their opinions. However, the uncertainty of moderates is large enough for the opinions located close to 0 to be attracted regularly by extremists of both sides. This creates secondary peaks at a distance \(\mu \) of the central peak, and then the interaction of this secondary peak with the extremists creates a smaller peaks at distance \(\mu + (1 - \mu )*\mu \) of the central peak, and so on. For instance on Figure 6 on the first line, for \(\mu = 0.4\), we can observe several peaks of the distribution on the right panel. Peak 1 at \({x_1} = \mu = 0.4\), is the result of interactions \(i(C,E)\) between central peak \(C\) and extremists \(E\). Peak 2, at \({x_2} = {x_1} + (1 - {x_1})*\mu = 0.64\), is the result of interactions \(i(1,E)\) between peak 1 and extremists. Peak 3, at \({x_3} = {x_1} - \mu {x_1} = 0.24\) is the result of \(i(1,C)\), peak 4, at \({x_4} = {x_2} - \mu ({x_2} - {x_1})\) = 0.544, is the result of \(i(2,1)\), peak 4', at \({x_{4'}} = {x_1} + \mu ({x_2} - {x_1})\) = 0.496, is the result of \(i(1,2)\) Peak 5, at \({x_5} = {x_1} - \mu ({x_1} - {x_3}) = 0.336\) is the result of \(i(1,3)\), peak 5', at \({x_{5'}} = {x_3} + \mu ({x_1} - {x_3}) = 0.3046\) is the result of \(i(1,3)\);
- When the proportion of extremists \({p_e}\) is high (for instance 0.8), then the attraction of extremists prevents the central peak to appear, and the distribution tends to be higher in the vicinity of the extremists. When the uncertainty of moderates \(u\) is high, the probability of moderate opinions tends to be higher because the moderates attract each other for larger differences of opinions (see second row of Figure 6);
- Intermediate patterns take place for intermediate values of the parameters (see third line of Figure 6). Note the depression of the distribution at the centre and the complex geometry of local maxima and minima of variable sizes which are due to the local equilibrium between the attraction by extremists towards the extremes and towards the centre by moderates.
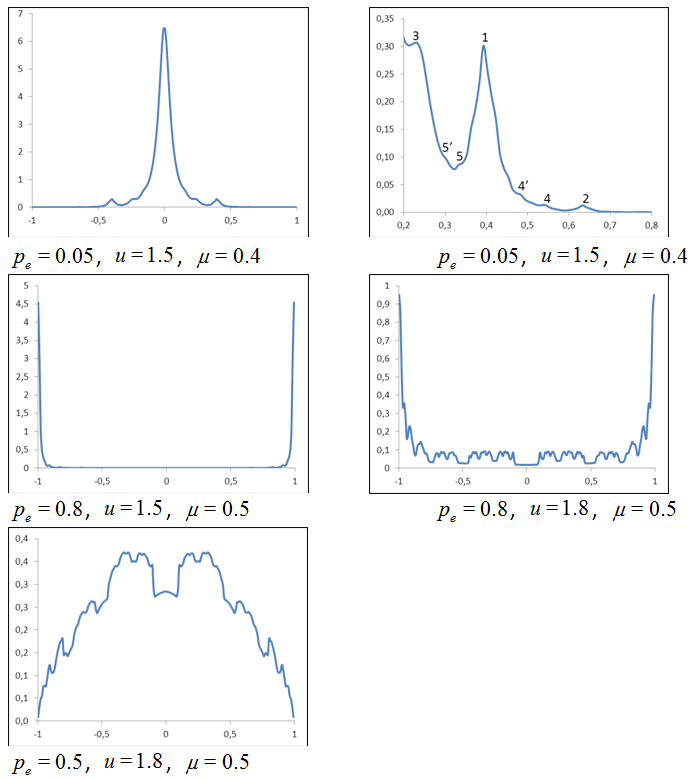
Figure 6. Patterns of moderates opinion density at convergence for high values of \(u\) and different values of \({p_e}\) and \(\mu \). For small \({p_e}\), the distribution tends to be concentrated in the centre, while for large \({p_e}\), it is close to a double extreme clustering. - 3.13
- To summarize, the moderate opinion distribution tends to a central peak when the proportion of extremists \({p_e}\) is low and tends to a double extreme peak when \({p_e}\) is high (higher than 0.5). Moreover, a high uncertainty tends to increase the centrality of the distribution. These results are in line with the ones obtained previously with changing uncertainty models but the fixed uncertainties prevent the single extreme convergence for high uncertainties of the moderates. Moreover, the indefinite strong fluctuations of opinions is a really new feature. With the complex geometry of some densities, for instance for intermediate values of \({p_e}\), this new type of moderate opinions evolution shows a rich variety.
Discussion
and conclusion
- 4.1
- Theoretically, the convergence towards a stationary density distribution of opinions that keep fluctuating had already been identified (Blondel et al. 2013), especially when the interactions are not symmetric. However, in the currently published studies of standard variants of the BC model, only the models introducing directly some noise in the interactions exhibit such distributions (Pineda et al. 2009). In all the other studies, the model converges to a set of clusters in which all opinions are the same and stable. Therefore, the stationary state of the opinion density that we observe in the model with fixed uncertainties is new. Moreover, the variety of the distribution patterns is particularly striking compared with the always similar set of clusters obtained with the changing uncertainties models.
- 4.2
- The qualitative explanation of this difference is rather straightforward. When moderates uncertainties are fixed and large, the moderates are submitted to the influence of both extremes and of the other moderates. They continuously fluctuate under these influences. This leads to ergodic dynamics (see Figure 4) which is a particularly new feature for the BC models. Indeed, the opinions of the agents take all the possible values of the distribution over time. The immediate consequence is that a large variety of initial distributions of the moderates opinions lead to the same stationary distribution (we tried with various non uniform distributions). This feature is interesting because in many papers about BC models and variants, the initial distribution of opinions is supposed uniform whereas when starting with a Gaussian distribution of opinions for instance, the number and location of convergence clusters is different. The new pattern is hence more robust.
- 4.3
- Considering now the possible interpretation of this model in social processes, one can think of situations where hesitating agents are discussing with two very convinced groups with opposite opinions. This can reflect to some extent frequent political situations where two parties of convinced militants try to convince a majority of unconvinced moderates. The model assumes that the moderates easily change their opinion after discussing with an extremist (or a militant) of one side and easily change it again when discussing with an extremist of the other side or with an other uncertain agent. The model predicts a very high volatility of the moderate opinions (they change very frequently their opinion) when the proportion of extremists is high (say around 0.5), which could be related to "swing voters" (see empirical work of Battaglini et al. 2010). Moreover, the more uncertain, the more likely moderates are not to choose one side and remain neutral. According to the model, the global state of the opinion could appear stable from usual polls whereas many individual changes take place, and compensate each other.
- 4.4
- Even if a whole population of very uncertain agents not choosing their own position, defining themselves as a member of a particular group is somewhat too much prototypical, it will be very interesting since it exhibits a different order at a different level. Indeed, if only a part of the population is in this state of a large uncertainty but not motivated to reduce it, this part will continue moving along the social order passing from one group of people with a lower uncertainty to another group. They represent what Granovetter (1973) has outlined as "'weak"' ties ensuring the exchange of information in the population. Moreover, considering real social order, this is strongly known in the classical problem of community detection that some people seem to be very mobile, members of several groups at the same time. Questioning about what these people bring to the social system is then a very hard and interesting question. That is the purpose of further investigation implying a more complex population and some analysis of the stable states.
- 4.5
- Nevertheless, the results should be interpreted with caution as usual with such theoretical models (see Deffuant et al. 2006 for a general discussion on this issue), and especially because of the strong hypothesis that each agent interacts with any other. In particular this paper underlines the controversy about the interest of abstract models and the necessary caution in their interpretation. Further conclusions would require complementary investigations, considering for example various social networks constraining the interactions.
Appendix
A: Computing the clusters, extracted from Deffuant (2006)
- We only consider the
clusters of initially moderate agents (i.e. initialised with
uncertainty U), because our goal is to evaluate the effect on moderates
of different configurations of extremists. To compute the clusters, we
define a minimum distance \(\varepsilon \) between opinions, below
which we consider that they belong to the same cluster. We compute the
clusters as groups of agents such that between any couple of agents of
opinions \(x\) and \(x'\) in the group, there is a list of agents in
the group of opinions \(({x_1},{x_2},...,{x_k})\) making a chain of
couples with a distance below \(\varepsilon \). More precisely:
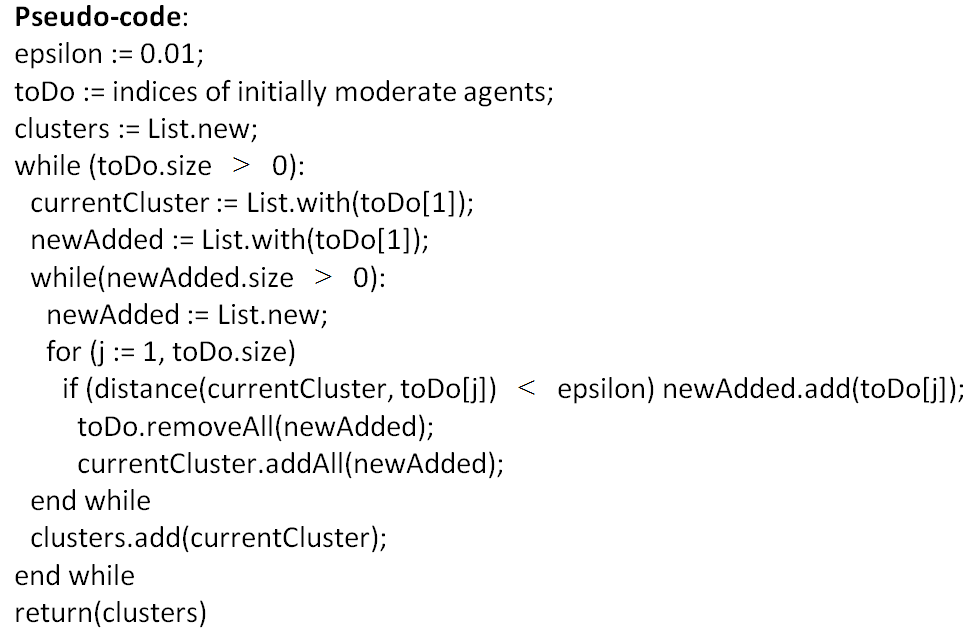
$$\left| {x - {x_1}} \right| < \varepsilon ,\left| {x' - {x_k}} \right| < \varepsilon ,$$ $$1 \leqslant i \leqslant k - 1,\left| {{x_i} - {x_{i + 1}}} \right| < \varepsilon .$$ In practice, we chose \(\varepsilon = 0.01\). The following pseudo-code can be used to compute the clusters. Initially moderate and extremist agents are tagged at the beginning of the simulation. Method addAll() adds all the elements of the argument (supposed to be a list) to the argument (supposed to be a list as well). Method removeAll() removes from the recipient all the elements of the argument (both are supposed to be lists).
Appendix
B: exploration of the stationary states according to the
proportion of extremists \({p_e}\) and the uncertainty \(u\)
- We propose here to give
more details about the stationary states according to the proportion of
extremists \({p_e}\) and the uncertainty \(u\).
B.1 Influence of \({p_e}\)
Figures 7 and 8 show details about the convergence opinion distributions for different values of \({p_e}\). In the case of few extremists (\({p_e}\)=0.05), the pattern obtained clearly depends on parameter \(u\) (see Figure 7). For low values of \(u\), we have approximately 1/\(u\) clusters as in the model without extremists. For \(u\) around 0.5, we obtained double extreme clusters. For 0.5\( < u < \)0.9, there is only one central cluster. A single extreme cluster comes after for 0.9\( < u < \)1.1 before a state where opinion keep fluctuating (\(u > \)1.1). Increasing the value of \({p_e}\) decreases this zone of fluctuations and increases the polarization of the population (see Figure 8a) towards a double extreme highly polarized (see Figure 8b).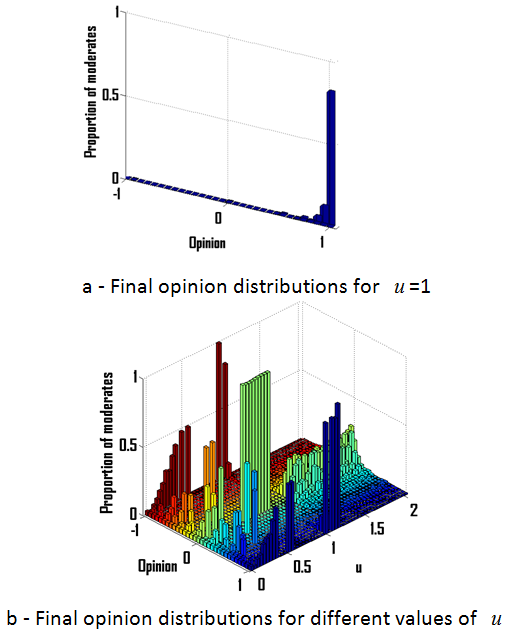
Figure 7. Opinion distributions after convergence for a proportion of extremists \({p_e}\)=0.05 and for \(u\)=1 (convergence towards a single extreme, Figure a) and for various values of uncertainties \(u\) in ordinate (Figure b). 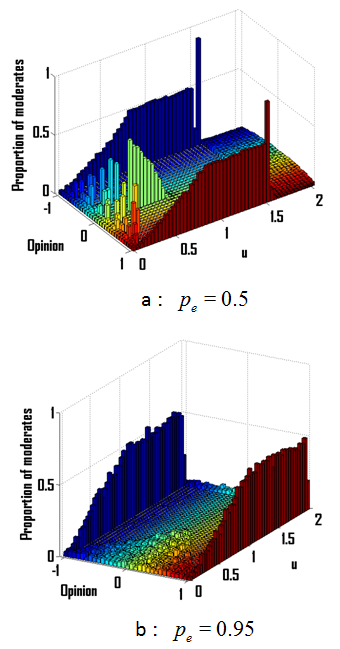
Figure 8. Opinion distributions after convergence, for different values of \({p_e}\), the proportion of extremists with (a) \({p_e}\)=0.5 and (b) \({p_e}\)=0.95 and various uncertainties \(u\) values in ordinate. B.2 Influence of \(u\)
Figure 9 shows details about the convergence opinion distributions for different values of \(u\). For low values of \(u\), the proportion of extremists \({p_e}\) does not affect the opinion densities except for very low or very high values of \({p_e}\) for which opinions keep fluctuating (Figure 9a). For \(u\)=1 (Figure 9b), we can see that we have a threshold of \({p_e}\) (around 0.25) for which we obtain a transition from a single extreme to a double extreme. For high values of \(u\), opinions keep fluctuating except for high values of \({p_e}\) where the population converges toward a double extreme (Figure 9c).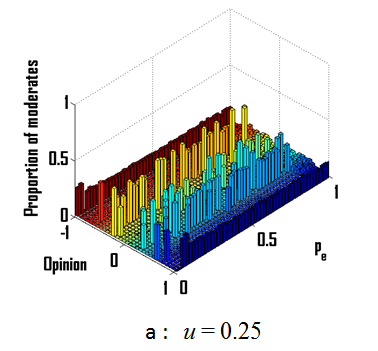
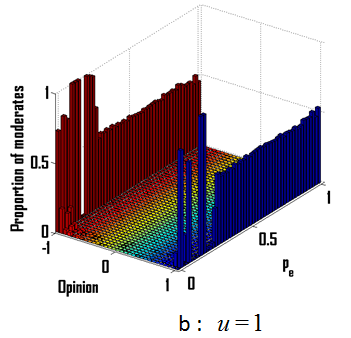
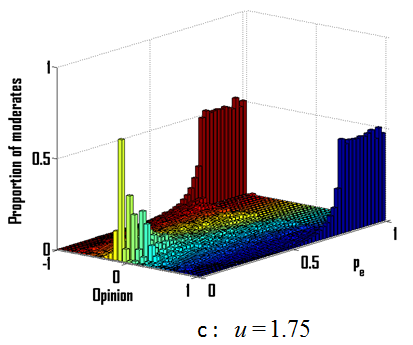
Figure 9. Opinion distributions after convergence for different values of \(u\), the uncertainty of the moderates with (a) \(u\)=0.25; (b) \(u\)=1.0; (c) \(u\)=1.75 and various values of \({p_e}\), the proportion of extremists given in ordinate.
Appendix
C: Source code of the model
-
clear all;close all
pe=0.5;
u=0.4;
mu=0.5;
N=400;
x(1,1:round((1-pe)*N))=rand(1,round((1-pe)*N))*2-1;
ux(1,1:round((1-pe)*N))=ones(1,round((1-pe)*N))*u;
x(1,round(((1-pe)*N+1)):round(((1-pe)*N+(1-(1-pe))/2*N)))=ones(1,round((1-(1-pe))/2*N));
x(1,round(((1-pe)*N+1+(1-(1-pe))/2*N)):N)=ones(1,round((1-(1-pe))/2*N))*(-1);
ux(1,(find(abs(x(1,:))==1)))=u/100;
t=1;
criteria=0;
while criteria==0
t=t+1;
vect=randperm(N);
distx=abs(x(t-1,vect(1:N/2))-x(t-1,vect((N/2+1):N)));
r1=find(distx-ux(1,vect(1:N/2))\( < \)0);
r2=find(distx-ux(1,vect((N/2+1):N))\( < \)0);
dx(1,1:N)=0;
dx(1,vect(r1))=(x(t-1,vect(r1+N/2))-x(t-1,vect(r1)))*mu; dx(1,vect(r2+(N/2)))=(x(t-1,vect(r2))-x(t-1,vect(r2+(N/2))))*mu;
x(t,:)=x(t-1,:)+dx(1,:);
if (sum(abs(dx(1,:))))\( < \)0.001
criteria=1;
end
plot(x(:,ux(1,:)\( > \)0.1),'.b')
hold on;
plot(x(:,ux(1,:)\( < \)0.1),'.r')
f(t-1) = getframe;
end
References
- ALIZADEH, M., &
Cioffi-Revilla, C. (2015). Activation regimes in opinion dynamics:
Comparing asynchronous updating schemes. Journal of
Artificial Societies and Social Simulation 18(3), 8: https://www.jasss.org/18/3/8.html.
AXELROD, R. (1997). The dissemination of culture - a model with local convergence and global polarization. Journal of conflict resolution 41(2), 203–226
BATTAGLINI, M., Morton, R.B., & Palfrey, T.R. (2010). The swing voter's curse in the laboratory. The Review of Economic Studies 77(1), pp. 61–89
BLONDEL, V.D., Hendrickx, J.M., & Tsitsiklis, J.N. (2013). Continuous-time average-preserving opinion dynamics with opinion-dependent communications. SIAM Journal on Control and Optimization 48(8), 5214–5240
CANUTO, C., Fagnani, F., & Tilli, P. (2012). An eulerian approach to the analysis of Krause's consensus models. SIAM Journal on Control and Optimization 50(1), 243–265
CASTELLANO, C., Fortunato, S., & Loreto, V. (2009). Statistical physics of social dynamics. Reviews of Modern Physics 81(2), 591–646
DEFFUANT, G. (2006). Comparing extremism propagation patterns in continuous opinion models. Journal of Artificial Societies and Social Simulation 9(3), 8: https://www.jasss.org/9/3/8.html
DEFFUANT, G., Amblard, F., Weisbuch, G., & Faure, T. (2002). How can extremism prevail? a study based on the relative agreement interaction model. Journal of Artificial Societies and Social Simulation 5(4), 1: https://www.jasss.org/5/4/1.html
DEFFUANT, G., Moss, S., & Jager, W. (2006). Dialogues for a (possibly) new science. Journal of Artificial Societies & Social Simulation 9(1), 1: https://www.jasss.org/9/1/1.html
DEFFUANT, G., Neau, D., Amblard, F., & Weisbuch, G. (2001). Mixing beliefs among interacting agents. Advances in Complex Systems 3, 87–98
DEFFUANT, G., & Weisbuch, G. (2008). Probability distribution dynamics explaining agent model convergence to extremism, chap. Social Simulation, technologies, advances and new discoveries, pp. 43–60. Information Science Reference, Hershey
DEFFUANT, G., Weisbuch, G., Amblard, F., & Faure, T. (2013). The results of Meadows and Cliff are wrong because they compute indicator y before model convergence. Journal of Artificial Societies & Social Simulation 16(1), 11: https://www.jasss.org/16/1/11.html
DERRIDA, B., & Flyvbjerg, H. (1986). Multivalley structure in kauffman's model: analogy with spin glasses. Journal of Physica A 19, 1003–1008
FESTINGER, L. (1954). A theory of social comparison processes. Human relations 7(2), 117–140
FLACHE, A., & Mäs, M. (2008). How to get the timing right. a computational model of the effects of the timing of contacts on team cohesion in demographically diverse teams. Computational & Mathematical Organization Theory 14(1), 23–51
GALAM, S. (2002). Minority opinion spreading in random geometry. Eur. Phys. J. B 25(4), 403–406, http://dx.doi.org/10.1140/epjb/e20020045
GALAM, S., & Moscovici, S. (1991). Towards a theory of collective phenomena: Consensus and attitude changes in groups. European Journal of Social Psychology 21(1), 49–74
GRANOVETTER, M.S. (1973). The strength of weak ties. American Journal of Sociology, 78(6), pp. 1360–1380
HEGSELMANN, R. (2014). Bounded confidence, radical groups, and charismatic leaders. In: Advances in Computational Social Science and Social Simulation. Proceedings of the Social Simulation Conference. pp. 217–219. Autonoma University of Barcelona, Barcelona, Catalunya (Spain)
HEGSELMANN, R., & Krause, U. (2002). Opinion dynamics and bounded confidence models, analysis, and simulation. Journal of Artificial Societies and Social Simulation 5(3), 2: https://www.jasss.org/5/3/2.html
HEGSELMANN, R., & Krause, U. (2015). Opinion dynamics under the influence of radical groups, charismatic leaders, and other constant signals: A simple unifying model. Networks and Heterogeneous Media 10(3), 477–509
HUET, S., Deffuant, G., & Jager, W. (2008). Rejection mechanism in 2d bounded confidence provides more conformity. Advances in Complex Systems 11(4), 1–21
HUET, S., & Deffuant, G. (2010). Openness leads to opinion stability and narrowness to volatility. Advances in Complex Systems 13(3), 405–423
JAGER, W., & Amblard, F. (2004). Uniformity, bipolarization and pluriformity captured as generic stylized behavior with an agent-based simulation model of attitude change. Computational & Mathematical Organization Theory 10, 295–303
KRAUSE, U. (2000). A discrete nonlinear and non-autonomous model of consensus formation. Communications in difference equations pp. 227–236
MÄS, M., & Flache, A. (2013). Differentiation without distancing. explaining bi-polarization of opinions without negative influence. PLoS One 8(11), e74516
MÄS, M., Flache, A., & Helbing, D. (2010). Individualization as driving force of clustering phenomena in humans. PLoS Comput Biol 6(10), e1000959
MEADOWS, M., & Cliff, D. (2012). Reexamining the relative agreement model of opinion dynamics. Journal of Artificial Societies & Social Simulation 15(4), 4: https://www.jasss.org/15/4/4.html
MOSCOVICI, S., Lage, E., Naffrechoux, M., et al. (1969). Influence of a consistent minority on the responses of a majority in a color perception task. Sociometry 32(4), 365–380
MOUSSAÏD, M. (2013). Opinion formation and the collective dynamics of risk perception. PLoS One 8(12), e84592
PINEDA, M., Toral, R., & Hernández-Garca, E. (2009). Noisy continuous-opinion dynamics. Journal of Statistical Mechanics: Theory and Experiment 2009(08), P08001
PINEDA, M., Toral, R., & Hernández-Garca, E. (2011). Diffusing opinions in bounded confidence processes. European Physics Journal D 62, 109–117
SHERIF, M., & Hovland, C.I. (1961). Social judgment: Assimilation and contrast effects in communication and attitude change. Praeger Pub.
SZNADJ-WERON, K. (2005). Sznajd model and its applications. Acta Physica Polonica B 36(8)
TABATABAEI, M., Jia, P., & Bullo, F. (2014). Eulerian opinion dynamics with bounded confidence and exogenous inputs. SIAM Journal on Applied Dynamical Systems 13, 425–446
TAKÁCS, K., A.F., & Mäs, M. (2014). Is there negative social influence? disentangling effects of dissimilarity and disliking on opinion shifts. Available at SSRN: http://ssrn.com/abstract=2445649
WEISBUCH, G., Deffuant, G., Amblard, F., & Nadal, J.P. (2002). Meet, discuss, and segregate! Complexity 7(3), 55–63