
Introduction
With the intensification of social transformation and the development of communication networks, collective behaviour in networks has become a noteworthy issue. Social networking enables close interactions among individuals, which further influences the development of social events. Networks can be used as channels for social investigation, development of group opinions, and information transmission as well as an important platform on which public opinions emerge and social events develop. At the same time, data analysis of social network information is an emerging method for social political observation and decision as well. Certain research studies have been conducted on elections (Mejova et al. 2014), offering a new method for traditional sociology research. Social networks such as Twitter have become important media communication platforms and a new channel for political participation in many countries (Bekafigo et al. 2013; Hosch-Dayican et al. 2016; Quintelier et al. 2008). Social networks influence and shape the political views of citizens (Zhang et al., 2010) and even affect the process of political events (Dyagilev et al. 2014).
In the social science field, a typical phenomenon exists in which the scale of a social event increases with synchronization of opinion and polarization of the masses, the so-called "rising up" phenomenon. Specifically, a "well known" social event is more likely to attract governmental and societal attention. Social conflict is an important method for expressing the aspirations of the people, and it is an important “bottom to top” agenda-setting mechanism. The social system adjusts via government agenda setting, which is helpful in alleviating social contradictions. This phenomenon reflects the social function of collective behaviour in social development. Therefore, it is crucial to clearly explain the process and mechanism of the "rising up" phenomenon. To meet this objective, opinion evolution and polarization should be taken into consideration because they are critical determinants in collective behaviour.
Based on the traditional J-A model (Jager et al. 2005; Chau et al. 2013), this paper builds a multidimensional opinion model using multi-agent technology and examines the evolution and the polarization processes of opinion with a series of simulation experiments. In Section 2, we review the related research, and the multidimensional opinion polarization model is proposed in Section 3. The social computing approach used in this paper is introduced in Section 4, and the polarization phenomena in a completely connected network and BA network (Barabasi et al. 1999; Goh et al. 2001) is examined in Section 5. We perform experiments to investigate the evolution and polarization processes in Section 6and draw selected conclusions in Section 7.
Related Research
The research on online mass incidents can be roughly divided into two categories. One category uses classic social research methods, such as questionnaire surveys or experiments, field research, case studies, etc. (Han 2012). The other category is based on model research, which establishes mathematical or computational models combined with social psychology and other related subjects in which mathematical calculation and computer simulation are the main research methods (Jager et al. 2005; Chau et al. 2013; Wang 2005).
Scholars have conducted theoretical and empirical research on online mass incidents and their political and social impacts from different perspectives, using methods such as social conflict theory, psychological theory, and social risk theory. Online mass incidents are considered a form of democracy (David 1997) that has changed the traditional political participation of citizens to a certain extent. The essence of this change is the political participation of Internet users (Rash 1997; Davis and Owen 1998). The development of information technology has introduced a new feature into this type of political participation. In this behaviour, a large number of citizens and groups search for, collect, analyse and publish messages in the context of the information age with the aims of offering accurate, independent and wide information dissemination for a democratic society. Online mass incidents are often used by the people as a method of rights preservation. To preserve their rights, individuals generally use various communication technologies such as e-mail, the World Wide Web and blogs to achieve more rapid and more extensive information exchange. Any user can launch a form of self-published media on the Internet (Earl et al. 2010) and might trigger collective behaviour. This effort is beneficial for social justice and government agenda setting. The network conflicts that are often associated with online mass incidents are the appearance of social conflicts on the Internet. From the perspective of political sociology, these events are a contest with the aim of influencing public opinion and achieving a certain level of interest on an Internet platform, which is a powerful democratic resource (Mills 2002). Network conflicts can promote the formation of network communities and social progress, but excessive network conflicts can lead to the risk of dictatorship or network anarchism (Netanel 2000).
On the Internet, the incidents that result in opinion polarization often involve the interests and daily life of the public. Generally, individuals have a priori opinions of these events. In interactions over the network, if individuals encounter supporters, their opinions are strengthened, whereas if they encounter those with contrary opinions, this conflict between opinions result in their opinions becoming more extreme. The study shows that compared with debate in the real world, online interaction is more likely to cause opinion polarization (Smelser 2011; Yardi et al. 2010; Li et al. 2013). Extreme opinions and emotions are important features of the network forum (Sobkowicz 2012). Alizadeh et al. 2014 studied the effect of perceived intergroup conflict escalation on the average number of emergent extremists and opinion clusters in the population and found that the greater the tensions that exist between groups, the greater the number of individuals who become extremists. These researchers also found that intergroup conflict escalation leads to lower opinion diversity in the population compared with normal situations (Alizadeh et al. 2014 ). In the empirical field, researchers primarily gather information from the news media, the Internet, interviews and other sources. These methods fail to obtain and understand all of the information in online mass incidents, and as a result, the studies mostly focus on analysis of the phenomena. It is difficult to completely explain the evolutionary dynamics of the participants’ opinions, which is important to the formation mechanism of online mass incidents. Model-based literature seeks to fill this gap, with efforts such as the threshold model (Lopez-Pintado et al. 2008), D-W model (Deffuant et al. 2000; Weisbuch et al. 2002), and J-A model (Jager et al. 2005; Chau et al. 2013), among others.
The threshold model is one type of model applied to describe the behaviour of the group. The "domino effect" can be used to describe the basic principle of group events. The intuitive interpretation is that individuals make a decision related to taking part in collective action by observing whether the number of individuals who have been added to the collective action reaches a threshold or not. Lopez-Pintado et al. 2008 built a heuristic threshold model for group events based on the threshold model (Lopez-Pintado et al. 2008). Schelling used the threshold model to explain the phenomenon of racial segregation in the United States and proposed the theory of a tipping point (Schelling 1971). Granovetter introduced the normal activation threshold distribution model (Granovetter 1978) to describe general social collective behaviours. The threshold model is relatively simple and easy to handle, and it can be easily calculated after the relevant rules have been determined, but the lack of a relevant supporting theory from psychology or economics is a problem. To address this issue, Tang & Li introduced the utility and psychological threshold theory to construct an improved threshold model (Li et al. 2014) based on Granovetter's threshold model. The deficiency of this approach is that it used the spatial lattice neighbourhood structure in which each agent is assumed to observe only eight surrounding neighbours. This situation is obviously different from individual connection structures in social networks. Additionally, because formation and evolution of opinion is an important issue in social psychology, certain other models are based on social psychological theories. Related research includes the heuristic systematic model, cognitive difference theory, and social judgement theory, among others (Eagly et al. 1993; Sherif et al. 1961; Sherif et al. 1982). Currently, the main representative models of group opinion evolution are the D-W model (Deffuant et al. 2000; Weisbuch et al. 2002), and J-A model (Jager et al. 2005; Chau et al. 2013), ). The D-W model considers that the opinion values of individuals are closer when their opinions are similar and discusses the influence of the opinion threshold on the evolution of the collective opinion. The model suggests that a high threshold tends to render the opinion more uniform and a lower threshold tends to produce a number of small groups of opinion. From the viewpoint of polarization of network interactions, the social judgement theory (SJT) is a good group psychological model. Jager and Amblard designed the J-A model based on the SJT and discussed the opinion evolution of the group (Jager et al. 2005).
The above mentioned models are often assumed to represent a one-dimensional case in which a scalar is used to characterize the opinion of the agent. In real social events, the opinion of an individual is often multidimensional. The social judgment theory (SJT) (Eagly et al. 1993; Griffin et al. 2010; Sherif et al. 1961; Sherif et al. 1982) is a social psychological law of the individual in social collective behaviour that is suitable for describing multidimensional opinion evolution. The existing studies on multidimensional opinion dynamics are not based on the social judgment theory (SJT) and do not focus on polarization (Laguna et al. 2003; Fortunato et al. 2005; Etesami et al. 2013). In this paper, we address the "rising up" phenomenon as the background, considering it as the polarization and synchronization process of opinion in social networks from the perspective of complex science. Combined with the social judgment theory (SJT) (Eagly et al. 1993; Griffin et al. 2010; Sherif et al. 1961; Sherif et al. 1982), we simultaneously establish a model of multidimensional opinion evolution and introduce the BA network as a social network model. Because of the complex nonlinear interactions among individuals, it is highly difficult to solve the problem using the traditional mathematical methods, such as the mean-field analysis. Therefore, we use the multi-agent method to analyse this model. In recent years, the multi-agent framework has become an important approach in study of social phenomena in society (Huet et al. 2008; Crawford et al. 2013). The agent-based model is a type of bridge across the micro-level, meso-level and macro-level considerations (Squazzoni et al. 2014), which is helpful in quantitatively and accurately clarifying the mechanism of social phenomena. This research paradigm is widely used in social science research areas such as politics and economics, among others. For example, Gulati et al. 2011 built a multi-agent model of political voting (VODYS) that can effectively and carefully assess the impact of voter social behaviour, the social environment, and the election campaign (Gulati et al. 2011). Frantz et al. used the multi-agent method to study information exchange in early trading in 12th century history and established a trust-based cooperation model (Frantz, 2013). In this work, we use the multi-agent Monte Carlo method (Joseph et al. 2013; Gulati et al. 2011; Moretti 2002) for calculation and simulation. We attempt to understand the occurrence of group events from the perspective of network polarization and emergent behaviour and offer insightful suggestions for mass incident prevention and social public management.
Proposed Model of Multidimensional Opinion Polarization
Classic D-W and J-A Models
Deffuant used a continuous value to characterize an individual opinion and introduced a multi-agent model known as the D-W model (Deffuant et al. 2000; Weisbuch et al. 2002). In this model, the participants display only two actions, i.e., receiving or maintaining, and only consider the assimilation effect in social judgement theory. The advantage of this model is that it can be efficiently simulated using a computer and its dynamics can be qualitatively understood. This model agrees with the viewpoint in social psychology that the opinion of an individual can be measured using a continuous value. However, because this model only considers the assimilation effect and does not consider the contrast effect in social judgement theory, the D-W model cannot accurately describe the process of opinion polarization in the real world. Furthermore, Jager et al. proposed the J-A model (Jager et al. 2005; Chau et al. 2013) to consider both the assimilation and contrast effects in social judgement theory in completely connected networks. The model definition is presented as follows.
Assimilation effect rule. If the distance between the opinions of agent a and b is less than \(d_1\)
| $$|x_a-x_b|<d_1 $$ | (1) |
| $$\begin{equation} \label{eq:10} \begin{split} x'_a & =x_a+\mu(x_b-x_a)\\ x'_b & =x_b+\mu(x_a-x_b) \end{split} \end{equation} $$ | (2) |
Contrast effect rule. If the distance between the opinions of agent \(a\) and \(b\) is larger than \(d_2\)
| $$|x_a-x_b|>d_2 $$ | (3) |
| $$\begin{equation} \begin{split} x'_a=\xi(x_a-\mu (x_b-x_a)) \\ x'_b=\xi(x_b-\mu (x_a-x_b)) \end{split} \end{equation} $$ | (4) |
| $$\begin{equation} \xi (x)= \begin{cases} x, & \text{if $0\leq x\leq 1$} \\ 0, & \text{if $x<0$} \\ 1, & \text{if $x>1$} \end{cases} \end{equation} $$ | (5) |
Proposed Model
In the existing D-W model (Deffuant et al. 2000; Weisbuch et al. 2002) and J-A model (Jager et al. 2005; Chau et al. 2013), the opinion of the individual is described using a one-dimensional variable, which can be divided into two types: discrete and continuous. The discrete opinion is represented by two discrete values, such as 0 and 1, where 0 denotes opposition and 1 indicates support. The continuous opinion is represented by a scalar value, such as \(x_i\in [0,1]\), and the value changes according to the reaction between agents by following certain rules in the iterative process. This value indicates the individual opinion on a social event, which is often used in social investigation. In real social events, the individual opinion is not limited to one single dimension, and in fact, it often has several dimensions. The opinion of the individual is multidimensional. For example, on July 21, 2012, the death of 37 people in a rainstorm in Beijing caused a social event. The individual's opinion can be composed of dimensions that include the government's emergency response capacity, an evaluation of urban infrastructure, and the degree of satisfaction with the weather forecast service. This type of multidimensional opinion measurement is involved in many social surveys. According to this situation, a multidimensional opinion model is constructed that is more compliant with social psychological characteristics, and the model is constructed for better analysis of opinion polarization.
Compared with the existing D-W model (Yardi et al. 2010; Sobkowicz et al. 2012) and J-A model (Jager and Amblard 2005), the individual's opinion space is extended from one dimension to multiple dimensions, and the existing social network model is extended to the BA model, which is more representative of the real social network structure. The network size is defined by the variable “total”, i.e., there are a sum “total” of nodes in the network, and the initial opinion of the individual is (\(x_1\), \(x_2\), \(x_3\), \(\dots\), \(x_n\)), where \(x_i\in [0,1]\), initialized as the uniform distribution values in the interval. Each individual's opinion status could be considered as a point in the n-dimensional space of opinion, and attitudinal differences between individuals can represented by the distance between two points in the n-dimensional space of opinion. In each step of the iteration, the two adjacent nodes (i.e., connected nodes) are randomly selected in the network, i.e., node x and node y, and the opinion values of the two nodes are (\(x_1\), \(x_2\), \(x_3\), \(\dots\), \(x_n\)) and (\(y_1\), \(y_2\), \(y_3\), \(\dots\), \(y_n\)), respectively. The opinions are updated in accordance with the following rules:
The distance between agent \(x\) and agent \(y\) is defined as
| $$ \begin{equation} \sqrt{\sum^n_{i=1}(x_i-y_i)^2} \end{equation} $$ | (6) |
The assimilation effect rule.
If the distance between the opinions of agent \(x\) and \(y\) is less then \(d_1\)
| $$\sqrt{\sum^n_{i=1}(x_i-y_i)^2}<d_1 $$ | (7) |
| $$\begin{equation} \begin{split} x'_i=x_i+\mu (y_i-x_i) \\ y'_i=y_i+\mu (x_i-y_i) \end{split} \end{equation} $$ | (8) |
Contrast effect rule.
If distance between the opinions of agent \(x\) and \(y\) is larger than \(d_2\)
| $$\sqrt{\sum^n_{i=1}(x_i-y_i)^2}>d_2 $$ | (9) |
| $$\begin{split} x'_i=\xi (x_i-\lambda (y_i-x_i)) \\ y'_i=\xi (y_i-\lambda (x_i-y_i)) \end{split}$$ | (10) |
| $$\begin{equation} \xi (x)= \begin{cases} x, & \text{if $0\leq x\leq 1$}\\ 0, & \text{if $x<0$}\\ 1, & \text{if $x>1$} \end{cases} \end{equation} $$ | (11) |
Neutral rule.
The opinion values of agent \(x\) and agent \(y\) do not change otherwise.
When the dimension is 1, the distance between agent \(x\) and agent \(y\), as defined in Equation (6), changes to
| $$|x_1-y_1| $$ | (12) |
In our multidimensional opinion polarization model, \(d_1\) and \(d_2\) correspond to the assimilation effect and exclusion effect in social judgment theory (Eagly et al. 1993; Griffin et al. 2010; Sherif et al. 1961; Sherif et al. 1982), and \(d_2\)≥\(d_1\). The assimilation rule states that the opinions become closer when the difference of the individuals’ opinion values is less than \(d_1\), i.e., they fall in the same assimilation effect zone, and their opinions tend to move towards each other in the interaction. The repulsion rules state that when the difference of the individuals’ opinion values is greater than \(d_2\), the difference between opinions in the interaction tends to enlarge. The neutrality rule posits that if the difference between two individuals’ opinions falls between \(d_1\) and \(d_2\), they do not influence each other in the interaction, and the opinion values maintain the original values.
In this paper, we use the BA network as the social network model. The BA model gives rise to networks whose degree distributions exhibit high variance, i.e., certain nodes have significantly more contacts than others, which better captures empirical observations of social networks than classical models such as the Erdos-Renyi graph (Erdős et al. 1959) or regular grids in which the degrees of agents are highly homogenous. Therefore, the BA model is a more realistic model of social networks. Because the generation algorithm of the classical BA network can only generate a network that has a fixed degree distribution (power ratio index of 3), we use an extended algorithm given by Goh, etc. (Goh et al. 2001), which is a scale-free network model with adjustable scale. By adjusting the order parameter, we can obtain BA networks that have different degree distributions to simulate various social networks.
According to the different definitions of opinion distance, this model can be used in the situations with two or more dimensions. Compared with the existing models in which the polarization of opinions is limited in one dimension, our model expands the dimensions of individual opinion. For example, the classic J-A model only considers the one-dimensional opinion, but our model considers opinions with multidimensional cases. The proposed model adopts both a convergence parameter and a divergence parameter, which makes it more flexible in describing these two types of effects. The completely connected network is used in the classic J-A network, whereas our model uses the improved BA scale-free network as a model of the social network, which is more suitable for the real social network, and the parameters of the BA network can be adjusted to find the relationship between the network structure and the polarization. In the real case, the social group tends to have multidimensional opinions, and thus the proposed model is more suitable for real situations, which is conducive to the study of opinion polarization of groups in Internet events in the real world.
Social Computing Approach to Opinion Dynamics
The research methods of population evolutionary dynamics can be divided into two categories: bottom to top and top to bottom. In top-to-bottom methods, the dynamic differential equations are solved, and the evolution characteristics of the system are obtained. Simulation is used to study the dynamic characteristics of the system in bottom-to-top methods. Because agent-based simulation has matured and become an accepted methodology in social research (Rand et al. 2015; Kravari and Bassiliades 2015, Fernández-Márquez and Vázquez 2014), we apply the model in Section 2 using multi-agent simulation and simulate the evolution process of multidimensional group opinion. This method creates a bridge between the individual interaction mechanism and the macro-dynamics of the collective behaviour. Furthermore, this approach offers a new tool for study of self-organization and dynamic evolution in a complex social system and also contributes to the development of a modern social science research method system that can facilitate more comprehensive and profound understanding and analysis of complex social problems.
In this paper, the experimental research method follows the framework of an artificial society (Wang 2005) in which the construction of the artificial society is the key point. The artificial system uses computational techniques to construct an artificial system with structure, characteristic, function and dynamic mechanism similar to those of the human social system. This system consists of an open environment, a group of individuals (i.e., agents) with the characteristics of independent behaviour and limited resources, and a series of rules is set for interaction among the agents in the system. By extracting the basic operating mechanism of human society, this system applies computer technology to build an artificial system that has the characteristics and functions of human society and can be used to study the evolution, adaptation and interaction in human society.
According to the model in Section 3 , we construct an artificial social system in the Matlab platform in which every agent represents a human individual participating in information interaction in social networks. Each agent has an n-dimensional (\(n=1,2,3,\dots\)) opinion parameter, which means that every individual’s multidimensional opinion is represented by an n-dimensional vector. The interactions between agents follow the rules defined in the model of Section 3, and the connections between agents are defined in the network adjacency matrix generated by the specific algorithm (e.g., BA algorithm).
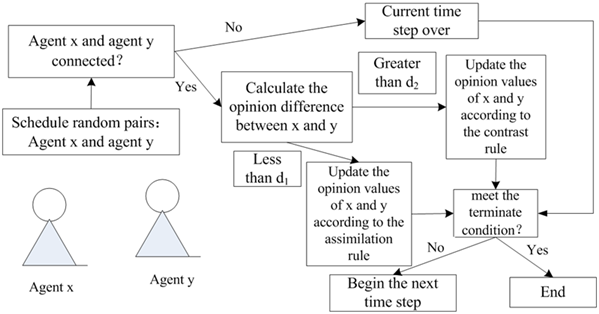
We use the method of random sampling in the interactions. At every time step, we randomly select two agents from all agents and determine whether they are connected according to the network adjacency matrix. The agents interact according to the rules given in the model when they are connected. If the agents are not connected, we shift to the next evolutionary time step. When the difference between the values of opinion is less than \(d_1\), these two individuals are located in the same assimilation effect zone, and after their opinion vector is calculated and updated according to formula (8), their opinions located closer together in terms of a distance measure in the model. However, if the difference between the opinion values is greater than the divergence parameter \(d_2\), these two individuals are located in the repulsion effect zone, and when their opinion vectors are calculated and updated according to formula (10), the difference between their opinions increases. Otherwise, the opinions remain unchanged. The process is repeated, and the evolution of opinions can be observed. This process is shown in Figure 1.
Opinion Polarization with Random Contacts Between Agents
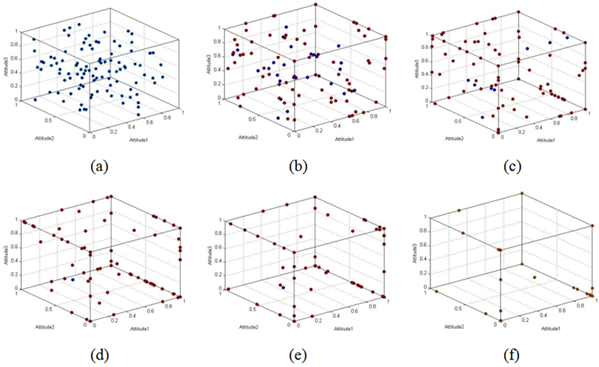
Considering that a 3-dimensional opinion space can be conveniently expressed using a graph, the evolution process of 3-dimensional opinion is studied via simulation experiments in this section. The simulation is conducted on the completely connected network according to the above model. The parameters are \(\mu=0.20\) and \(\lambda=0.05\). The values of the parameters are chosen based on the fact that the individual requires several interactions to reach the extreme state or a unified opinion. The choice of parameters ensures that the updating speed of the opinion is relatively slow. The parameters \(d_1=0.35\), \(d_2=1.5\), and every dimension of the opinion are initialized independently with uniform distribution. In this condition, it is easy to observe the phenomenon of polarization. The total population is set to 100, and the simulation results are shown as follows.
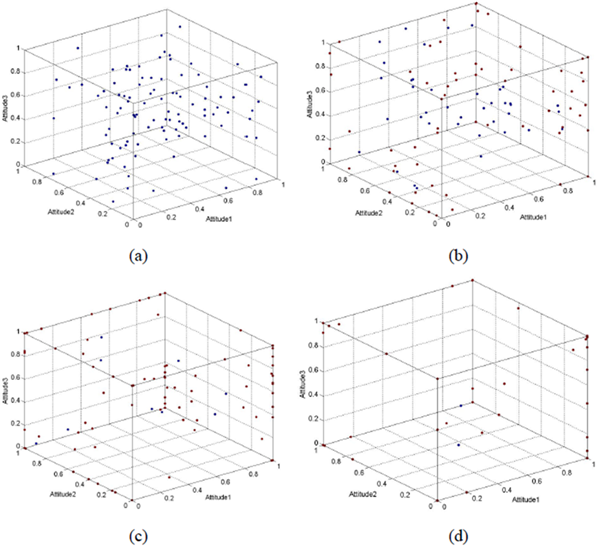
The initial distribution of the individuals’ opinions is shown in Figure 2 (a). The \(x\)-coordinates, \(y\)-coordinates, and vertical coordinates of \(z\) denote three dimensions of the opinion, and the opinion of each individual is expressed by one point in the 3D space. When one or more dimension of the agent’s opinion becomes 0 or 1, we say that this agent is polarized. The polarized agents are indicated by red points in the figures, which distribute on the surfaces or corners of the space. Certain agents’ opinions might move to the same position, and thus we observe only one red point when this occurs. We observe that the individual opinion is dispersed, and the proportion of every opinion is not high at time=0, which means no mainstream opinion has yet emerged. The opinion distributions are shown in Figure 2 (b), (c) and (d), for time=500, time=1000, and time=2000, respectively. The red points denote the polarized opinions, and other opinions are indicated by the blue points. We note that certain points reach the edges of the space, which means that when the opinion of the dimension reaches a maximum (1) or minimum value (0), these agents are polarized and marked with red points. We observe that the opinions of the individuals gradually move to the sides and corners in the iterative process, and they move from the body to the edges and from the edges to the corners. In the end, most of the points are distributed in the corner, which indicates an obvious polarization phenomenon for the opinions of the individuals.
It is worth noting that the polarization can be divided into two types. One type is point polarization, i.e., the opinions of the individuals are located in the corners of the space. In this type of polarization, every dimension of the individual opinion reaches the extreme state. In a 3-dimensional opinion case, this type of polarization has eight polarization states, i.e., the eight corners of the opinion space corresponding to the opinion states of (0,0,0), (0,0,1), (0,1,1), (1,0,0), (1,0,1), (1,1,0), and (1,1,1), respectively. Another type of polarization is known as surface polarization. The individual opinion distributes on one surface of the cube, representing that the opinion becomes polarized in one certain dimension.
In social events, governmental administrative departments or the public might be concerned with one certain dimension of the opinion, and thus the polarization in one certain dimension of the opinion is also worthy of study. In this simulation, the evolution of one certain dimension of the opinion is shown below.
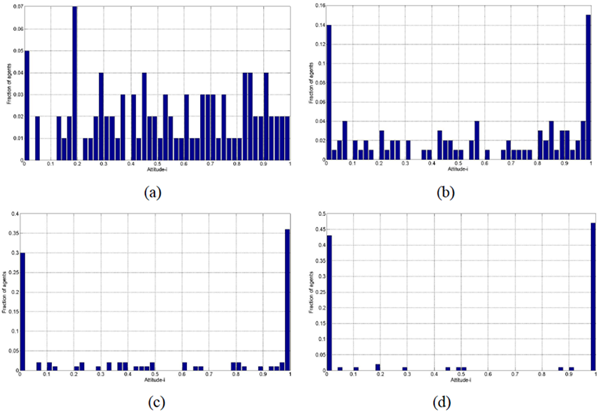
Obviously, as time progresses, one certain dimension of the three-dimensional opinion is gradually polarized into two extreme states, which shows the polarization trend and matches the result in the related one-dimensional opinion polarization research (Chau et al. 2013). This result demonstrates that the three-dimensional polarization process of the model contains the traditional one-dimensional state polarization process. When we observe the multidimensional model from the perspective of one certain dimension, we can obtain selected results that match the conclusions of the existing one-dimensional models, but this observation is not applicable in reverse. To a certain extent, the rationality and correctness of this model are verified by the existing research results.
Furthermore, similar results can be obtained on the BA network (Barabasi and Albert 1999)-based model, which is shown in Figure 4 and Figure 5.
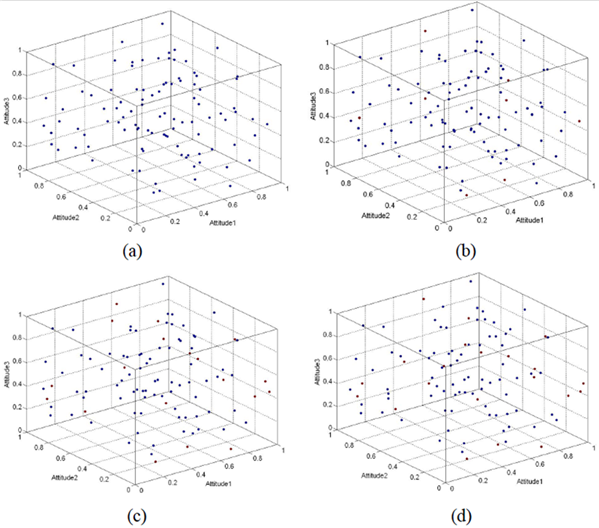
We observe that the group opinions move from the middle of the space to the surfaces, edges and vertices of the cube. This observation means that the group opinion becomes polarized with time. Fig. 4(d) and Fig. 5(d) show that the group opinions become polarized in three dimensions and in one certain dimension when time=3000.
Simulation Experiments
Sensitivity of the polarization to the network structure.
Comparing the BA network with the completely connected network, the connections are denser in the completely connected network. This effect might induce additional interaction among individuals and could be beneficial for generation of polarization phenomenon. Thus, in the BA network, the degree of polarization might be lower than that in the completely connected network at the same time. To compare the polarization with these two types of network models in experiments, we set the parameters \( \mu=0.20\), \( \lambda=0.05\), number of agents=100, iterations=3000, \(d_1=0.35\), and \(d_2=1.5\), and every dimension of the opinion is independently initialized with uniform distribution. The results for the polarization ratios in all dimensions is shown in Figure 6, and the polarization ratio in one certain dimension is shown in Figure 7 in which both results are 100 times the average.
In Figure 6 and Figure 7, the solid line represents the evolution process in a completely connected network, and the dashed line represents the evolution process in a BA network. It can be observed that the one-dimensional and two-dimensional opinion polarizations exhibit similar characteristics. The results clearly support the previous judgement that the polarization degree in the BA network is lower than that in the completely connected network. Considering the difference between these two networks, a possible reason for this result might be that the denser connections mean more frequent interactions among individuals. We can safely conclude that the network structure has a great impact on the generation of polarization. Considering the difference between the completely connected network and the BA network, connection density might possibly be the reason. The connection density can be described by the average degree.
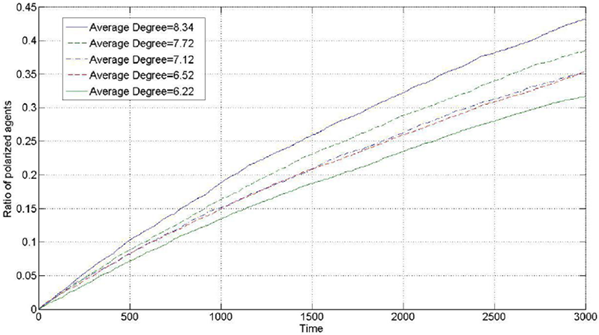
We generate a BA network with different degree distribution using the algorithm given by Goh (Goh et al. 2001). This type of BA network can be used to model a social network structure with different average degree, and the average degree of different BA networks can be calculated. We set the parameters \(\mu=0.20\),\(\lambda=0.05\), number of agents =100, iterations=3000, \(d_1=0.35\), and \(d_2=1.5\), and every dimension of the opinion is independently initialized with uniform distribution. We simulate the BA networks with different average degrees, and the comparison results are shown as follows (100 times the average).
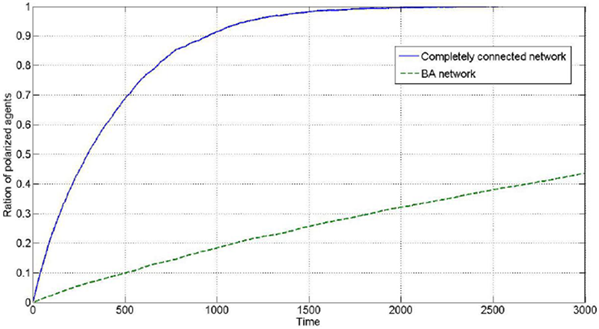
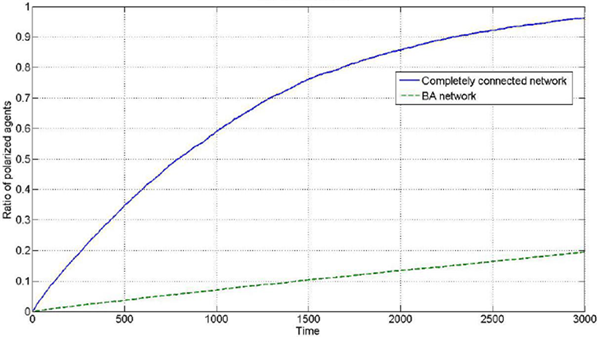
Figure 8 suggests that the degree of polarization has a positive correlation with the average degree. The y-axis represents the polarization level, which is measured by the ratio of the polarized agents. The higher the average degree, the faster the process of polarization progresses, and the higher the ratio of the polarized agents is in the end. It can be observed that the average degree is an important parameter that affects the polarization process because the higher the average degree, the denser the connection between the agents, and the probability of interaction between agents is also higher. This scenario is conducive to the generation of polarization phenomenon. In the completely connected network, the polarization level is higher than that in BA networks, which are not completely connected.
Impact of the assimilation effect and the contrast effect parameter on opinion polarization
Different latitudes of acceptance and non-commitment can be described by (\(d_1, d_2\)), where \(d_1\) is the assimilation effect parameter and \(d_2\) is the contrast effect parameter, which affect the evolution of the opinions. In all experiments in this section, we set the parameters \(\mu=0.20\), \(\lambda=0.05\), and number of agents =100, and every dimension of the opinion is initialized independently with uniform distribution.
In the high ego-involvement condition, we formalize agents with a relative high ego-involvement by setting \(d_1\) at 0.35 and \(d_2\) at 0.5. The characteristic evolution of the opinions is shown as follows.
The results show the emergence of a multi-polarization of opinion. Agents easily repel each other to make their opinions move to the extreme position.
In the condition of high latitude of acceptance and non-commitment, we formalize the scenario by setting \(d_1\) at 1.5 and \(d_2\) at 1.6. A typical evolution of the opinions is pictured in Figure 10.
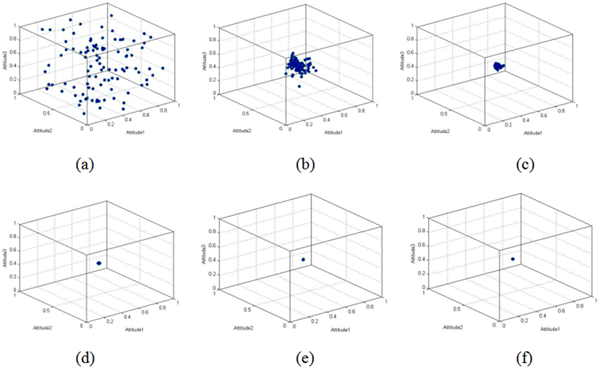
We observe that the agents find consensus near the neutral position. In this condition, the assimilation effect dominates the opinion dynamics because random contacts have a higher chance of falling into the latitude of acceptance than in the latitude of rejection in this condition.
In the next condition, we formalize the agents with a relatively small latitude of acceptance and large latitude of non-commitment by setting \(d_1\) at 0.5 and \(d_2\) at 1.1. A typical evolution of the opinions is shown in Figure 11.
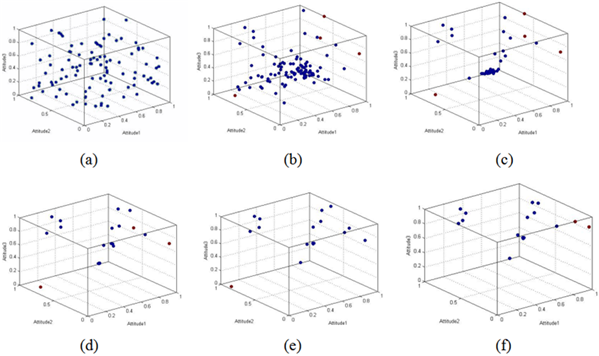
In this condition, both contrast and assimilation dynamics are observed. Agents gather to build groups via assimilation dynamics. Groups reject each other via the contrast dynamics, and they move to extremes and become stable in different positions. The combined effect of contrast and assimilation dynamics causes the agents within one group to converge towards a single position at the same time.
Additionally, we consider the condition of a notably small latitude of acceptance and z notably high latitude of non-commitment by setting \(d_1\) at 0.35 and \(d_2\) at 1.5. A typical evolution of the opinions is shown in Figure 12.
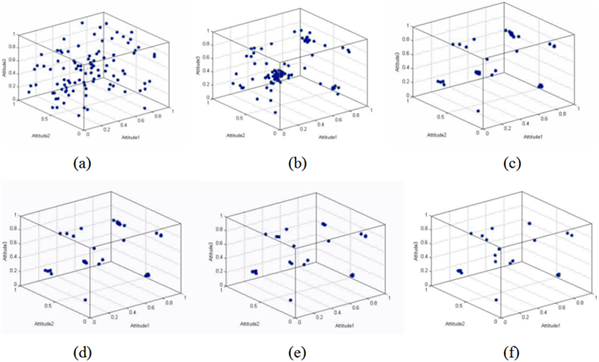
In this situation, we observe the emergence of several groups, some in the middle and others in relatively extreme positions. This result can be explained by the fact that only contacts within close range lead to the assimilation effect, causing these groups to converge, and the reaction between the groups are within the latitude of non-commitment or achieve an equilibrium.
Similar dynamics in one-dimensional opinion were shown by Jager and Amblard (2005), although we note that more complex distributions occur in multidimensional cases. Additional groups can emerge, and the distributions are more complex. The values of (\(d_1\), \(d_2\) influence the evolution dynamics and the distribution of opinions in the end.
In this section, we study the effect of the assimilation effect parameter \(d_1\) and the contrast effect parameter \(d_2\) on the process of opinion polarization. Values of \(d_1\) and \(d_2\) fall in the interval \(\[0,sqrt{n}]\), where \(n\) is the number of the dimensions of the opinion, and \(d_2\geq d_1\). The proportions of the polarized agents and the neutral agents are different when the values of (\(d_1\), \(d_2\) ) are different. Figure 13 demonstrates the influence of different parameters on the polarization. The polarization ratio distribution created by (\(d_1\), \(d_2\) ) is shown below (100 times the average).
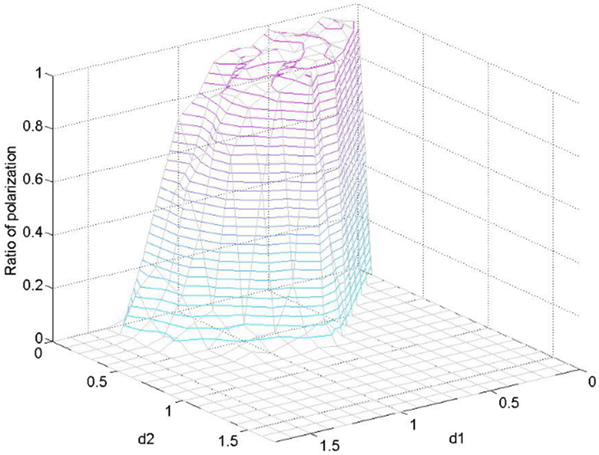
In Figure 13, we obtained similar trends with the existing results of one-dimensional opinion (Chau et al 2013). Polarization distribution of two-dimensional opinion by (\(d_1\), \(d_2\)) is shown as follows:
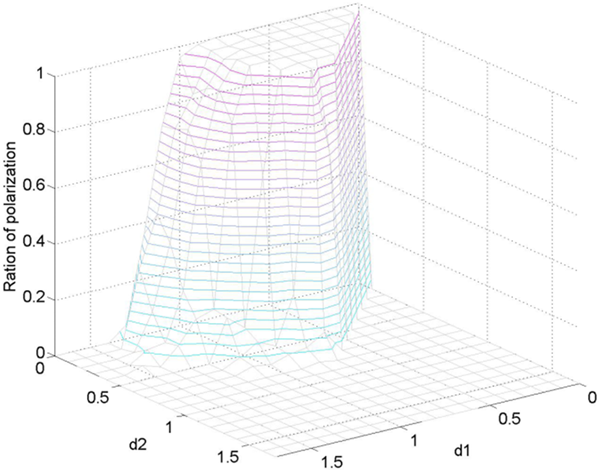
Figure 14 shows a distribution trend similar to the one shown in Figure 13. We found that when \(d_1\) and \(d_2\) approach zero, the proportion of extreme opinions approaches the maximum value.
Influence of different dimensions of opinion
The influence among different dimensions of the opinion is an important research topic in multidimensional opinion polarization. In sociology research, statistical methods are often used to analyse the collected data and to study the correlation among different factors. In this work, we combine the model-based multi-agent simulation and the statistical analysis method. We obtain the data using multi-agent simulation, and the data are considered as social survey data. Finally, we analyse the data using statistical correlation analysis. The two dimensions are initialized with uniform distribution, and the two-dimensional distribution and the distribution of one certain dimension after evolution are shown as follows.
To observe the influence between these two dimensions, we initialize the first dimension using a normal distribution with a mean value of 0.5 and a variance of 0.1. The second dimensional is initialized with uniform distribution. The opinion distributions of two dimensions and the second dimension after evolution are shown below:
The figure above shows that when the first dimension is normally distributed, the initial opinions are concentrated near the mean value. Therefore, after the evolution process, many opinions are distributed near the neutral position in the first dimension, whereas the distribution of the second dimension is similar to the result of the previous experiment.
Repeated experiments show a similar phenomenon in that the relation between the polarization processes of two dimensions does not appear obvious. To further investigate this phenomenon, we performed further correlation detection experiments. The number of the individuals is 1000, and the parameters are set as follows: \(\mu=0.20\), \(\lambda=0.05\), \(d_1=0.4\), and \(d_2=0.45\). The first dimension is initialized using a normal distribution with a mean value of 0.5 and a variance of \(D\in (0,1]\). The second dimension is initialized with a uniform distribution. We take the variance \(D\) as the independent variable. The following data were obtained from evolutionary computation at different values of \(D\): The final global polarization ratio (GPR), the first-dimension opinion polarization ratio of jh10 (polarization of 0) and jh11 (polarization of 1), and the second-dimension opinion polarization ratio of jh20 (polarization of 0) and jh21 (polarization of 1). The data obtained are shown in Table 1. Using \(D\) as the independent variable, we analyse the correlation between the variance ‘\(D\)’ and the level of polarization using SPSS, and the results are shown in Table 2:
| Dimension 1 Initialized D | Global Polarization Ratio(GPR) | jh10 | jh11 | jh20 | jh21 |
| 0.1 | 0.354 | 0 | 0 | 0.232 | 0.122 |
| 0.2 | 0.406 | 0.079 | 0.021 | 0.228 | 0.108 |
| 0.3 | 0.513 | 0.167 | 0.111 | 0.217 | 0.114 |
| 0.4 | 0.589 | 0.223 | 0.172 | 0.228 | 0.127 |
| 0.5 | 0.684 | 0.286 | 0.228 | 0.228 | 0.136 |
| 0.6 | 0.721 | 0.334 | 0.261 | 0.21 | 0.102 |
| 0.7 | 0.791 | 0.356 | 0.308 | 0.237 | 0.118 |
| 0.8 | 0.798 | 0.375 | 0.327 | 0.213 | 0.127 |
| 0.9 | 0.862 | 0.406 | 0.345 | 0.221 | 0.137 |
| 1 | 0.848 | 0.418 | 0.341 | 0.208 | 0.126 |
| D | GPR | ||
| Pearson Correlation | 1 | .973** | |
| D | Significance Level (bilateral) | .000 | |
| N | 10 | 10 | |
| Pearson Correlation | .973** | 1 | |
| GPR | Significance Level (bilateral) | .000 | |
| N | 10 | 10 |
The results show that the correlation coefficient of the variance (\(D\)) and the global polarization ratio (GPR) is significant at the level of 0.01. The correlations between the variance (\(D\)) and the opinion polarization of the first dimension are shown in Table 3.
| D | jh10 | ||
| Pearson Correlation | 1 | .965** | |
| D | Significance Level (bilateral) | .000 | |
| N | 10 | 10 | |
| Pearson Correlation | .965** | 1 | |
| jh10 | Significance Level (bilateral) | .000 | |
| N | 10 | 10 | |
| D | jh11 | ||
| Pearson Correlation | 1 | .966** | |
| D | Significance Level (bilateral) | .000 | |
| N | 10 | 10 | |
| Pearson Correlation | .966** | 1 | |
| jh11 | Significance Level (bilateral) | .000 | |
| N | 10 | 10 |
The variance \(D\) (the initial distribution) was significantly correlated with the polarization of the first dimension (bilateral) at the 0.01 level. The correlation between the initial distribution (variance \(D\)) of the first dimension and the opinion polarization of the second dimension is shown in Table 4.
| D | jh20 | ||
| Pearson Correlation | 1 | -.512 | |
| D | Significance Level (bilateral) | .130 | |
| N | 10 | 10 | |
| Pearson Correlation | -.512 | 1 | |
| jh20 | Significance Level (bilateral) | .130 | |
| N | 10 | 10 | |
| D | jh21 | ||
| Pearson Correlation | 1 | .392 | |
| D | Significance Level (bilateral) | .262 | |
| N | 10 | 10 | |
| Pearson Correlation | .392 | 1 | |
| jh11 | Significance Level (bilateral) | .262 | |
| N | 10 | 10 |
When the parameters are set to \(\mu =0.20\), \(\lambda=0.05\), \(d_1=0.5\), and \(d_2=0.8\), we obtain the following experimental results.
| Dimension 1 Initialized D | Global Polarization Ratio(GPR) | jh10 | jh11 | jh20 | jh21 |
| 0.1 | 0.226 | 0 | 0 | 0.154 | 0.072 |
| 0.2 | 0.287 | 0.038 | 0.008 | 0.176 | 0.085 |
| 0.3 | 0.422 | 0.16 | 0.075 | 0.185 | 0.093 |
| 0.4 | 0.555 | 0.213 | 0.147 | 0.198 | 0.11 |
| 0.5 | 0.618 | 0.289 | 0.2 | 0.184 | 0.103 |
| 0.6 | 0.658 | 0.284 | 0.261 | 0.191 | 0.09 |
| 0.7 | 0.742 | 0.329 | 0.305 | 0.184 | 0.101 |
| 0.8 | 0.776 | 0.346 | 0.34 | 0.192 | 0.108 |
| 0.9 | 0.833 | 0.394 | 0.359 | 0.224 | 0.099 |
| 1 | 0.836 | 0.405 | 0.368 | 0.203 | 0.1 |
The results show that correlation coefficients of the variance (\(D\)) and the global polarization ratio (\(GPR\)) are significant at the 0.01 level. The correlations between the variance (\(D\)) and the opinion polarization of the first dimension are shown in Table 7.
| D | jh10 | ||
| Pearson Correlation | 1 | .962\(^\star\star\) | |
| D | Significance Level (bilateral) | .000 | |
| N | 10 | 10 | |
| Pearson Correlation | .962\(^\star\star\) | 1 | |
| jh10 | Significance Level (bilateral) | .000 | |
| N | 10 | 10 | |
| D | jh11 | ||
| Pearson Correlation | 1 | .982\(^\star\star\) | |
| D | Significance Level (bilateral) | .000 | |
| N | 10 | 10 | |
| Pearson Correlation | .982 | 1 | |
| jh11 | Significance Level (bilateral) | .000 | |
| N | 10 | 10 |
The variance \(D\) (the initial distribution) was significantly correlated with the polarization of the first dimension (bilateral) at the 0.01 level. The correlations between the initial distribution (variance \(D\)) of the first dimension and the opinion polarization of the second dimension are shown in Table 8.
| D | jh20 | ||
| Pearson Correlation | 1 | .784\(^\star\star\) | |
| D | Significance Level (bilateral) | .007 | |
| N | 10 | 10 | |
| Pearson Correlation | .784\(^\star\star\) | 1 | |
| jh20 | Significance Level (bilateral) | .007 | |
| N | 10 | 10 | |
| D | jh21 | ||
| Pearson Correlation | 1 | .617\(^\star\star\) | |
| D | Significance Level (bilateral) | .058 | |
| N | 10 | 10 | |
| Pearson Correlation | .617 | 1 | |
| jh11 | Significance Level (bilateral) | .058 | |
| N | 10 | 10 |
We observe that the polarization in the second dimension is correlated with the initial variance of the opinion in the first dimension. The initial distribution of one dimension has an influence on the evolution of the other dimension, although under certain conditions, the correlation of the initial distribution (variance \(D\)) of the first dimension and the opinion polarization of the second dimension is not highly significant, and the correlation might become more significant as (\(d_1\), \(d_2\)) varies.
The results indicate that the initial distribution of one dimension can significantly affect the polarization of this dimension, and it might also affect the evolution processes of different dimensions. The evolution processes in different dimensions of the opinion show correlation under certain specific conditions.
In the case of a two-dimensional opinion, when the opinion difference of the first dimension is known, the total difference between two agents is decided by the opinion difference of the second dimension, as shown in Figure 17.
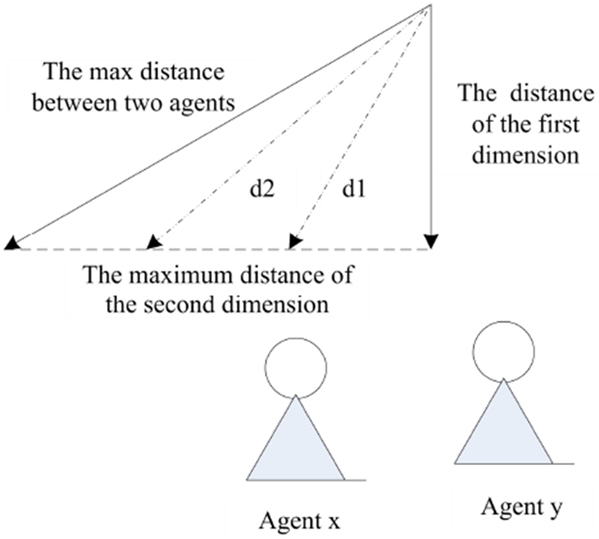
The maximum distance between the two agents is shown in Figure 17, and the minimum distance is equal to the distance of the first dimension. If the values of \(d_1\) or \(d_2\) occur to occur in the middle of the maximum distance and the minimal distance between the two agents, the distance of the second dimension influences the evolution of the opinions of agent \(x\) and agent \(y\), which is the reason why correlations exist between the evolution of different dimensions of the opinion.
Discontinuous equilibrium phenomenon in the process of opinion evolution.
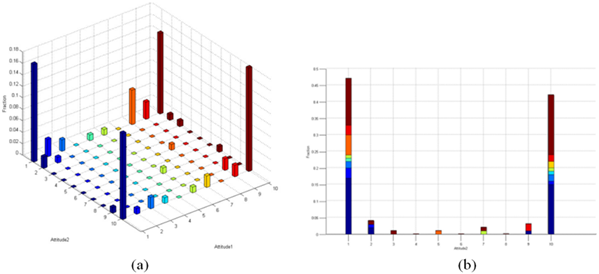
People's opinions on social events and the evolution process are affected by the social opinion tolerance value. The values of \(d_1\) and \(d_2\) are the representation of the social opinion tolerance value in the model. In real society, we observe the phenomenon that the social opinion tolerance value changes slowly, representing a fundamental change in social evaluation. Changing the values of \(d_1\) and \(d_2\) can reflect the change in the social opinion tolerance value. In the process of simulation, the change of \(d_1\) and \(d_2\) occurs slowly, which means that the adjustment of \(d_1\) and \(d_2\) in the evolution is a process of balance. In other words, the speed of adjustment is much slower than the speed of evolution. We set the total number of agents=100, and the initial values are \(d_1\)=0.1 and \(d_2\)=0.9. After the evolution stabilizes, we adjust the value of \(d_1\) every 100 steps and observe the change in the opinion distribution. The experimental results are shown as follows.
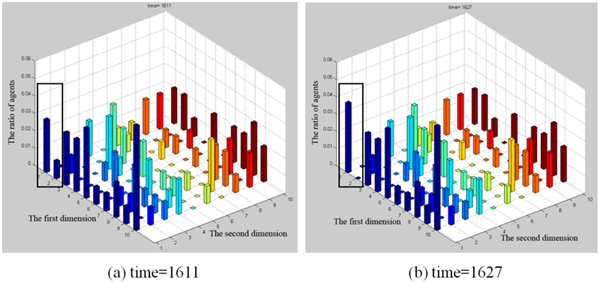
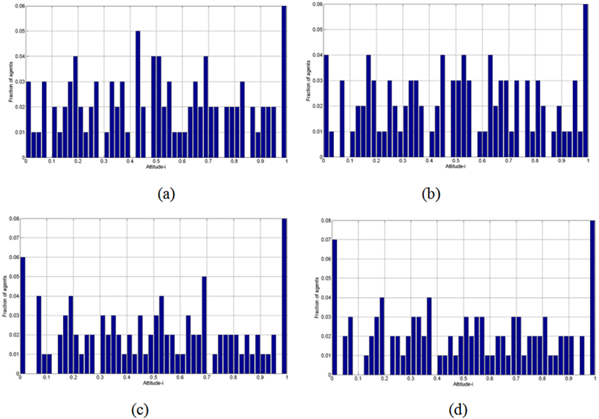
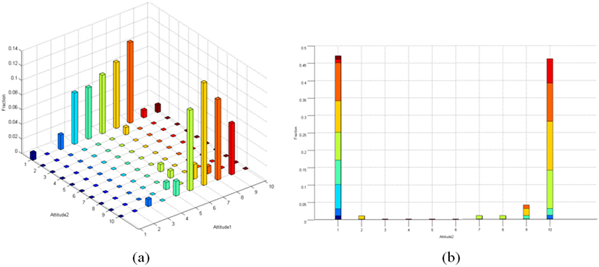
In Figure 18, the \(x\)-axis and \(y\)-axis represent the two dimensions of the opinion, and the z-axis represents the ratio of agents in each interval. Each dimension of the opinion is described by a variable in [1,10], and the colours of the columns are arbitrary for clear display, where 1 or 10 means polarized status. The left and right sub-panels correspond to different simulation times. Figure 18(a) corresponds to time=1611, and Figure 18(b) corresponds to time=1627. The opinion distribution remains unchanged from time=1611 (as shown in Figure 18(a)), and the opinion distribution suddenly shifts when time=1627 (as shown in Figure 18(b), the opinion distribution in the box changes). The phenomenon in which the opinion distribution suddenly changes over a period of time is known as the discontinuous equilibrium phenomenon. This phenomenon corresponds to the discontinuous equilibrium theory in social psychology (Schelling 1971). The discontinuous equilibrium theory shows that the people’s opinions on a social event are always inclined to change suddenly after a relatively long period of rest. This conclusion is obtained in our experiments.
In the model of this paper, if two connected individuals have different opinions and their opinions remain unchanged in the interaction, there are two possibilities:
- The agents are located in neither the assimilation nor the contrast effect zone,
- The agents are located at the two respective extremes of 0 and 1.
When the difference between the opinions of the two individuals is in the interval (\(d_1\), \(d_2\), their opinions do not affect each other. In a certain period of evolution, these opinions remain unchanged, and the distribution of opinion remains unchanged as well. With the change in the social opinion tolerance value, when the values of \(d_1\) and \(d_2\) shift to certain values, these two connected individuals might be located in the assimilation or contrast effect zone. The assimilation effect or contrast effect begins to operate, and the opinions of the agents begin to change at this time. The distribution of opinion suddenly changes after a long period of time, and fusion of different opinion groups might suddenly occur. The discontinuous equilibrium phenomenon occurred in the opinion distribution, and this phenomenon was confirmed in the one-dimensional model (Chau et al. 2014). In the case of the two-dimensional opinion, the discontinuous equilibrium phenomenon occurs in the plane, which means that two dimensions of the opinion might both remain unchanged for a long time before a sudden change. Therefore, we can conclude that a certain linkage mechanism exists between the different dimensions of opinion in the evolution process. Those individuals who have different opinions in different dimensions might suddenly achieve consensus on all dimensions in certain situations.
The phenomenon in which opinions on social problems suddenly change after a long period of time is known as the discontinuous equilibrium theory in social psychology. This phenomenon is commonly observed in social reality (Schelling 1971). These experiments demonstrated that this phenomenon exists in the evolution of multidimensional opinion. In a real society, the evaluation of a certain social event is often not limited to one single dimension, and thus multidimensional opinion research is better able to reflect real social events.
Conclusions
Previous research using case studies or statistical data analyses struggled to represent the occurrence and development of collective behaviour dynamics or to describe the evolution and polarization process of opinion. Based on the classical J-A model, we proposed a multidimensional opinion evolution model based on social judgment theory. This model is more realistic than the traditional one-dimensional model.
After constructing the model of multidimensional opinion evolution, we used the multi-agent Monte Carlo method for implementation and simulation. This approach overcomes the difficulty in solving a complex model using classical mathematics methods such as the mean-field analysis. The results obtained are relatively simple. Based on the framework of social computing, the experimental study is conducted using the multi-agent Monte Carlo method. Polarization phenomena are observed in the evolution process of multidimensional opinion in both the BA network and the completely connected network.
We observed the effect of the average degree of the network on opinion polarization. The results of the simulation experiments show that as the average degree increases, the polarization process accelerates, and the opinion polarization ratio increases in the end. The mechanism of this phenomenon is analysed and explained.
The impacts of the assimilation effect parameter \(d_1\) and the contrast effect parameter \(d_2\) were investigated. Under the condition of high latitudes of acceptance and non-commitment, the agents find consensus near the neutral position after evolution. However, in the high ego-involvement condition, the emergence of a multiple polarization of opinions is observed.
The interactions among dimensions are an important problem in the process of evolution. By creatively combining the social computing simulation and social statistical analysis, we study the mutual influence of different dimensions of opinion in the process of evolution. The results show that the initial distribution of one dimension can significantly affect the polarization result of this dimension, and the evolution processes of different dimensions of the opinion show correlation under certain specific conditions.
The discontinuous equilibrium phenomenon in multidimensional opinion evolution is observed. The experimental results are consistent with the existing research results and the related social theories. This observation also confirms the validity and reliability of this model.
In subsequent work, we plan to further investigate opinion dynamics for heterogeneous populations in which every agent has different parameters. By assigning each agent different \(d_1\) and \(d_2\) values, this model can be applied to simulate heterogeneous networks. Different values of (\(d_1\), \(d_2\)) describe the different psychological features of every agent. Subsequently, we plan to use a real social network to test how opinion evolves in a real social network. The real social network can be obtained from the Internet using “big data” technology. Finally, we intend to use the extended model to simulate an opinion evolution process and compare the simulation results with a real evolution process on the Internet. Using this approach, we can better study how to predict online opinion polarization and offer insightful advice for social management.
Acknowledgements
This research is supported by the National Natural Science Foundation of China (Grant No. 61540032), the Specialized Research Fund for the Doctoral Program of Higher Education of China (Grant No. 20130142110051)References
ALIZADEH, M., Coman, A., Lewis, M., & Cioffi-Revilla, C. (2014). Intergroup conflict escalation leads to more extremism. Journal of Artificial Societies & Social Simulation, 17(4), 4: https://www.jasss.org/17/4/4.html. [doi:10.18564/jasss.2559]
BARABASI, A. L., & Albert, R. (1999). Emergence of scaling in random networks. Science, 286(5439), 509-512.
BEKAFIGO, M. A., & Mcbride, A. (2013). Who tweets about politics? Political participation of Twitter users during the 2011gubernatorial elections. Social Science Computer Review, 31(5), 625-643. [doi:10.1177/0894439313490405]
CHAU, H. F., Wong, C. Y., Chow, F. K., & Fung, C. H. F. (2013). Social judgment theory based model on opinion formation, polarization and evolution. Physica A Statistical Mechanics & Its Applications, 415, 133-140.
CRAWFORD, C., Brooks, L., & Sen, S. (2013). Opposites repel: the effect of incorporating repulsion on opinion dynamics in the bounded confidence model. Proceedings of the 2013 international conference on Autonomous agents and multi-agent systems (pp.1225-1226). International Foundation for Autonomous Agents and Multiagent Systems.
DAVIS, R., Owen, D. M. (1998). New media and American politics. Oxford University Press.
DEFFUANT, G., Neau, D., Amblard, F., & Weisbuch, G. (2000). Mixing beliefs among interacting agents. Advances in Complex Systems, 3(01n04), 87-98. [doi:10.1142/S0219525900000078]
DYAGILEV, K., & Yom-Tov, E. (2014). Linguistic Factors Associated With Propagation of Political Opinions in Twitter. Social Science Computer Review, 32(2), 195-204.
EAGLY, A. H., & Chaiken, S. (1993). The psychology of attitudes. Harcourt Brace Jovanovich College Publishers.
EARL, J., Kimport, K., Prieto, G., Rush, C., & Reynoso, K. (2010). Changing the world one webpage at a time: Conceptualizing and explaining Internet activism. Mobilization: An International Quarterly, 15(4), 425-446.
ERDŐS, P., & Rényi, A. (1959). On random graphs, I. Publicationes Mathematicae, 6, 290-297.
ETESAMI S. R., Basar T., Nedic A. & Touri B. (2013). Termination time of multidimensional Hegselmann-Krause opinion dynamics. Proceedings of the American Control Conference, 1255-1260.
GOH, K. I., Kahng, B., & Kim, D. (2001). Universal behavior of load distribution in scale-free networks. Physical Review Letters, 87(27), 455-475. [doi:10.1103/PhysRevLett.87.278701]
GRANOVETTER, M. (1978). Threshold models of collective behavior. American journal of sociology, 83(6), 1420-1443.
GRIFFIN, E., Andrew, L., & Glenn, S. (2010). A first look at communication theory. McGraw-Hill, 25(4), 4-15.
GULATI, G. J., Hadlock, C. R., & Gainsborough, J. F. (2011). VODYS: an agent-based model for exploring campaign dynamics. Social Science Computer Review, 29(2), 250-272.
HAN, Z. M. (2012). Interest expression,resource mobilization and agenda setting: an descriptive analysis on the NAO-DA phenomenon. Journal of Public Management, 9(2), 52-66. (In Chinese)
HOSCH-DAYICAN, B., Amrit, C., Aarts, K., & Dassen, A. (2016). How do online citizens persuade fellow voters? Using Twitter during the 2012 Dutch parliamentary election campaign. Social Science Computer Review, 34(2), 135-152.
HUET, S., Deffuant, G., & Jager, W. (2008). A rejection mechanism in 2D bounded confidence provides more conformity. Advances in Complex Systems, 11(04), 529-549. [doi:10.1142/S0219525908001799]
JAGER, W., & Amblard, F. (2005). Uniformity, bipolarization and pluriformity captured as generic stylized behavior with an agent-based simulation model of attitude change. Computational & Mathematical Organization Theory, 10(4), 295-303.
JOSEPH, K., Morgan, G. P., Martin, M. K., & Carley, K. M. (2013). On the Coevolution of Stereotype, Culture, and Social Relationships: An Agent-Based Model. Social Science Computer Review, 32(3), 295-311. [doi:10.1177/0894439313511388]
KRAVARI, K., & Bassiliades, N. (2015). A survey of agent platforms. Journal of Artificial Societies and Social Simulation, 18(1), 11: https://www.jasss.org/18/1/11.html.
LAGUNA M. F., Abramson G. & Zanette D. H. (2003). Vector opinion dynamics in a model for social influence. Physica A: Statistical Mechanics & Its Applications, 329, 459-472. [doi:10.1016/S0378-4371(03)00628-9]
LI, Z. P., Tang X. J. (2014). Threshold model of collective action. Journal of Systems Science and Mathematical Sciences, 34(5), 550-564. (In Chinese)
LI, Z. P., Tang X. J. (2013). Exogenous covariate and non-positive social influence promote group polarization. Journal of Management Sciences in China, 16(3), 73-81. (In Chinese)
LOPEZ-PINTADO, D., & Watts, D. J. (2008). Social influence, binary decisions and collective dynamics. Rationality and Society, 20(4), 399-443.
MEJOVA, Y., & Weber, I. (2014). Quantifying politics using online data: Introduction. Social Science Computer Review, 32(2), 131-131. [doi:10.1177/0894439313506848]
MILLS, K. (2002). Cybernations: Identity, self-determination, democracy and the" Internet effect" in the emerging information order. Global Society, 16(1), 69-87.
MORETTI, S. (2002). Computer Simulation in Sociology What Contribution? Social Science Computer Review, 20(1), 43-57. [doi:10.1177/089443930202000105]
NETANEL, N. W. (2000). Cyberspace self-governance: A skeptical view from liberal democratic theory. California Law Review, 395-498.
FERNÁNDEZ-MÁRQUEZ, C. M., & Vázquez, F. J. (2014). A simple emulation-based computational model. Journal of Artificial Societies and Social Simulation, 17(2), 8: https://www.jasss.org/17/2/8.html. [doi:10.18564/jasss.2449]
FORTUNATO S., Latora V., Pluchino A. & Rapisarda A. (2005). Vector opinion dynamics in a bounded confidence consensus model. International Journal of Modern Physics C, 16(10), 1535-1551.
FRANTZ, C., Purvis, M. K., & Nowostawski, M. (2013). Agent-based modeling of information transmission in early historic trading. Social Science Computer Review, 32(3), 393-416. [doi:10.1177/0894439313511931]
QUINTELIER, E., & Vissers, S. (2008). The effect of Internet use on political participation an analysis of survey results for 16-year-olds in Belgium. Social Science Computer Review, 26(4), 411-427.
RAND, W., Herrmann, J., Schein, B. & Vodopivec, N. (2015). An Agent-Based Model of Urgent Diffusion in Social Media. Journal of Artificial Societies & Social Simulation, 18(2), 1: https://www.jasss.org/18/2/1.html. [doi:10.18564/jasss.2616]
RASH, W. (1997). Politics on the nets: Wiring the political process. WH Freeman & Co.
SCHELLING, T. C. (1971). Dynamic models of segregation. Journal of Mathematical Sociology, 1(2), 143-186. [doi:10.1080/0022250X.1971.9989794]
SHERIF, M., & Hovland, C. I. (1961). Social judgment: Assimilation and contrast effects in communication and attitude change. New Haven, CT: Yale University Press
SHERIF, C, W., Sherif, M., & Nebergall, R. E. (1982). Attitude and attitude change: The social judgment-involvement approach. American Sociological Review, 31(2).
SMELSER, N. J. (2011). Theory of collective behavior. Quid Pro Books.
SOBKOWICZ, P., & Sobkowicz, A. (2012). Two-year study of emotion and communication patterns in a highly polarized political discussion forum. Social Science Computer Review, 30(4), 448-469. [doi:10.1177/0894439312436512]
SQUAZZONI, F., Jager, W., & Edmonds, B. (2014). Social Simulation in the Social Sciences A Brief Overview. Social Science Computer Review, 32(3), 279-294.
WANG, F. Y. (2005). Social Computing: A Digital and Dynamical Integration of Science, Technology, and Human and Social Studies. China Basic Science, 7(5), 5-12. (In Chinese)
WEISBUCH, G., Deffuant, G., Amblard, F., & Nadal, J. P. (2002). Meet, discuss, and segregate!. Complexity, 7(3), 55-63.
YARDI, S., & Boyd, D. (2010). Dynamic debates: An analysis of group polarization over time on twitter. Bulletin of Science, Technology & Society, 30(5), 316-327. [doi:10.1177/0270467610380011]
ZHANG, W., Johnson, T. J., Seltzer, T., & Bichard, S. L. (2010). The revolution will be networked: The influence of social networking sites on political attitudes and behavior. Social Science Computer Review, 28(1), 75-92.