
Introduction
The continued growth of energy demand across the world is a primary determinant of the year-on-year global increase in greenhouse gas emissions (IPCC 2014), which in turn threatens the world with dangerous climate change, sea level rise, and ocean acidification (IPCC 2013). In some rich countries, including the UK, greenhouse gas emissions have fallen in recent years, in large part because of the reduction in the use of coal to generate electricity (Department for Business, Energy and Industrial Strategy 2017); nevertheless, the use of coal has largely been substituted by that of another fossil fuel, natural gas (which is mainly methane), and this still produces large amounts of CO2, as well as leakage of methane itself, also a greenhouse gas. Natural gas and oil are also used directly in large quantities, mainly being burned for heat. Despite the growth in low-carbon sources of electricity, and to a much lesser extent of biofuels, limiting and if possible reducing the demand for energy remains crucial if essential cuts in greenhouse gas emissions are to be achieved.
CEDSS (Community Energy Demand Social Simulator) is a social simulation model of domestic energy demand in communities of around 100-250 households, such as a village or urban or suburban estate. It focuses on the interactions between economic factors, technological change, social processes and household values, in decisions concerning the purchase of energy-using and energy-saving equipment. To our knowledge, no previous agent-based model of such interactions exists, aside from the work of Bale et al. (2013) on the adoption of solar panels and insulation. Yet these multi-factor interactions are the context in which changes in domestic energy demand are determined, and agent-based modelling appears well-suited to the study of such irreducibly complex processes in which multiple independent but interacting agents make multiple decisions.
CEDSS is written in NetLogo 5.1.0 (Wilensky 1999). Its empirical basis is a 2010 quantitative survey of households in Aberdeen and Aberdeenshire (although only Aberdeen data was used for the runs reported here), combined with data from publicly available sources covering trends in domestic energy use, energy prices, energy-using and energy-saving equipment, and household finances. In the United Kingdom, domestic energy demand accounts for just over one quarter of total energy demand (Department for Business, Energy and Industrial Strategy 2016). Investigation of the factors influencing domestic energy demand over the next few decades, a period which is crucial in limiting the extent of climate change and ocean acidification, is thus of considerable importance. CEDSS was developed as part of a wider research project investigating these factors across five EU countries (project GILDED, see the next section), and in an attempt to demonstrate that social simulation can make a significant contribution to such investigations.
CEDSS is parameterized by retrodicting the domestic energy use and household equipment of some or all of the surveyed households to the year 2000, then running it forward to mid-2010 to compare the outcome with the survey results. It can then be run forward from 2010 under various assumptions, to explore possible future trajectories of household energy demand. Its theoretical basis is goal-framing theory (Lindenberg and Steg 2007; Steg et al. 2014).
This paper reports experiments with CEDSS-3.4 (Polhill and Gotts 2017), using the urban subset of survey households, and running the model forward to 2049. It focuses on the socio-dynamics of the relative strengths of three kinds of values identified in goal-framing theory (“egoistic”, “hedonic” and “biospheric”) which influence the household decision-making algorithms for buying energy-using and energy-saving equipment. Which of these values predominated in the simulated community turned out to have larger effects on energy demand at mid-century than any other aspect of the model. This aspect of the model is not fully constrained either by empirical information, or by goal-framing theory, yet the assumptions made turn out to influence the resulting community energy demand trajectories in complex ways. In particular, many parameter settings result in a bifurcation of energy demand trajectories, depending on which values come to predominate. The implications of these results for simulation models which incorporate the sociodynamics of values are discussed in the concluding section of the paper.
CEDSS-3.4: Brief Overview of the Model
CEDSS was initially developed as part of the EU Seventh Framework Programme’s GILDED project (GILDED 2012): "Governance, Infrastructure, Lifestyle Dynamics and Energy Demand: European Post-Carbon Communities", funded by grant number 225383 under Theme SSH 2007-2.1-04 “Socio-economic factors and actors that shape the 'post-carbon' society. The GILDED project examined both current domestic energy demand across five countries, and likely developments over the period to 2050, using a combination of methods: qualitative and quantitative empirical work, including the survey of Scottish households already mentioned, along with theory and modelling. The project employed goal-framing theory (Lindenberg and Steg 2007; Steg, Bolderdijk et al. 2014) as a theoretical tool; CEDSS tests the usefulness of that theory as the basis for an agent-based model, in combination with quantitative data on Scottish households (see the final Discussion section, and for more detail Polhill and Gotts 2017).
CEDSS is described below using a simplified version of the ODD protocol (Grimm et al. 2010). CEDSS is described in more detail elsewhere (Polhill and Gotts 2017; Gotts et al. 2014). The model and associated documentation are available on the OpenABM node of the CoMSES network at https://www.openabm.org/model/5137/version/1/view, where a full description of the input files and numerical parameters required to run the model is available.
Purpose and brief description of CEDSS entities
The purpose of CEDSS is to explore policy scenarios and campaigns aimed at reducing domestic energy demand, in the context of economic scenarios affecting energy prices and household income. It aims to illuminate possible future interactions (up to 2049) between government action, household and community values, and economic and technological factors in determining future levels of demand. It is not an attempt at producing a predictive model, but rather one that can illuminate the interplay of multiple forces and processes affecting domestic energy demand, over the period which government and other actors concerned with energy policy need to consider. In planning policy in this area, local and national governments need to make assumptions about how households and communities will behave, which in turn depends in part on the values they hold; CEDSS has therefore needed to explore a range of plausible assumptions about the dynamics of relevant values over the period of interest.
CEDSS focuses on direct domestic energy use for heating and household appliances; the amounts of energy (electricity, gas and oil) used for these purposes by the households modelled are the main outputs used in assessing the model. CEDSS households (the model’s agents) make decisions about buying energy-using and energy-saving equipment. Each has a dwelling (house or flat), and a set of appliances, including a heating system. Dwelling size and other fixed properties affect the energy required for space-heating, as does insulation-state (presence or absence of double-glazing and wall insulation, presence and depth of loft insulation). Households have three “value-strength” parameters: hedonic, biospheric and egoistic, used to determine the “goal-frame” within which decisions are made: the enjoy goal-frame corresponding to hedonic values, the sustain goal-frame to biospheric and the gain goal-frame to egoistic values.
Process overview and scheduling
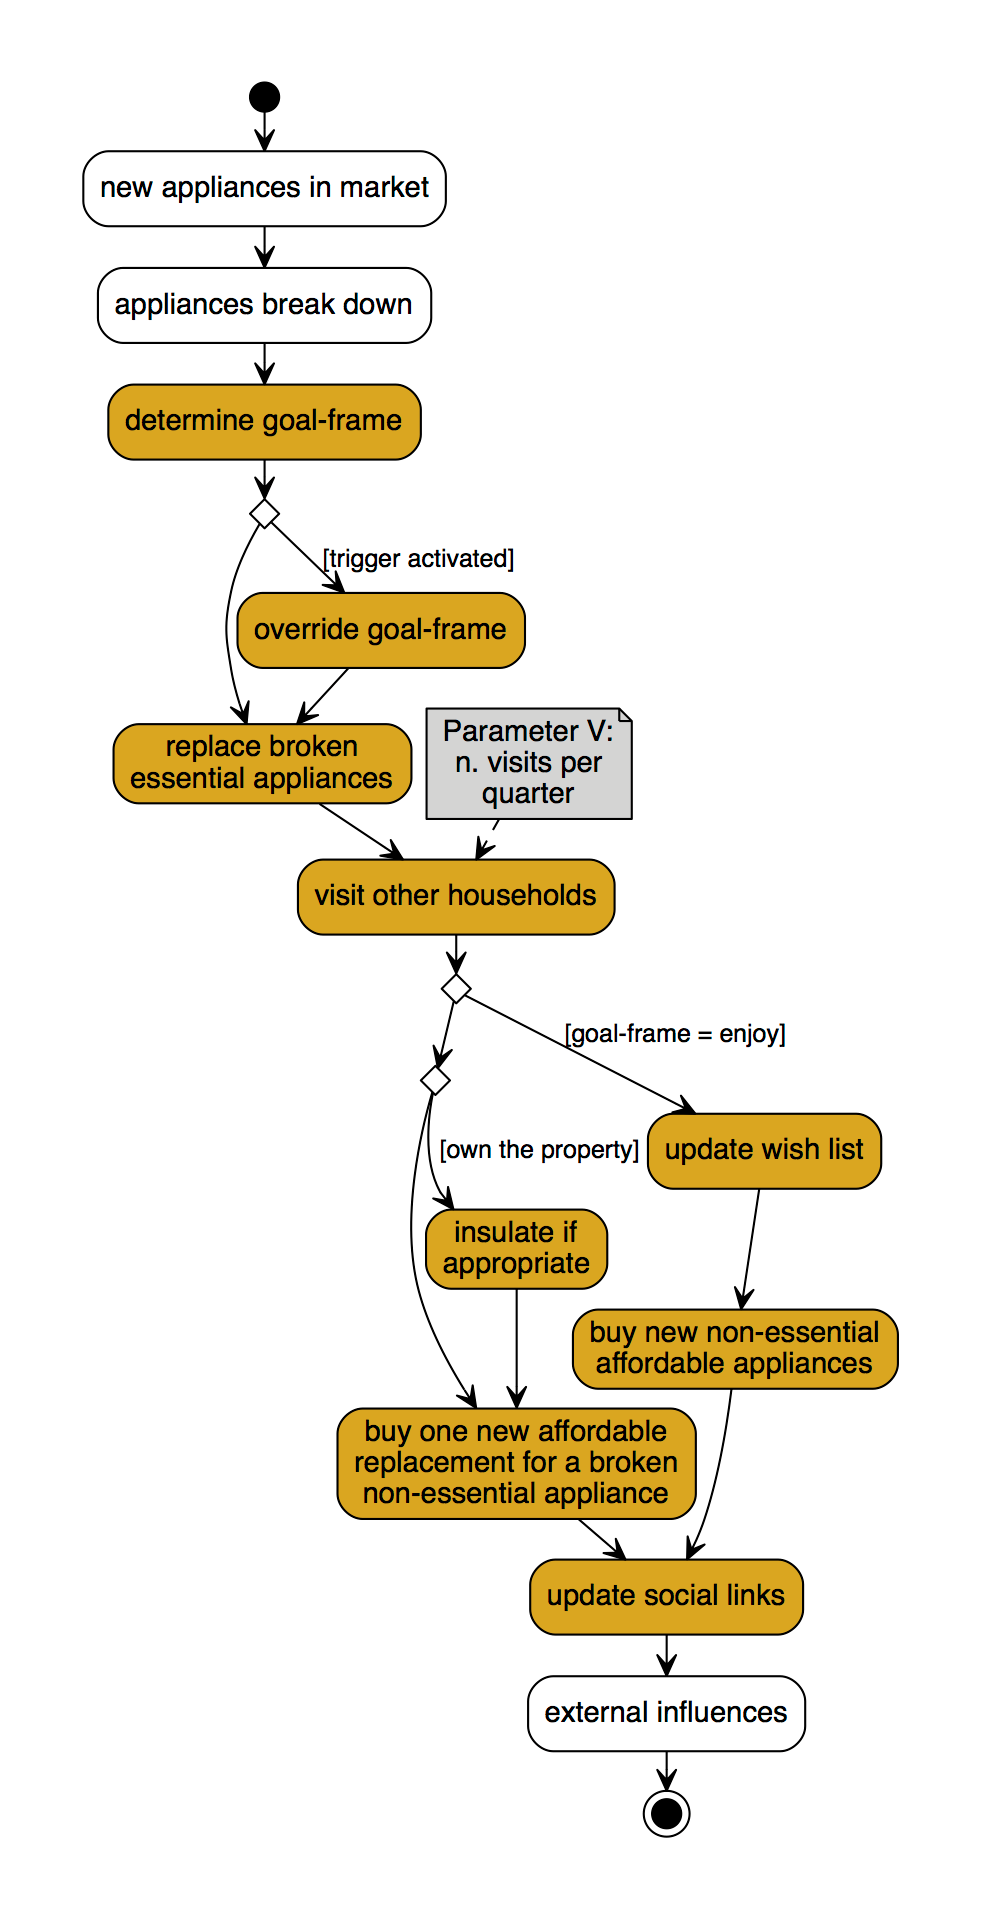
The model operates with a quarterly time-step, with a schedule of multiple activities occurring within each time-step, as follows (see Figure 1).
First, new appliances (and types of insulation) may become available to buy, and existing ones may become unavailable, representing the normal commercial processes of the market in household appliances – although the range of choice within the model is more limited than in reality. Over time, the range of available options will change considerably, with more efficient but also larger and higher-performance items coming onto the market. Meanwhile, some of a household’s appliances may break down, requiring replacement; this takes place at the start of the time-step, although of course in reality it may occur at any point; CEDSS does not model less serious breakdowns that allow for repair. The household also receives income – representing not its total income, but what is available to be spent on energy and energy-related equipment. Income figures are calculated based on data from the survey of real households, adjusted over time to take account of past and projected changes in economic conditions and spending patterns. Together, these factors set the range of choices available to a household; actual decisions depend on household values and inter-household contacts.
Households begin by determining their goal-frame. This is a stochastic outcome weighted by their current value-strengths. The goal-frame thus selected may be overridden (again, stochastically) by “triggers”, which depend on household or external economic conditions.
A household will replace broken essential appliances whatever goal-frame is chosen (a heating system, cooker, refrigerator and washing machine are essential). All other purchase decisions, however, are affected by the goal-frame selected: depending on the goal-frame, a household may buy insulation (if they own the property) and buy new non-essential appliances. Moreover, all households will make V visits to households with which they have a social-link (V is a model parameter), but updating their wish-list of desired appliances in response to what the households they visit possess, depends on their own current goal-frame (see Figure 1).
All households, whatever their current goal-frame, update their social-links in each time-step. With equal probability the household seeks to gain, or loses, a link (links are bidirectional, if a household has only one link it will not be dropped, and new links are not sought if a maximum set as a parameter has been reached). Links are gained mainly among ‘friends-of-friends’. Both gaining and losing links are managed so that links between households owning similar appliances (acting as proxy for both household finance and value-strengths) are favoured.
Finally, households will implement any external influences (i.e., influences from outside the community modelled) on their value-strengths, record their energy demand for the time-step, and update their financial position.
Design Concepts
Those design concepts in the ODD protocol not mentioned here may be assumed not to be addressed in the model.
- Basic Principles. This model is based on goal-framing theory (Lindenberg and Steg 2007; Steg et al. 2014).
- Emergence and observation. Emergent model outcomes are totals and distributions of energy use by households for appliances and heating, the appliances they own, their dwellings’ insulation-states, their liquid capital reserves and value-strengths.
- Sensing and interaction. Households become aware of the appliances other households have when they visit them. Visits between households also cause the value-strength parameters of the two households to converge. (The model would also allow them to diverge, but this has not yet been explored; since people generally prefer not to visit those they dislike – the circumstances under which value divergence is most plausible – exploring this possibility has not been a priority.)
- Stochasticity. Stochasticity is used in selecting a goal-frame for each time-step, and when there are two or more eligible choices (e.g. of an appliance); and to cause certain events to occur with a specified frequency, e.g. breakdown of appliances. It is used extensively during initialisation when sampling household attributes from distributions, allocating a suitable dwelling and constructing the social network.
Initialisation
Initialisation was based on a number of empirical data sources, and the process is described in depth by Gotts et al. (2014).
The most important source of data for all runs reported here was a quantitative survey of 197 households in Aberdeen City, detailing each household’s income, tenancy, dwelling type, energy use, insulation and appliances owned in 2010. One household agent was created for each respondent in the survey. An artificial landscape was designed to simulate a small housing estate of square blocks with eight houses on each side of a square, and the household agents were placed in it, in such a way that households with similar dwellings tended to be close spatially.
Data from publicly available sources were then used to retrodict a plausible state for these households in 2000, allowing the model to be run forward to 2010, and its outputs to be checked against the survey findings. This process, while short of a full calibration and validation exercise, allowed us to ensure that the model was producing realistic results. Specifically:
- Data on household spending on energy and energy-related equipment were drawn from Horsfeld (2011), and corresponding reports for earlier years.
- Data on liquid capital in relation to household income were obtained from Banks, Smith and Wakefield (2002).
- For each possible insulation-state in 2010, the probability that a dwelling had that (or a specified inferior state) in 2000 was based on Palmer and Cooper (2011).
- A list of appliances, comprising a sample of those actually on the market during 2000, was obtained from catalogues of a popular British retail chain, Argos.
The household income decile and status (dwelling owner or renter) from the survey were used to retrodict a plausible quarterly net income for 2000 (income available per time-step for the uses modelled, not total income) and liquid capital reserve.
Finally, the initial value-strength parameters (hedonic, biospheric and egoistic), were taken from distributions, which are model parameters. These distributions, and the parameters controlling the dynamics of value-strengths, are described below.
Input data
Input data to the model consists of time series of appliances that are available on the market, household income, energy prices, and any external (extra-community) influences on value-strengths.
The appliances available from 2000 to 2010 were obtained from the same source as that used during initialisation (Argos catalogues); household income from Horsfield (2011); and energy prices from UK Department of Energy and Climate Change time-series qep413.xls, qep555.xls and qep591.xls (this department no longer exists; copies of the files used are available from the authors). From 2011 onwards, the simulation scenario determines appliance availability, household income and energy prices. External influences on value-strengths are only applied during the post-2010 period, and again depend on the scenario.
Submodels
The most relevant submodels are described in the next section. Others, described in Gotts et al. (2014) cover appliance entry into the market and the breakdown and the replacement of essential appliances.
Goal-Frame Choice and Value Strength Dynamics
Goal-framing theory posits that decisions and actions are strongly influenced by the currently “focal” goal-frame. Each possible goal-frame is linked to a group of values, of which three are relevant in CEDSS: egoistic values (associated with the gain goal-frame) concern prosperity and financial security, hedonic values immediate pleasure (enjoy goal-frame), and biospheric values, care for the environment (sustain goal-frame). The need to distinguish hedonic from egoistic values in the context of environmentally relevant behaviours, although both prioritise individual over collective interests, is argued by Steg et al. (2014). Goal-framing theory includes a fourth group of values: the altruistic. We subsume altruistic values (Lindenberg and Steg 2007; Steg et al. 2014) into biospheric ones; reducing energy demand out of environmental concern can be regarded as motivated by altruistic as well as by biospheric values, indeed it is not clear that the two can be separated in this context. (In other contexts, an action may only express one of the two sets of values, or they may even conflict, for example if it is proposed to build much-needed affordable housing on a site where a rare species breeds.)
In the CEDSS-3.4 representation of goal-framing theory (which is in some respects a simplification, in others an elaboration necessary for a working simulation) the goal-frame is set quarterly to gain, enjoy or sustain at random, with probabilities weighted by the current value-strengths (with a slight variation mentioned below). We first describe the difference this makes to the household’s decision-making, then the dynamics of value-strengths and goal-frame selection.
Which goal-frame is focal during a quarter affects what appliances and insulation the household will buy. This is true of the replacement of broken essential appliances, the installation of new insulation measures, and the purchase of non-essential appliances, to replace a broken appliance or to fulfill a wish to possess something new.
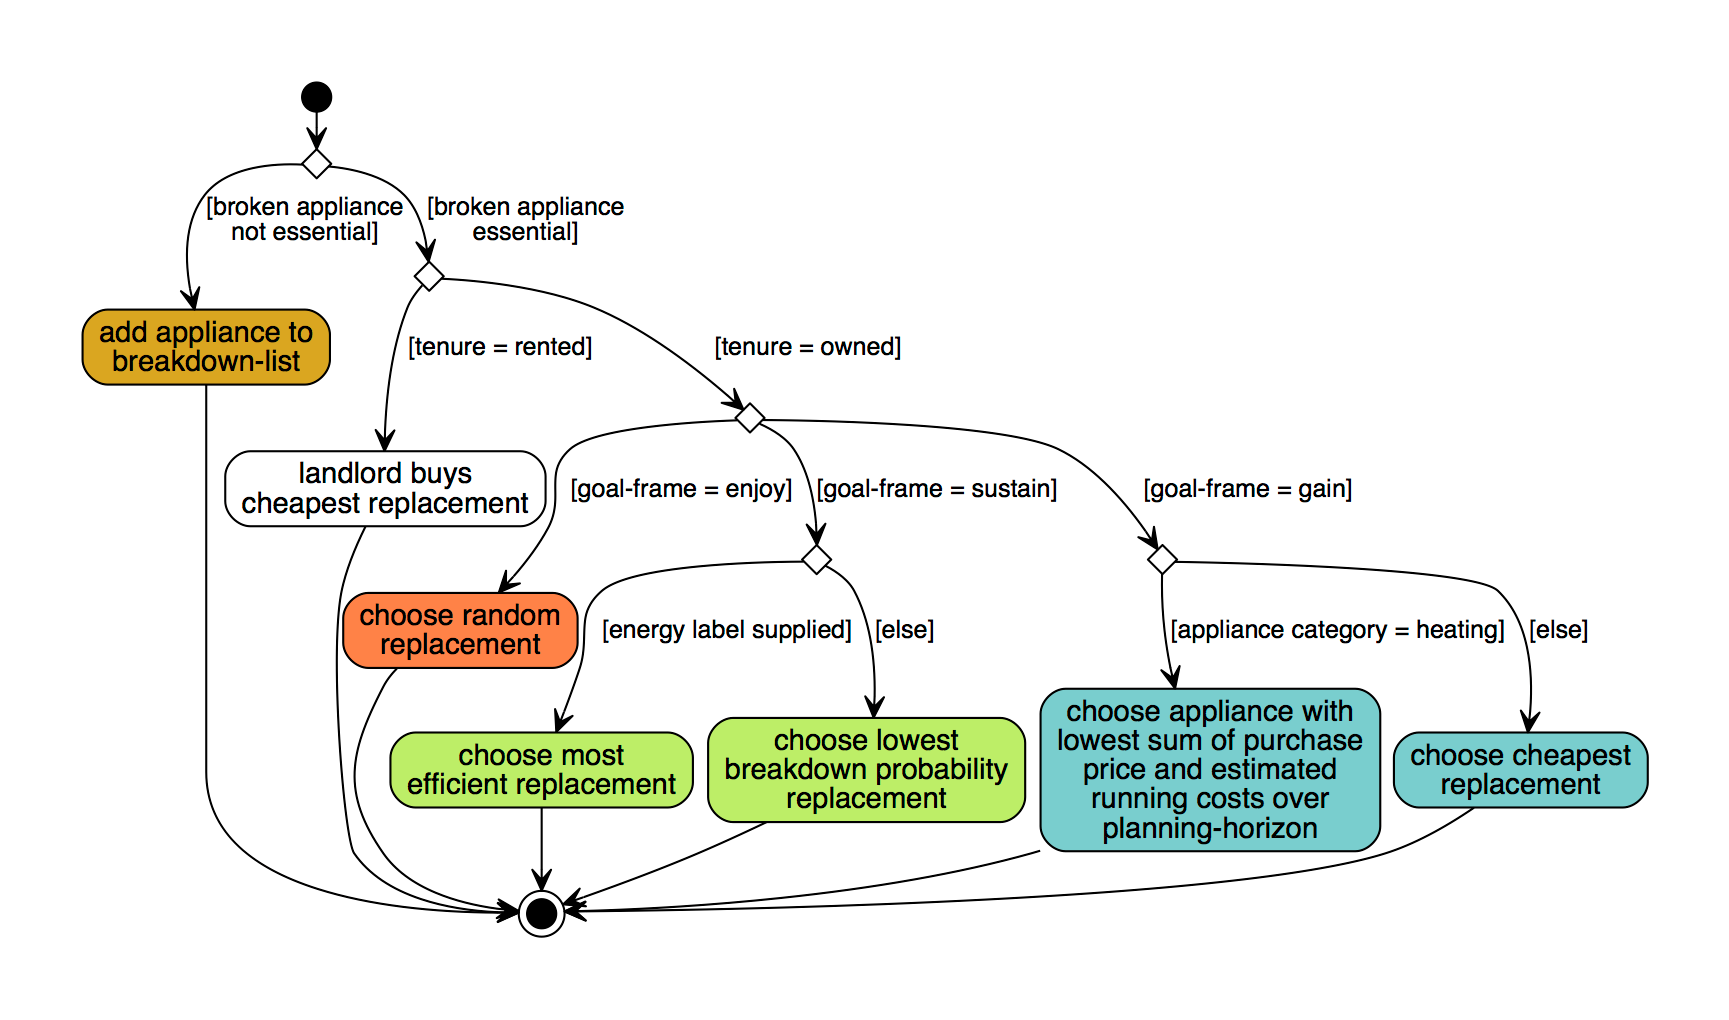
Broken appliances are replaced using rules that depend on tenure, goal-frame, the appliance category, and whether it is essential (see Figures 2 and 3). If the appliance belongs to a non-essential category (the essential categories – as already noted – are currently heating system, cooker, fridge and washing machine, while the non-essential categories are freezer, dishwasher, dryer, and television), then the appliance is added to the breakdown-list of the household rather than being replaced immediately; the replacement of appliances on this list is described below. For an essential appliance, if the household rents its dwelling, it is assumed the landlord will buy the cheapest replacement, irrespective of the household’s wishes; but if the dwelling is owner-occupied, the choice of replacement depends on the goal-frame of the household.
If the goal-frame is enjoy, a random replacement from those currently available is chosen. What will appeal to a household’s hedonism is hard to predict: it cannot safely be assumed, for example, that hedonism will lead to the most expensive or highest-performance alternative being chosen; households may even choose the cheapest so as to be able to buy a larger number of items, or the first that they encounter if they do not enjoy shopping for appliances.
In other cases, the household chooses a replacement to minimise a specific quantity: either monetary outlay, if the goal frame is gain, or energy use if it is sustain. In the first case, heating systems (boilers) are treated as a special case, with the appliance selected being that with the lowest sum of purchase, and estimated running costs over a planning-horizon (always two years in the runs reported here). For other appliance categories, the cheapest replacement is chosen. If the goal-frame is sustain, then if energy-ratings are supplied for the appliance category a random replacement is chosen from those with the best energy-rating. (Currently, heating systems, fridges and washing machines have such ratings in the UK, but cookers do not. Expected energy demand per year might well be a better criterion than the energy rating, which purports to specify energy efficiency (Waechter, Sütterlin and Siegrist 2015), but demand per year depends on usage, and is in any case the energy rating is the only information currently available to UK households.) For cookers, a random choice is made from the currently available options among those of the same type as was previously owned (there are four types, differing in the fuel or fuels used, and how foods are heated).
Insulation is only bought if the goal-frame is sustain or gain. If it is gain, the insulation upgrade is bought that has the highest positive monetary saving over the planning-horizon; if sustain, the insulation upgrade is bought that saves the most energy whilst leaving the liquid capital reserve non-negative.
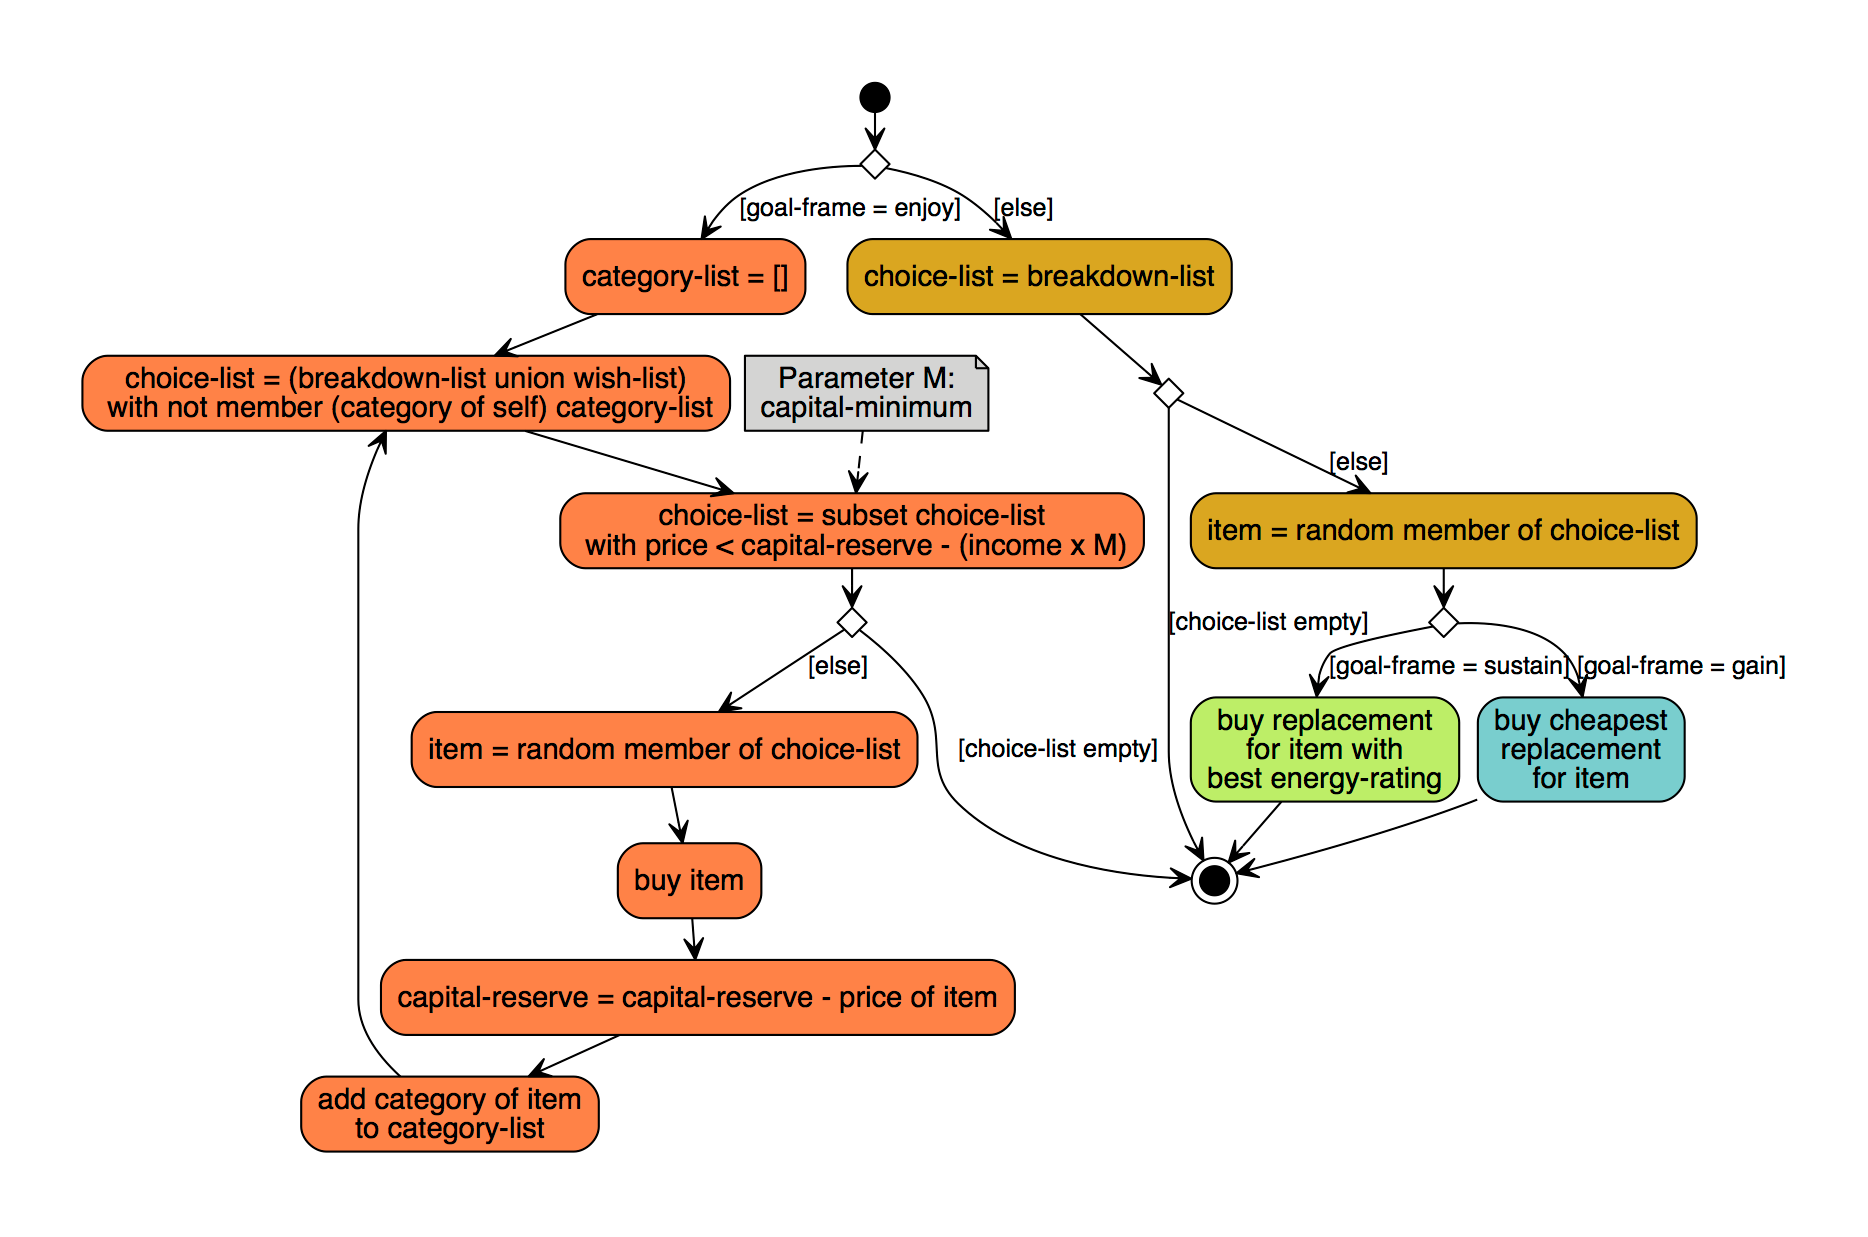
Buying new non-essential appliances depends on the goal-frame, the household’s financial position, and the contents of two lists of potential purchases: the breakdown-list, which lists all non-essential items that have broken down, and hence are liable to be replaced (there is a database listing possible replacements for all items households may own); and the wish-list. This list starts out empty, and is added to only during time-steps when the goal-frame is enjoy. During such time-steps, appliances belonging to subcategories of appliance introduced recently may be added to the wish-list (subcategories allow for technical innovation, e.g. plasma televisions are a subcategory of the television category, the first of which become available in the simulation year 2005), subject to parameters limiting the number of such appliances added and defining recency. Additionally, on every visit to a social contact, the wish-list of the visiting agent is updated to include a randomly chosen appliance that is not a heating system, and which the host agent owns but the visiting agent does not.
The rules for actually buying non-essential appliances also depend on the goal-frame of the household, and make use of a parameter concerning liquid capital. If the goal-frame is enjoy, as many affordable appliances on the union of the wish-list and the breakdown-list are bought as possible, provided that no two are in the same category. An appliance is affordable if its cost is less than current liquid capital reserve, minus the product of income for the time-step and a “capital-minimum” parameter. If the goal-frame is gain, then the cheapest appliance that is a replacement for a member of the breakdown-list is bought. Finally, if the goal-frame is sustain, then a member of the breakdown-list is replaced by an appliance in the same category with the best energy-rating of any available (or a random appliance in the category if energy-ratings are not available). As Figure 2 shows, the model allows for information about breakdown probability per unit time to influence the decision, but in the runs reported here, all items in the same category are assigned the same breakdown rate.
Initial value-strengths for households are set from distributions that are themselves model parameters. For all runs described in this paper, these were uniform distributions drawn from the interval [0,5] for egoistic and hedonic value-strength, and [0,1] for the biospheric value-strength (the relative weakness of biospheric values was based on survey findings indicating that expressed environmental concerns made little difference to energy demand). Thereafter, they can be altered by several mechanisms.
First, at the time the goal-frame is chosen, the value-strength parameter corresponding to the goal-frame selected is incremented by an amount that is itself a parameter (habit-adjustment-factor), while other value-strength parameters are decremented correspondingly. Second, when one household visits another, both agents adjust their goal frame parameters, the visiting agent first, and then (if a “mutual adjustment” parameter is set to true, as it is in all runs reported here) the host agent. The value-strength parameters of a household A are adjusted with respect to those of a household B using the formula GA = GA + vs-adjustmentA × (GB – GA), where GA is value-strength parameter G of household A, GB the corresponding parameter of household B, and vs-adjustmentA the value-strength adjustment parameter of household A. Third, when a purchase decision is made while the goal-frame is sustain, the biospheric value-strength is increased by an amount set by another parameter (which may be 0 or even negative, but goal-framing theory suggests would be positive, by influencing self-identification as environmentally concerned), and the other value-strengths decremented correspondingly. This process is referred to as ‘biospheric boost’.
All the preceding forms of value-strength adjustment are initiated by something a household itself does, and affect the values of at most two households. The model may also include a very different mechanism, intended to represent the influence of governmental, media and NGO information campaigns, or public opinion. This “external influence” input to the model, if present, consists of a time series, each element specifying a time-step, the goal-frame which must be focal for the influence to operate on a household (hence households respond differently from each other), a value-strength to decrease, a value-strength to increase correspondingly, and an amount by which to adjust. Exactly what such external influences consist of is not specified in the model; in general terms, they would consist of the kind of informational materials and encouragement of behavioural and attitudinal change seen over recent decades in the UK in relation to issues including smoking, HIV/AIDS, driving under the influence of alcohol, and recycling. Such campaigns directly target specific behaviours, but necessarily highlight and endorse underlying values – which may be egoistic, altruistic or biospheric (commercial advertising, in contrast, usually appeals to and reinforces hedonic values). Neither individual cognitive and emotional processes, nor intra-household dynamics, are represented in the model with enough refinement to simulate the effects of such campaigns in any detail, so they are specified simply in terms of their effects on value-strengths. It might in fact be more realistic to treat them as influencing the choice of goal-frame directly, affecting value-strengths indirectly through the “habit” mechanism.
Exploration of the Parameter Space
CEDSS-3.4 is sufficiently complex that full exploration of its parameter space is not practicable. A full process of calibration and validation is envisaged using multi-objective genetic algorithms, but such a process requires gaining a reasonable grasp of the model’s behaviour over a broad slice of its parameter space, to identify the most dynamically important parameters, and any model features we should change. The approach taken was first to find, by trial and error, some parameter sets producing a reasonable fit to the survey data when run from 2000 to 2010; then to systematically vary a range of parameters intuitively likely to make significant differences to performance. This process of parameter space selection is not described here, but resulted in eight dimensions being selected to vary while others, including the value-strength distributions already described, remain fixed.
Three of these dimensions concerned the households’ decision-making, the remaining five the external decision environment. The three “household dimensions” were:
- Whether “biospheric boost” is used. If biospheric boost is used, purchases made under goal-frame “sustain” increase biospheric value-strength by .0004 times the purchase cost in £s (to a maximum of 0.4), with the other value-strengths being decreased to compensate. The two parameter settings are referred to as b0 (no biospheric boost) and b4 (biospheric boost used). Goal-framing theory suggests that acting under the influence of a particular goal-frame encourages a person’s self-identification as one holding the associated values, and so would be expected to strengthen those values. It is conceivable that the opposite effect could occur: having acted pro-environmentally could lead to a person feeling they had “done their fair share”, and hence weaken biospheric values. However Thøgersen (2012, p.21), in a review of research on how performing one pro-environmental action can influence the probability of performing another, while conceding that such a “contribution ethic” could have an effect, concluded: “at the moment we are not aware of any evidence suggesting that the effect of this mechanism is strong enough, in practice, to lead to negative spillover.”, that is, to actual reduction in the probability of subsequent pro-environmental behaviour, as opposed to reducing “positive spillover”.
- Whether “triggers” as mentioned above are used or not. If they are, the goal-frame chosen as described above may be adjusted as follows:
- if the household liquid capital reserve is less than 5 times income for the current step, switch from enjoy to gain with probability 0.25; if it is more than 20 times income for the current step, make the opposite switch with the same probability.
- if fuel prices have risen in the current step by more than 15%, switch from enjoy to gain with probability 0.5; if fuel prices have fallen by any amount, make the opposite switch with probability 0.25.
- The two parameter settings are referred to as “n” (no triggers) and “y” (triggers).
- Households limit non-essential purchases even in the “enjoy” goal-frame; they stop buying if liquid capital is either below 15 (“m15”), or below 20 (“m20”) times income this step. (This parameter is called here the “capital-minimum”; the settings m15 and m20 are actually coded as negative integers; positive integer settings can also be used, and allow households to go into debt, but these did not produce good results during the parameter selection process.)
The five “environmental dimensions” were:
- Whether efficiency regulations were applied to some categories of appliances in 5-year stages from 2015. The settings are referred to as YR (yes) and NR (no).
- Whether purchase of efficient boilers was subsidised. The settings are referred to as YS (yes) and NS (no).
- The annual rate at which household incomes rose (0%, 2% or 4% per year) from 2011 onwards.
- The annual rate at which fuel prices rose (0%, 2% or 4% per year) from 2011 onwards. (Note that if income and fuel price both rise at 2% or both at 4%, this is not the same as both remaining stable, as they would rise relative to the cost of equipment.) The market for domestic energy is not modelled: all households using electricity pay the same fixed rate per kWh, all those using gas the same rate per kWh equivalent, and similarly for the few households using oil.
- Whether “external influences” were applied, and if so, whether steadily or varying over time. In the “no influence” condition (N), no external influences exist. In the “steady influence” (S) condition, in every time-step from the first quarter of 2016 onwards, households with the current goal-frame gain or sustain are affected, while those with goal-frame enjoy are not. For households whose goal-frame is gain, egoistic value-strength is weakened by 0.2, and biospheric value-strength strengthened by the same amount (subject to the conditions that the sum of value-strengths remains constant, and none go below 0 – these apply to all value-strength adjustments). The rationale here is that people in a gain goal-frame already want to take measures that will reduce demand, in order to cut costs; reminding them that doing so is good for the environment should encourage them to self-identify as people who care about this. For households whose goal-frame is sustain, hedonic value-strength is weakened by 0.5, egoistic value-strength weakened by 0.3, and biospheric value-strength strengthened by the sum of these two amounts, 0.8. The rationale here is that for those already in a sustain goal-frame, reminding them of the importance of limiting demand will reinforce their biospheric self-identification, and in particular, discourage hedonism. In the “variable influence” (V) condition, in each time-step from 2016 onwards there is a 0.2 probability for a change five times greater than those that occur in the steady influence condition to occur.
For each of the 864 (2*2*2*2*2*3*3*3) conditions, 64 runs were performed, for a total of 55,296. The set was analysed, examining total, appliance, space-heating and water-heating energy demand, along with measures of liquid capital reserve and value-strengths, for the model years 2009, 2019, 2029, 2039 and 2049.
Results
It turned out that from model dates from 2019 onward, few of the distributions of the measures examined were anywhere near normality, other than those for water-heating energy demand, so ANOVAs could not be used with confidence. Along with descriptive statistics, Kruskal-Wallis tests were our primary statistical tool. Table 1 shows results for the eight dimensions of the parameter space explored, and seven of the eight measures taken, for model year 2049. The table shows the direction of differences in means, and the statistical significance of the Kruskal-Wallis tests, for each combination of parameter set dimension and outcome measure where the latter reached significance (water-heating energy demand is not included; no significant differences between conditions were expected given the parameters varied, nor found except for a single numerically very minor exception in model year 2009). It should be noted that the levels of statistical significance could presumably be raised if enough runs were performed, if indeed the differences are not the result of random (strictly speaking, pseudo-random) factors; but we can be more confident of this precisely when the p-values are smaller.
| Total Energy Use | Appliance Energy Use | Space-heating Energy Use | Liquid Capital | Biospheric Value Strength | Egoistic Value Strength | Hedonic Value Strength | |
| Biospheric boost | b4<b0 |
b4<b0 | |||||
| Triggers present | y<n |
n<y |
n<y |
y<n |
n<y |
n<y | |
| Capital required | m20<m15 |
m20<m15 |
m20<m15 |
m15<m20 | |||
| Appliance Regulation | YR<NR | ||||||
| Subsidies available | NS<YS | ||||||
| Income growth % | 0<2<4 |
0<2<4 |
4<2<0 |
0<2<4 | 2<0<4 | ||
| Fuel price growth % | 4<2<0 |
4<2<0 |
4<2<0 |
4<2<0 |
4<2<0 | ||
| External Influences | S<V<N |
V<S<N |
S<V<N |
N<S<V |
N<V<S |
S<V<N |
S<V<N |
We should perhaps place more importance on differences in numerical terms; the largest were associated with rates of income growth and fuel price growth, and with the presence or absence of external influences (all the differences between steady and variable external influence conditions shown were much smaller than those between either of these two conditions and the no external influences condition). For each dimension of the parameter space total energy demand in 2049, the means of each subset of runs, in kWh, are given below:
| Biospheric boost. | b4: 3509318; | b0: 3531526 | |
| Triggers | y: 3512188; | b0: n: 3528656 | |
| Minimum capital. | m20: 3514741; | m15: 3526102 | |
| Appliance regulation. | YR: 3520067; | NR: 3520777 | |
| Subsidies available. | NS: 3520239; | YS: 3520605 | |
| Income growth. | 0%: 3460304; | 2%: 3522643; | 4%: 3578319 |
| Fuel price growth. | 4%: 3403990; | 2%: 3524404; | 0%: 3632873 |
| External influence. | S: 3420798; | V: 3421262; | N: 3719206 |
It can be seen that by far the largest differences were due to the income growth, fuel price growth and external influences dimensions. Within-condition differences were in some cases considerably larger, depending on which values became dominant (see below); but the relatively small differences between conditions suggest that large reductions in energy demand will be hard to achieve – either steep rises in energy prices, some form of rationing, or radical changes in values are likely to be required. (Of course, greenhouse gas emissions can also be cut by a shift to low-carbon forms of energy production, but falls in demand are almost certainly needed as well.)
The non-normality of all distributions other than for water-heating energy demand increased over time, and by model year 2029 the distributions were clearly bimodal in most cases. This was most extreme for distributions of the value-strength measures, where all of a sample of 192 runs ended with two of the value-strengths at or very near zero. Clearly, the mechanisms of value-strength change described above produced a dynamic favouring the long-term dominance of one value within the agent population; and in many of the parameter settings used, which value came to dominate depended on the stochastically selected initial conditions.
Twelve parameter settings were selected for examination of the phenomena related to the instability of value-strengths. For each of the three possible values of the external influence parameter (N, S and V), the same four settings of the other parameters were examined. These four settings combined two settings of “household” parameters, and two of “environmental” parameters.
“Household” parameter settings of biospheric boost and triggers included, and minimum capital of 20 times quarterly income for non-essential appliance purchases were expected to lead to relatively low total energy demand; excluding biospheric boost and triggers, and setting the minimum capital requirement at 15 times quarterly income was expected to produce higher energy demand. “Environmental” settings of no regulation of inefficient appliances or subsidies, no income growth and fast (4%) fuel price growth were expected to result in relatively low total energy demand. “Environmental” settings of regulation of inefficient appliances applied, subsidies available, fast (4%) income growth and no fuel price growth were expected to result in higher total energy demand. (The regulation and subsidy settings were not in fact expected to have an effect, based on earlier results, but we wanted to use two sets of environmental settings that differed in every respect.) The four possible combinations are symbolised LL (household and environmental parameter settings expected to produce low total energy demand), LH (household parameter settings those expected to restrain demand, but environmental settings expected to push it up), HL (the converse of LH), and HH (all settings expected to produce relatively higher demand).
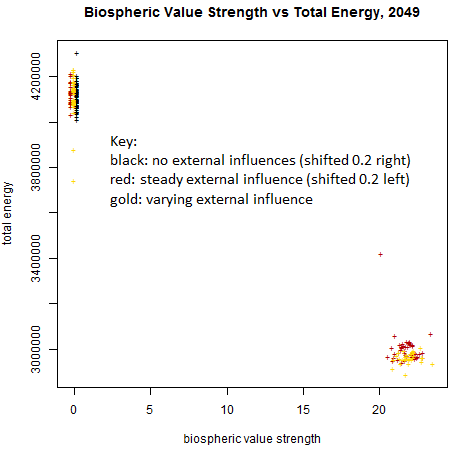
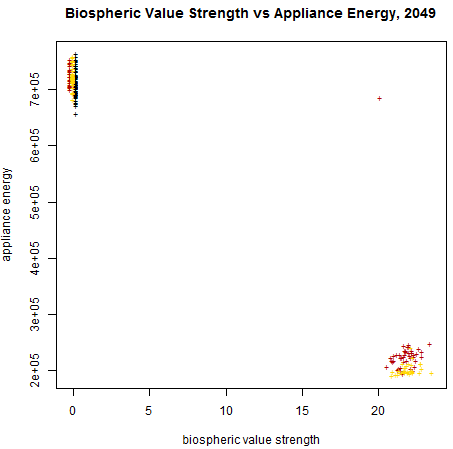
Examination of scatterplots for these 12 settings confirms that the *H (HH and LH) conditions produce higher total energy demand distributions than the *L (LL and HL) conditions, and the H* (HH and HL) conditions slightly higher total energy demand than the L* (LL and LH) conditions, as expected. (Each scatterplot plots two output measures against each other, for all the runs in one of the four sets of conditions above, with the external influence conditions distinguished by colour; two of the scatterplots are shown as Figures 4 and 5.)
This examination also indicates that biospheric value-strength is only ever high in model year 2049 if external influences are operating, although external influences do not guarantee that biospheric value-strength will be high. If it is, total, appliance and space-heating energy demand will almost always be relatively low, and liquid capital reserve high. Figure 4 plots biospheric value-strength (slightly shifted for clarity in two external influence conditions) against total energy demand for the LH runs.
It appears that external influence is necessary but not sufficient for low total energy demand, and there is some indication that the very lowest energy demand is found in runs where external influences are varying rather than steady, which invites further investigation with additional influence schedules. Figure 5 suggests that the difference is clearer in the scatterplot of LH biospheric value-strength against appliance energy demand (but appliance energy demand is generally a tenth or less of total demand).
Only with no external influence do runs end with high egoistic value-strength. In all the scatterplots of egoistic value-strength against measures of energy demand (other than for water-heating), and against liquid capital reserve, there is a distinct cluster containing runs with high egoistic value-strength and no external influence (although other runs without external influence produced low egoistic value-strength). Considering these no-external-influence high-egoistic clusters across the four sets of conditions HH, HL, LH and LL, as expected the absolute values of total energy demand are higher for the *H runs than the *L runs, but, unexpectedly, higher for the L* runs than for their H* counterparts; the relative position of these clusters is considerably higher in the scatterplots for the former. This phenomenon is exaggerated in the plot for egoistic value-strength against appliance energy demand. The explanation is presumably the role of triggers, which can shift a household’s goal-frame in either direction between gain and enjoy: the gain goal-frame restricts spending on non-essential appliances. When triggers are operating, the enjoy goal-frame may be adopted even when egoistic value-strength is high and hedonic value-strength low, and conversely, the gain goal-frame may be adopted even when egoistic value-strength is low and hedonic value-strength high. Comparing conditions that differ only in the presence or absence of triggers, the net effect appears to be that their operation reduces total energy demand in the *L runs when hedonic value-strength is high (whether or not external influences are also operating), but increases it in both *L and *H runs when egoistic value-strength is high and external influences are absent. The first of these effects seems to be due to a fall in space-heating energy demand, presumably because triggered switches from “enjoy” to “gain” encourage the installation of insulation; the second to an increase in appliance energy demand, presumably because triggered switches from “gain” to “enjoy” encourage the purchase of more appliances. Note, however, that it has not been possible to validate these complex interactions statistically, because of the very marked departures from normality in the distributions of results.
Discussion
No significant results in Table 1 are in the unexpected direction (there was no particular expectation for the effects of triggers). Additional statistically significant results from the Kruskal-Wallis tests might have been expected, particularly with regard to regulation of inefficient appliances and subsidies: the effect these had on the availability of appliances (regulation) and cost of new boilers (subsidies) were considerable, and each did affect the most obviously relevant measure, but in neither case was total energy demand significantly changed. In our model at least, economic conditions (rates of change of household income and fuel prices), and external influences on the strength of household values, produced much greater – but still not huge - effects.
The first of these findings echoes the GILDED quantitative survey results: household income was a far better predictor of energy use than expressed values. A qualitative study also carried out as part of GILDED (Fischer et al. 2011) indicated that most interviewees in five European countries were pessimistic in their assessment of others’ values, believing self-interest to predominate; and placed responsibility on governmental bodies to impose changes that would reduce emissions from household energy use:
“top-down approaches that restrained behaviour such as regulations, increased prices and educational campaigns organised by government to shape the behaviour of the younger generations were put forward.” (p.1033)
The authors comment that attributing selfishness to other people may function as an excuse for the respondents’ own reluctance to change their behaviour. The results of both surveys and the CEDSS-3.4 modelling suggest that greatly reducing domestic energy use may, in the absence of profound changes in household values, require more radical government action or technical change than we have attempted to model, such as carbon rationing (Li et al. 2015).
Other researchers have also found that income, and sociostructural factors such as number of people in the household (which we did not model) and house size (which we did) had a marked effect on energy demand, while expressed values had little or none (Kastner and Stern 2015; Vringer, Aalbers and Blok 2007). The latter suggest that the failure to translate values into pro-environmental behaviour may result from a perceived social dilemma: people may think energy savings they make will not have pro-environmental effects, because others will not do the same – a suggestion in line with the findings of Fischer et al. (2011). However, Vringer et al. (2007) did find that, unlike general value patterns, a specific motivation to save energy did correlate with lower energy use; and Thøgersen and Grønhøj (2010) found that reported energy-saving behaviours did in fact reduce demand, and that whether such behaviours were performed was most strongly predicted by their perceived difficulty. In work on the effect of policy interventions on domestic energy demand in the USA Dietz et al. (2009) suggest that interventions involving multiple policy tools (information and persuasive appeals via a range of channels, together with material incentives) might achieve up to a 20% reduction in CO2 emissions from domestic energy demand, without requiring households to spend significant amounts or make large lifestyle changes. These studies suggest that information and persuasion campaigns need to be specific – targeting energy use directly, and encouraging the belief that there are effective energy-saving measures individual households can take, and can expect enough others to take for the effort to be worthwhile. In the light of this, the “value-strengths” of CEDSS-3.4 might be better conceptualized not as strengths of the values themselves, but as coupling strengths between underlying values and domestic energy-related goals. The Figures provided by Dietz et al. (2009) on the behavioural plasticity of various behaviours – how malleable they are in response to the policy interventions – could be useful in future work with CEDSS, although it cannot be assumed they would simply transfer to a Scottish context. Among the changes they investigated, those relevant to CEDSS were “weatherization” (improved insulation), and a switch to more efficient household appliances (assuming this would occur as appliances required replacement). Together, it was estimated that these measures could save some 5% of emissions, and both were considered highly plastic.
The unstable value-strength dynamics reported above did not prevent differences due to the parameters we varied from manifesting themselves, although these were smaller than differences in energy demand between runs with the same parameters, but which ended with different dominant values, as seen in Figure 4 and 5. The model dynamics of value-strengths are not much constrained by either empirical data, or theoretical considerations. There appears to be no work within goal-framing theory dealing with how far people do influence each other in this regard. It is conceivable that such values are indeed highly unstable over decadal timescales, but the kind of instability demonstrated in the runs reported, involving a strong tendency for all households in a community to converge in their value-strengths, is at least questionable. If some households are highly (or even completely) resistant to influence by their social contacts, diversity is likely to persist. Implementing this in CEDSS-3.4 (which the code permits) might well produce a proportion of runs in which diversity of value-strengths remained much higher. Initial experiments give some support to this hypothesis. When households were assigned a random value from a uniform distribution between 0 and 0.2 for their value-strength adjustment parameter, as opposed to the universal value of 0.2 used in all the runs described above, departures from normality were considerably reduced, although not abolished altogether. A similar household-specific parameter might be introduced with regard to susceptibility to external influences (although the dependence of this influence on the current goal-frame, already implemented as described above, could be expected to have a somewhat similar effect).
While empirical work on the dynamics of value-strengths appears to be lacking, there is a body of energy studies work concerning peer effects on behaviour related to energy-saving. Studies indicate that such effects can reduce domestic energy demand, at least in the short term (Delmas and Lessem 2014; Jain et al. 2013). More directly relevant to CEDSS is work on peer effects on the adoption of insulation and other energy-saving technologies. In the USA, Noonan, Hsieh and Matisoff (2015) found a significant neighbour effect in the adoption of “zoned” heating and air-conditioning systems (systems that allow occupants to set different desired temperatures for different rooms in a dwelling); and Southwell and Murphy (2014), using survey data, found that self-reported social exchange of energy-related information was predictive of the adoption of insulation technologies. Most relevant to CEDSS, because the research was carried out in the UK and included the specific insulation technologies we modelled, McMichael and Shipworth (2013) found that among people in three communities across the UK, around 1/3 of those surveyed indicated that they would first approach someone they knew personally (rather than media or an organization) if they wanted information about domestic energy efficiency. This work does at least support the basic assumption of CEDSS-3.4 that both immediate social contacts, and sources outside the local community, are likely to influence the adoption of energy-saving technologies.
Within the social simulation area, Bale et al (2013) describe a model of the adoption of either solar panels or loft insulation, based on information gathered from a survey of households in Leeds, UK. These authors assumed that adoption of such technologies (assuming the household is able to do so) depends on the proportion of social contacts with whom they discuss such matters, who have already adopted. They remark on the difficulty of obtaining empirical data on the relevant social networks, and the number of assumptions they had to make (unlike CEDSS-3.4, the structure of the social network was not endogenised), but argue that their work demonstrates non-intuitive emergent effects that could usefully inform strategies for encouraging the adoption of energy-saving technologies. Their model indicated that network effects are stronger for the more visible technology (solar panels), while contrary to the modellers’ expectations, “seeding” the model with adopters at random gave results as good as clustering the initial adopters – apparently because there were few social links between the clusters, so once all those households able to adopt and close to the seeded households in the network had adopted, further spread was very slow.
Aside from Bale et al. (2013) the most closely related social simulation work we have encountered is in opinion dynamics. While “opinions” differ from “values”, there are recent studies that may offer insights relevant to the further exploration of value-strength and goal-frame dynamics in CEDSS-3.4. A range of alternative ways of “averaging” the opinions of a pair of agents are explored in Hegselmann and Krause (2005), while Meadows and Cliff (2012), argue that a few “extremists” (who might correspond to the resistant agents we suggest using above), can prevent an agent population converging on a single opinion. Similarly, Gargiulo and Mazzoni (2009), argue that extremists can prevent uniform convergence, but only if they both form clusters, and continue to interact with the rest of the population - conditions likely to be met in CEDSS-3.4.
Designing and constructing a social simulation model that can shed light on plausible developments in any area of human activity over the next several decades is a hugely difficult task. Inevitably, many assumptions, and simplifications are required and it can reasonably be assumed that there will be at least some factors that make a considerable difference to the outcome, that neither the modellers nor anyone else can currently envisage. In the area of domestic energy demand these could be technological, economic, demographic or cultural, to name the most obvious but not the only possibilities. Hence such models should be regarded not as predictive, but as aids to envisioning a range of possible futures, and deciding what kinds of information need to be acquired in order to assist long-term contingency planning.
In these terms, CEDSS3.4 can be judged a qualified success, insofar as it demonstrates the potential of agent-based modelling to draw attention to discomforting features of plausible futures, in this case the relatively small differences in energy demand at mid-century between conditions defined in terms of government policies to encourage energy-saving by offering subsidies and regulating appliance efficiency. The factors that made most difference were energy prices relative to income, and extra-community influences (governmental, media or NGO campaigns, and public opinion) on the values held by households. Energy prices are largely a result of global market conditions, and governments have both economic and political reasons for wanting to keep them down, but this will work against the aim of reducing energy demand; with regard to external influences on values, the assumptions we made concerning how much difference they could have on values and hence on behaviour may well be over-optimistic. Our work suggests that research on the most effective approaches should be prioritised. It is worth noting that considerable changes in public attitudes and behaviour, propelled in large part by governmental action, do happen, as in the cases of smoking, and combining alcohol and driving. In both these cases, government, media and other agencies were all involved, and legislation was combined with campaigns of both factual information and exhortation to adopt pro-social behaviours.
Turning to more specific aspects of CEDSS-3.4, it can be criticised either as too complex (providing a large number of parameters that can be varied), or as over-simplified: intra-household dynamics are ignored, some types of domestic energy demand are omitted – notably lighting and home computers, due to lack of the data necessary to include them; and although the model has provision for representing demographic change, this has not been used up to now. The questions of demography and intra-household dynamics are probably the most important simplifications: the age profile of a household’s members is likely to have significant effects on its equipment purchase decisions, and goal-framing theory is intended as a theory of individuals’ values and goals, although the goals and values themselves are socially shaped. However, our survey data did not cover intra-household dynamics, and the specifications of decision-making processes in goal-framing theory are sufficiently general to be plausibly applied at the household level. On the positive side, CEDSS-3.4 does include representation of important aspects of household values and economic decisions, social interactions within a local community, technical change, and policy options. It is difficult to envisage how any form of modelling other than agent-based simulation could integrate all these factors in a model able to shed light on which of them are likely to be most important over a period of decades.
Acknowledgements
This work was partly funded by the Scottish Government Rural Affairs and the Environment Portfolio, and the European Commission Seventh Framework Programme under grant agreement SSH-CT-2008-225383 (GILDED). The authors thank the anonymous referees who gave constructive criticism of both the SSC 2016 and the JASSS versions of the paper.References
BALE, C.S.E., McCullen, N.J., Foxon, T.J., Rucklidge, A.M. and Gale, W.F. (2013). Harnessing social networks for promoting adoption of energy technologies in the domestic sector. Energy Policy, 63, 833-844. [doi:10.1016/j.enpol.2013.09.033 ]
BANKS, J., Smith, Z. and Wakefield, M. (2002). The Distribution of Financial Wealth in the UK: Evidence from 2000 BHPS Data. London: The Institute for Fiscal Studies.
DELMAS, M.A. and Lessem, N. (2014). Saving power to conserve your reputation? The effectiveness of private versus public information. Journal of Environmental Economics and Management, 67, 353-370. [doi:10.1016/j.jeem.2013.12.009 ]
DEPARTMENT FOR BUSINESS, ENERGY AND INDUSTRIAL STRATEGY (United Kingdom) (2016). Energy: Chapter 1, Digest of United Kingdom Energy Statistics.
DEPARTMENT FOR BUSINESS, ENERGY AND INDUSTRIAL STRATEGY (United Kingdom) (2017). 2016 UK Provisional Greenhouse Gas Emissions One Page Summary. Archived at http://www.webcitation.org/6pclJ0UC7.
DIETZ, T., Gardner, T.J., Gilligan, J., Stern, P.C. and Vandenbergh, M.P. (2009). Household actions can provide a behavioral wedge to rapidly reduce US carbon emissions. Proceedings of the National Academy of Sciences, 106(44), 18452–18456. [doi:10.1073/pnas.0908738106 ]
FISCHER, A., Peters, V., Vávra, J., Neebe, M. and Megyesi, B. (2011). Energy use, climate change and folk psychology: Does sustainability have a chance? Results from a qualitative study in five European countries. Global Environmental Change, 21, 1025-1034. [doi:10.1016/j.gloenvcha.2011.04.008 ]
GARGIULO, F. and Mazzoni, A. (2009). Can extremism guarantee pluralism? Journal of Artificial Societies and Social Simulation, 11(4) 9: https://www.jasss.org/11/4/9.html.
GILDED (2012). http://gildedeu.hutton.ac.uk. Archived at: http://www.webcitation.org/6mEVX6vGg.
GOTTS, N.M., Polhill, J.G., Craig, T. and Galan-Diaz, C. (2014). Combining diverse data sources for CEDSS, an agent-based model of domestic energy demand, Structure and Dynamics: eJournal of Anthropological and Related Science, 7(1), 1-32: http://escholarship.org/uc/item/62x9p0w4.
GRIMM, V., Berger U., DeAngelis, D.L., Polhill, J.G., Giske, J. and Railsback, S.F. (2010). The ODD protocol: A review and first update. Ecological Modelling, 221, 2760-2768. [doi:10.1016/j.ecolmodel.2010.08.019 ]
HEGSELMANN, R. and Krause, U. (2005). Opinion dynamics driven by various ways of averaging. Computational Economics, 25, 381-405. [doi:10.1007/s10614-005-6296-3 ]
HORSFIELD, G. (2011). Family Spending: A Report of the 2010 Living Costs and Food Survey. London: United Kingdom Office for National Statistics.
IPCC (2013) Summary for policymakers. In Stocker, T.F., Qin, D., Plattner, G-K., Tignor, M., Allen, S.K., Boschung, J., Nauels, A., Xia, Y., Bex, V. and Midgley, P.M. (eds.) Climate Change 2013: The Physical Science Basis. Contribution of Working Group I to the Fifth Assessment Report of the Intergovernmental Panel on Climate Change. Cambridge University Press, Cambridge, United Kingdom and New York, NY, USA.
IPCC (2014) Summary for policymakers. In Edenhofer, O., Pichs-Madruga, R., Sokona, Y., Farahani, E., Kadner, S., Seyboth, K., Adler, A., Baum, I., Brunner, S., Eickemeier, P., Kriemann, B., Savolainen, J., Schlomer, S., von Stechow, C., Zwickel, T. and Minx, J.C. (eds.) Climate Change 2014: Mitigation of Climate Change. Contribution of Working Group III to the Fifth Assessment Report of the Intergovernmental Panel on Climate Change. Cambridge University Press, Cambridge, United Kingdom and New York, NY, USA.
JAIN, R.K., Gulbinas, R., Taylor, J.E. and Culligan, J. (2013). Can social influence drive energy savings? Detecting the impact of social influence on the energy consumption behavior of networked users exposed to normative eco-feedback. Energy and Buildings, 66, 119-127. [doi:10.1016/j.enbuild.2013.06.029 ]
KASTNER, I. and Stern, P.C. (2015). Examining the decision-making processes behind household energy investments: A review. Energy Research and Social Science, 10, 72-89. [doi:10.1016/j.erss.2015.07.008 ]
LI, J., Fan, J., Zhao, D. and Wang, S. (2015). Allowance price and distributional effects under a personal carbon trading scheme. Journal of Cleaner Production, 103, 319-329. [doi:10.1016/j.jclepro.2014.08.081 ]
LINDENBERG, S. and Steg, L. (2007). Normative, gain and hedonic goal frames guiding environmental behavior. Journal of Social Issues, 63(1), 117-137. [doi:10.1111/j.1540-4560.2007.00499.x ]
MCMICHAEL, M. and Shipworth, D. (2013). The value of social networks in the diffusion of energy-efficiency innovations in UK households. Energy Policy, 53, 159-168. [doi:10.1016/j.enpol.2012.10.039 ]
MEADOWS, M. and Cliff, D. (2012). Reexamining the relative agreement model of opinion dynamics. Journal of Artificial Societies and Social Simulation, 15(4), 4: https://www.jasss.org/15/4/4.html. [doi:10.18564/jasss.2083 ]
NOONAN, D.S., Hsieh, L-H.C. and Matisoff, D. (2015). Economic, sociological, and neighbor dimensions of energy efficiency adoption behaviors: Evidence from the U.S residential heating and air conditioning market, Energy Research and Social Science, 10, 102–113. [doi:10.1016/j.erss.2015.07.009 ]
PALMER, J. and Cooper, I. (2011). Great Britain's Housing Energy Fact File 2011. London: United Kingdom Department of Energy and Climate Change.
POLHILL, J.G. and Gotts, N.M. (2017). ‘How precise are the specifications of a psychological theory? Comparing implementations of Lindenberg and Steg’s goal-framing theory of everyday pro-environmental behaviour’. In Jager, W. et al. (eds.) Advances in Social Simulation 2015, Advances in Intelligent Systems and Computing, 528. [doi:10.1007/978-3-319-47253-9_31 ]
SOUTHWELL, B.G. and Murphy, J. (2014). Weatherization behavior and social context: The influences of factual knowledge and social interaction. Energy Research and Social Science, 2, 59-65. [doi:10.1016/j.erss.2014.03.019 ]
STEG, L., Bolderdijk, J. W., Keizer, K. and Perlavicute, G. (2014). An integrated framework for encouraging pro-environmental behaviour: The role of values, situational factors and goals. Journal of Environmental Psychology, 38, 104-115. [doi:10.1016/j.jenvp.2014.01.002 ]
STEG, L., Perlaviciute, E., van der Werff, E. and Lurvink, J. (2014). The significance of hedonic values for environmentally relevant attitudes, preferences, and actions. Environment and Behavior, 46(2), 163-192. [doi:10.1177/0013916512454730 ]
THØGERSEN, J. (2012). Pro-Environmental Spillover: Review of Research on the Different Pathways Through Which Performing One Pro-Environmental Behaviour Can Influence the Likelihood of Performing Another. Working Paper, BehaviourWorks Australia. http://www.behaviourworksaustralia.org/V2/wp-content/uploads/2015/10/Review-of-spillover-researchJohn-Th%C3%B8gersen.pdf. Archived at: http://www.webcitation.org/6mDWIM4SU.
THØGERSEN, J. and Grønhøj, A. (2010). Electricity saving in households – A social cognitive approach. Energy Policy, 38, 7732-7743. [doi:10.1016/j.enpol.2010.08.025 ]
VRINGER, K., Aalbers, T. and Blok, K. (2007). Household energy requirement and value patterns. Energy Policy, 35, 553-566. [doi:10.1016/j.enpol.2005.12.025 ]
WAECHTER, S., Sütterlin, B. and Siegrist, M. (2015). The misleading effect of energy efficiency information on perceived energy friendliness of electric goods. Journal of Cleaner Production, 93, 193-202. [doi:10.1016/j.jclepro.2015.01.011 ]
WILENSKY, U. (1999) NetLogo. https://ccl.northwestern.edu/netlogo/. Center for Connected Learning and Computer-Based Modeling, Northwestern University. Evanston, IL.