
Introduction
The success of an innovation does not only depend on its intrinsic properties, but also on its diffusion process (Griliches 1957; Mansfield 1961; Bass 1969; Davies 1979). The question of how innovations diffuse is among the core questions in economics, sociology, marketing, innovation studies, and even physics (Stoneman 2001; Rogers 2003; Valente 2005; Vega-Redondo 2007). The role of social networks in innovation diffusion has become a key question since innovations generally spread through social interactions (Banerjee et al. 2013). Hence, the structure of social networks in societies may bear important consequences for the rate of technological progress and economic growth (Fogli & Veldkamp 2014). Our work builds on these questions by analysing the welfare effects of social networks in new product diffusion. The accent on consumers' demand and welfare makes our analysis complementary to studies that focus on market strategies, such as Shao & Hu (2017).
Though innovations have complex effects on consumers' welfare, the speed and extent of diffusion are arguably the two dimensions of a diffusion process that are both universal and fundamental. These aspects are present in empirical marketing studies that focus on the role of contagion and word-of-mouth in the adoption of new products (Garber et al. 2004; Dover et al. 2012). If one assumes that any consumer adopting an innovation is improving its welfare, both a faster diffusion and a mode widespread diffusion automatically imply higher returns to society. The key question becomes how different network structures impact on the speed and extent of innovation diffusion. While the speed of diffusion has been extensively studied, the extent of diffusion remains under-studied. The reason for this lack of attention to the extent of diffusion relates to the common assumption that all consumers are willing to adopt any innovation. Following this assumption, diffusion will always reach its maximum extent in a connected network.
In our model, we assume that only a fraction of consumers is willing to adopt, depending on their preferences. In turn, preferences are expressed by individual reservation prices, and then the share of potential adopters depends inversely on the product price. Such a diffusion process can be modelled meaningfully as a percolation process (Solomon et al. 2000). The acceptance threshold of a node in the percolation model describes the idea of consumers' reservation price well. Starting from the generic assumption that consumers differ in their reservation prices, we showed that network structures supporting the speed of diffusion are not necessarily those that lead to a greater extent of diffusion and vice versa. In particular, we showed that small-world networks, which exhibit short path lengths and high clustering (Watts & Strogatz 1998), lead to fast but often only limited diffusion compared to fully random networks, which exhibit short path lengths and low clustering. The reason for limited diffusion in small-world networks is the redundancy in information spreading due to clustering. Accordingly, consumer welfare is much lower in small-world networks than in random networks for a wide ranges of prices.
Our main contributions are threefold. First, we introduce the standard percolation theory as it has already been applied before to the topic of innovation diffusion in social networks (Solomon et al. 2000; Hohnisch et al. 2008; Cantono & Silverberg 2009)[1], and translate the percolation model into an explicit welfare-theoretical framework in which the inefficiency of networks can be expressed by unfulfilled consumer surplus. In this framework, the network efficiency is indicated by the critical price below which diffusion becomes complete. Second, we show that for a standard linear demand curve with uniformly distributed reservation prices, the inefficiency of social networks is a function of its clustering: i.e., the higher the degree of clustering (“friends-of-friends-being-friends”), the less efficient a social network is in diffusing an innovation. Our finding that low clustering supports a wide diffusion therefore supplements the insight that a short average path length supports a fast diffusion (Watts & Strogatz 1998; Cowan & Jonard 2004). Third, the detrimental welfare effects of clustering, in turn, decline for less dispersed distributions of consumers’ preferences: as preferences become more alike, so does the critical price below which full diffusion occurs, for different network topologies.
The article is organised as follows. Section 2 studies the effects of percolation on innovation diffusion. Section 3 looks at percolation in small-world networks. Section 4 considers the time dimension of market diffusion. Section 5 addresses alternative demand curves, with a non-uniform distribution of consumers’ reservation prices. In Section 6, we extend our model to percolation in networks with a power law distribution of consumers’ connectivity (scale-free networks). Section 7 concludes.
Percolation and Demand
Let us consider a new product and a network of \(N\) potential consumers, where \(i\) and \(j\) are neighbours if there is a link \(\eta_{i,j}\) connecting them. Links are either existing (\(\eta_{i,j}=1\)) or absent (\(\eta_{i,j}=0\)), and do not depend on time. The diffusion process starts exogenously with a small number \(n<<N\) of initial adopters of the new product (seeds). Information about the innovative product is local (Huang et al. 2005): consumers who are not among the initial adopters, come to know about the new product only if a neighbour adopts.
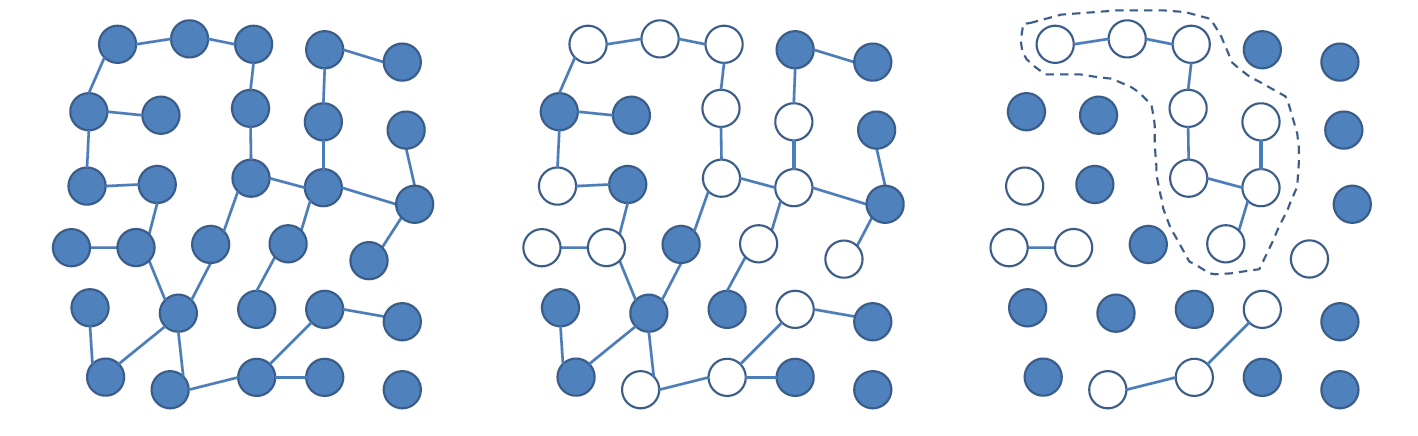
The adoption decision is based on the product's price \(p\), which is defined in the interval \([0,1]\), and which is assigned before diffusion starts. Consumers' preferences are expressed by a reservation price \(p_i\sim U[0,1]\): only consumers with \(p_i>p\) are willing-to buy (Figure 1, central panel). Consumers who do not adopt, do not pass on information to their neighbours, while consumers who adopt, pass on information to their neighbours. Hence, the network that truly matters for diffusion is the one that results from individual reservation prices. Drawing consumers reservation prices amounts to randomly switching ‘off’ nodes and their links (Figure 1, right panel). The resulting network of active nodes is called the operational network. Diffusion will have a sizeable extent only if a large (‘giant’) connected component exists in the operational network and at least one seed is part of this giant component.
What is important to notice is that drawing reservation price has a highly non-linear effect on diffusion. In the example of Figure 1 we have 30 consumers, and all but one happen to be connected initially (Figure 1, left panel). An innovation price p = 0.5 means that on average 50% of consumers are willing-to buy, that is 15 consumers. The unwilling-to-buy consumers are “removed”, and the resulting network is made of a number of connected components, the largest being formed by only eight consumers. In the best case, when we have an initial adopter who belongs to this component, diffusion size will be eight, which is just over half the potential diffusion size of 15 willing-to-buy consumers.
If all consumers are directly linked in a fully connected network (meaning that all consumers have \(N-1\) neighbours), all consumers are immediately informed once any seed adopts, and diffusion will always attain its maximum possible size. Assuming a uniform distribution of consumers' reservation prices, we obtain the standard downward-sloping linear demand curve. When \(p\) is the price of the innovative product, the probability that a consumer is willing-to-buy is \(q=1-p\), and the expected number of adopters is \(N(1-p)\).
It is the local nature of information diffusion in social networks that makes the actual adoption curve to depart from the standard linear demand curve. In particular, a sparse network structure introduces a phase transition, leaving many potential adopters uninformed at high prices. We illustrated this point by simulating the percolation model[2] for the case where 10,000 consumers form a Poisson random network (Erdös & Rényi 1960). The left panel of Figure 2 reports the final number of adopters for different values of the innovation price[3]. The percolation process is initiated by 10 seeds (n = 10)[4]. At low prices, the number of adopters follows the linear demand curve reflecting the uniform distribution of reservation prices. This amounts to full diffusion of the innovation, meaning that all consumers with a reservation price equal or above the product’s price, actually adopt the product. However, already at values as low as p = 0.4 the diffusion size starts to be lower than the number of consumers willing to adopt, and drops down to almost zero above p = 0.7. In these scenarios, diffusion is not full, because information of the product’s existence does not spread in the network. Put differently, the operational network is fragmented in many small components of consumers, without any links between these components. As we increase the price, an ever increasing share of consumers that would be willing-to-buy the innovation based on its price, do not actually buy it, because they do never get to know about its existence (Solomon et al. 2000).
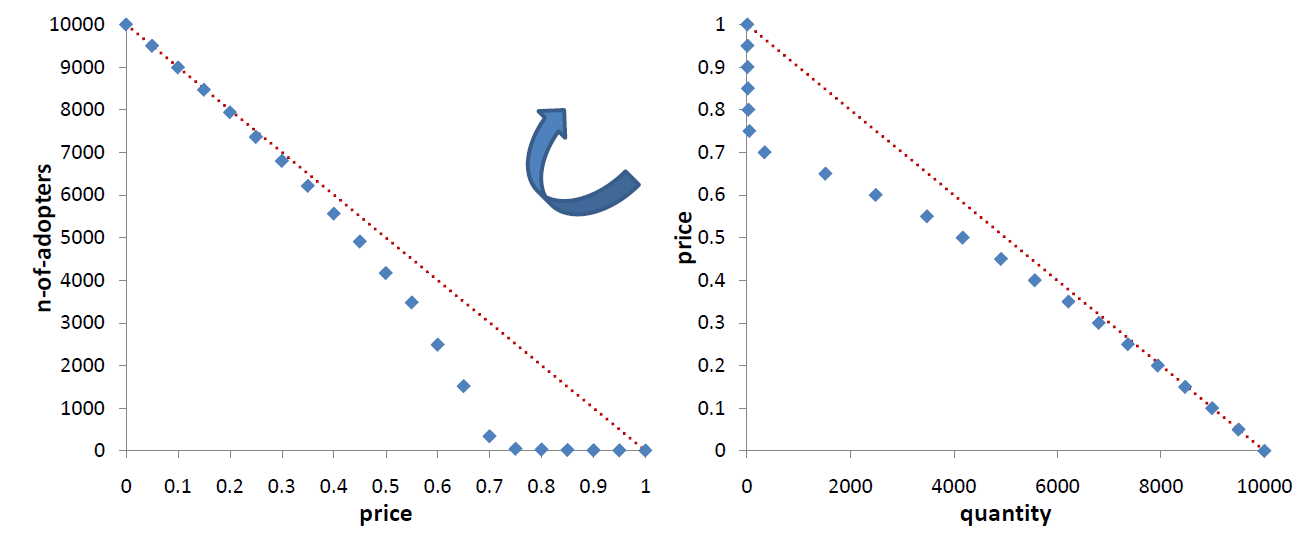
We can distinguish between two different regimes: a diffusion regime, where information spreads throughout the whole operational network, and diffusion is full or almost-full. A no-diffusion regime, where information does not spread, and diffusion is very limited leaving many potential buyers uninformed. By lowering the price, the consumers’ network undergoes what in physics is called a percolation phase transition (Stauffer & Aharony 1994). A critical threshold value of the price, \(p_{c}\), separates the two regimes (phases). This is the value that marks a fundamental change in the structure of the system, namely the value below which we see the appearance of a giant connected component of consumers that are willing-to-buy (see Figure 1. The size of the giant component is highly non-linear, with a sharp increase in size below the critical price \(p_{c}\) (the percolation threshold).
The percolation threshold is a mathematical property of a network, which can be computed, at least numerically. A powerful approach is based on Generating Functions, introduced by Newman et al. (2001) for the analysis of several characteristics of random networks. Callaway et al. (2000) apply this formalism to percolation. The case of a Poisson network allows us to evaluate analytically the percolation threshold. In the price space dimension of innovation diffusion and for a network of infinite size, the percolation threshold is given by
| $$p_{c}=\frac{\langle k\rangle-2}{\langle k\rangle-1}$$ | (1) |
The effects of social networks can be expressed in welfare-theoretical terms. Network inefficiency stems from “lost” consumers, that is, consumers who would have been willing to buy, but who are not informed by any neighbour about the product. That is, for relatively expensive products, a social network may not be able to convey the product's existence to all its members, and consequently not all consumers that would like to buy the product will buy it, because they are not informed. The group of consumers who, at price \(p\), are willing to buy but who do not adopt, we will refer to as lost consumers. By definition, a lost consumer has a reservation price in the range between 1 and \(p\). Hence, given the uniform distribution of reservation prices, the expected loss in consumer surplus of a lost consumer amounts to \((1-p)/2\). Accordingly, in the no-diffusion regime, the welfare loss amounts to \(N(1-p)\) lost consumers who miss out, on average, on \((1-p)/2\) surplus, amounting to
| $$\frac{1}{2}N(1-p)^2 \quad \text{for} \quad p > p_c.$$ | (2) |
Hence, for a given society with N members, the welfare loss due to network inefficiency is solely a function of the price. This implies that, in the following analysis of network inefficiencies, we can proceed by solely focusing on the critical price that separates the diffusion regime from the no-diffusion regime. That is, we can express the inefficiency of different network topologies by the critical price below which full diffusion occurs. The lower this critical price, the less efficient is the network in question.
Innovation Diffusion in a Small-World Network
One of the most popular models of social networks is the small-world model introduced by Watts & Strogatz (1998). Several empirical studies have identified small-world properties in real world social and physical networks[5], with possibly the most notorious one being the six degrees of separation: i.e., it takes on average six steps to reach any individual in the world (Travers & Milgram 1969). This fact is actually a manifestation of a well defined mathematical property, which is a relatively short average path-length. The small-world network model is constructed starting with a regular one-dimensional lattice, and introducing a rewiring probability \(\mu\) based on which any link can be re-wired. Figure 3 shows examples with \(N=50\) nodes and degree 4 (the total number of links is \(4\times50/2=100\)). In the middle panel there is a small-world network where eleven links have been rewired (the rewiring probability was \(\mu=0.1\)). The limit case \(\mu=1\) is a network where all links have been rewired (Figure 3, right panel), a procedure that leads to a fully random Poisson network of the type introduced by Erdös & Rényi (1960). In this network, the connectivity of nodes follows a Poisson distribution. Also Poisson networks are characterised by a relatively short average path-length with respect to other network structures and in particular with respect to the starting regular network of Figure 3, left panel. What makes small-world networks interesting is that they have a short average path-length, comparable with the one of a Poisson network, while preserving another character of the original lattice, which is a high level of clustering.
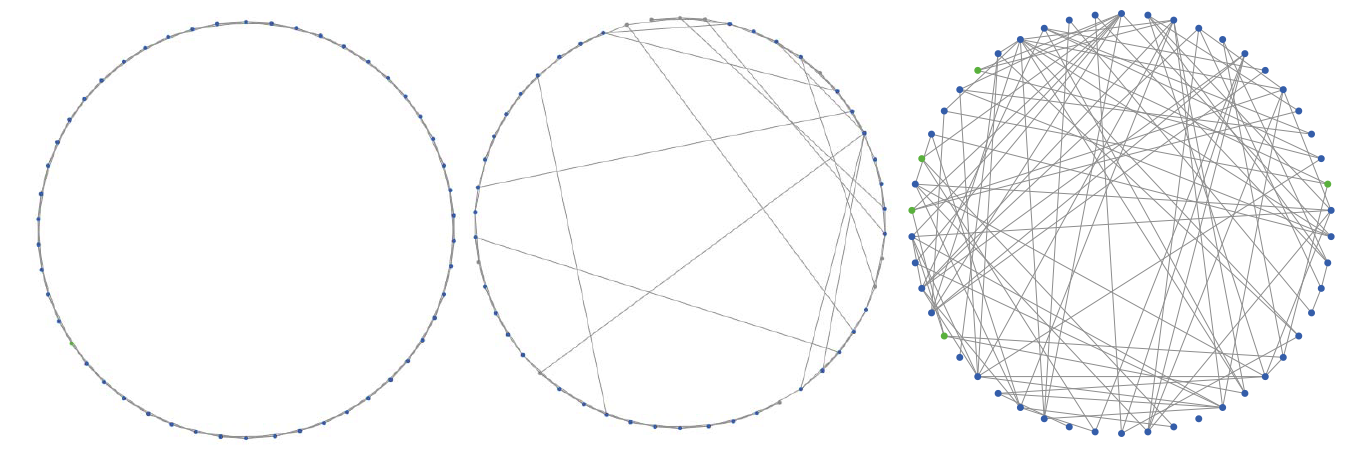
The clustering co-efficient measures the relative number of triplets out of all possible triplets in a network (Wasserman & Faust 1994). This fraction is particularly large in the regular network, where each node has two neighbours on each side, while it is almost zero in the Poisson network. By rewiring links at random, the average path-length drops suddenly for small values of the rewiring probability, while the clustering coefficient remains practically unaltered until one rewires a large portion of links. The typical small-world of Watts & Strogatz (1998) is obtained with as few as 1% of links rewired. Its average path-length is almost the same of a Poisson network, but the clustering coefficient is very large and comparable to the original regular network. It is important to notice that while the rewiring process strongly affects the degree distribution, the average degree remains unchanged, since the numbers of nodes and links are fixed[6].
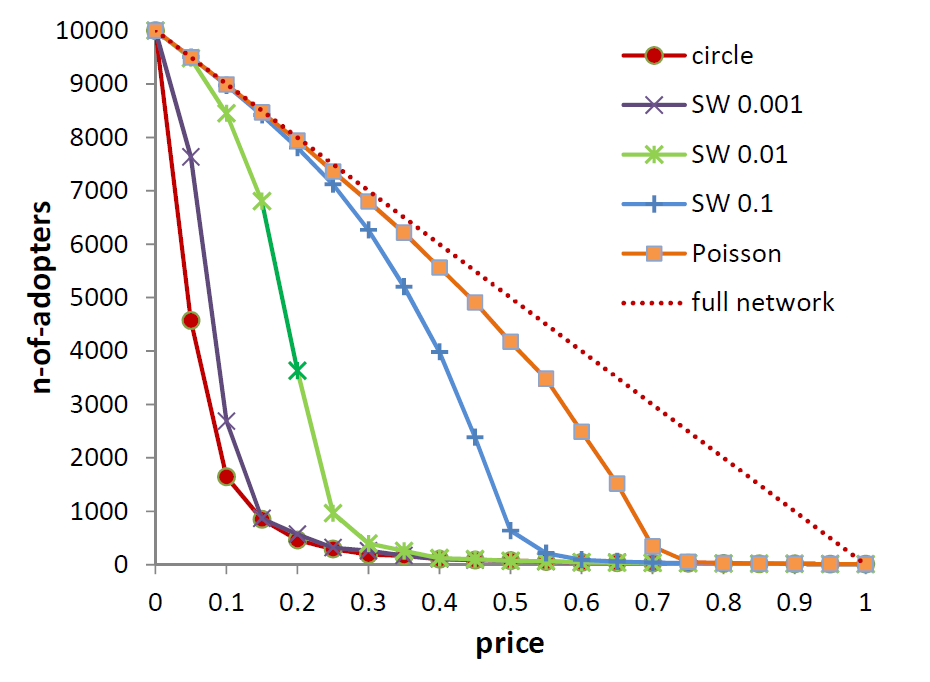
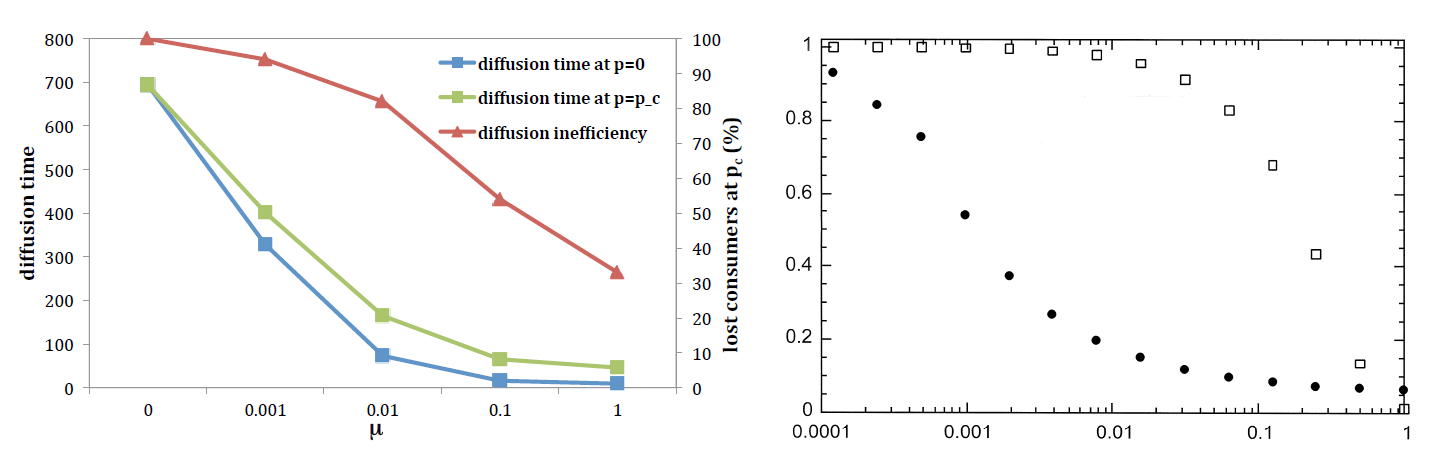
We have simulated percolation in a number of different small-world networks, namely for \(\mu=0.001\), \(\mu=0.01\) and \(\mu=0.1\). Figure 4 reports the results in terms of the final number of adopters as average values over 20 different simulation runs. We consider that a Poisson network represents the best scenario, with largest diffusion size at every price value. The percolation threshold in a small-world is much lower than in a Poisson network, and the non-diffusion regime is much larger. Hence, a much lower price is required for innovation to spread in a small-world network compared to a Poisson network. For a typical small-world with \(\mu=0.01\), the price threshold is between \(0.2\) and \(0.3\). In the limit case of a regular one-dimensional lattice, the critical price is lowest, between \(0.1\) and \(0.2\). The key conclusion here is that small-world networks are highly inefficient compared to Poisson random networks in percolating a new product over a social network of consumers.
The percolation threshold is defined as the critical value of nodes’ activation probability where a phase transition occurs in the size of connected components of active nodes, the so-called percolating cluster. Newman & Watts (1999) show how to evaluate implicitly the percolation threshold of small-world networks of infinite size. In the price space, the critical value pc satisfies the following equation:
| $$p_{c}^2=4\mu(1-p_{c}),$$ | (3) |
| \(\mu=0\) | \(\mu=0.001\) | \(\mu=0.01\) | \(\mu=0.1\) | \(\mu=1\) | |
| \(p_{c}\) | 0 | 0.06 | 0.18 | 0.46 | 0.67 |
| lost consumers | 100% | 94% | 82% | 54% | 33% |
The size of the percolating cluster depends on the connectivity distribution of a network. In particular, it depends on the ‘accessibility’ of a network, that is how many nodes one can reach starting from a given node, within a given distance \(r\) (the so-called volume of a ‘sphere’ of radius \(r\)). Due to the redundancy of links in a highly clustered network, the small-world presents relatively low accessibility (one needs to rewire a substantial number of links, starting from a regular network, before reaching the accessibility levels of Poisson networks).
Concluding, the diffusion size in a network depends on the size of the percolating cluster. This size undergoes a transition only at relatively low values of the price. In the price dimension of new products diffusion on a consumers’ network, the critical transition threshold of a small-world is much lower than the threshold for a fully random Poisson network. A given product price can fall into the no-diffusion regime of \(s\) small-world network, while still being in the diffusion regime of the Poisson network. This is the reason behind the relative inefficiency of small-worlds in terms of diffusion size. Small-world is very efficient in terms of speed of diffusion instead. But this depends on the average path length, as we explain in the following section.
The two extreme limits represented by the regular network and the Poisson random network can be given a societal interpretation. A regular network reflects a society that is “collectivist”, with all nodes having the exact same degree, and with a high clustering coefficient indicative of social cohesion. The fully random network however, corresponds to an “individualistic” society, with some nodes having higher degree than others and with a low clustering indicative of a lack of cohesion, but short distances. Real social networks may be closer to one or the other limit of the model (which makes the small-world model so relevant), depending of the specific case considered. For instance, some have associated lower income levels to more clustered networks inhibiting innovation diffusion (Fogli & Veldkamp 2014). An alternative and possibly complementary interpretation is to think of networks with high clustering as rural societies where most social ties are established within a village and networks with low clustering as urbanised societies where clustering is much lower.
Diffusion time
To some extent, the low level of network efficiency of small-worlds may come as a surprise. Indeed, small-worlds are generally considered very good diffusion vehicles, given their short path lengths. However, this assessment is based on the speed of diffusion and not on the extent of diffusion. Only in the unlikely case that everyone has a maximum reservation price, the operational network would coincide with the social network itself and full diffusion would always be realised. In such instances, the speed of diffusion remains the sole relevant performance criterion.
Following the standard downward-sloping demand curve, we assumed random reservation prices, in particular, uniformly distributed prices. In these instances, we can express network efficiency as the critical price below which full diffusion occurs. In this context, as reported by Figure 4, we observed a relatively low improvement of diffusion size when comparing a regular network to a small-world network. The typical small-world with re-wiring probability \(\mu=0.01\) (low average path length and high clustering coefficient) has a critical price which is only marginally larger than the regular network. Only for larger values of the rewiring probability, leading to lower levels of clustering, we find networks becoming more efficient. We can therefore claim that whenever diffusion is driven by a percolation mechanism, the important factor is a low clustering coefficient, not a short average path-length.
Here, by diffusion time we mean the time the diffusion process takes to stop. This is the time required to cover all connected components of the operational network that contain a seed. Figure 5 reports the diffusion time for various innovation prices obtained for the simulations already analysed in Figure 4. These results present the typical pattern of second order phase transitions, with a time peak at the percolation threshold. The latter is an unambiguous way to locate the critical price p = pc of the transition between the diffusion and no-diffusion regimes. The positions of the peaks, 0.05, 0.2, 0.45 and 0.65, are in agreement with theoretical values of Table 1. The diffusion time at p = 0 and p = pc from the simulations of Figure 5 are reported in Table 2. The critical price p = pc is a “worst condition” for diffusion time, where only one path connects several nodes in the network. Above the critical price, diffusion stops very quickly. On the contrary, p = 0 is a “best condition”, where all the network is accessible (apart from unconnected components without a seed).
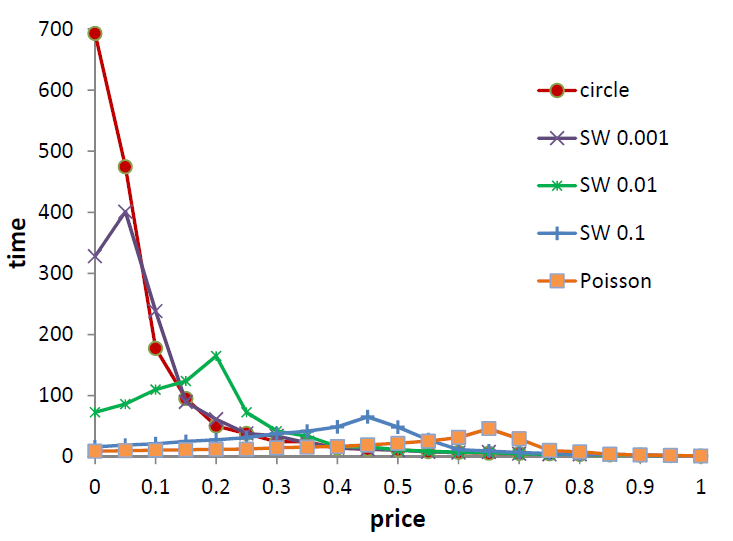
| diffusion time | \(\mu=0\) | \(\mu=0.001\) | \(\mu=0.01\) | \(\mu=0.1\) | \(\mu=1\) |
| \(p=0\) | 693 | 328 | 73 | 16 | 9 |
| \(p=p_{c}\) | 693 | 401 | 165 | 65 | 46 |
The regular network shows the longest diffusion time, and p = 0 is precisely the percolation threshold. The rewiring mechanism reduces distances in the network, and drives down diffusion time both at p = 0 and at the threshold. An important aspect to consider is how the diffusion time scales with rewiring. There are two regimes: for low rewiring probabilities, below \(\mu=0.01\), the diffusion time scales down fast. Near \(\mu=0.01\), the diffusion time is already relatively short, and further reductions from increasing the rewiring probability are negligible. In Figure 6 (left panel) we plot the diffusion time values of Table 2 together with the inefficiency measure of Table 1. The two patterns contrast with each other: the network inefficiency decreases little below \(\mu=0.01\), and drops fast beyond this value. Such different scaling patterns mean that diffusion size and diffusion time are driven by different factors. Figure 6 compares percolation results to structural properties of small-worlds networks such as the clustering coefficient and the average distance between nodes (Watts & Strogatz 1998). The similarity between the two sets of measures is evident. While diffusion inefficiency (a negative measure of diffusion size) correlates with clustering, diffusion time correlates with average path-length. For low values of \(\mu\) the average path-length decreases linearly as \(\frac{l}{N}=\frac{1}{4}-\frac{1}{2}\mu N+O(\mu^2)\). When \(\mu=0\) we have the average path-length of a regular network \(l=N/4\), while for large values of \(\mu\) the approximation above does not hold anymore, and we have \(l\simeq\log N\) instead, as in a Poisson network.
The diffusion time at \(p=0\) and \(p=p_{c}\) are linked to different network properties. At \(p=0\), the diffusion time scales with rewiring faster than diffusion time at \(p=p_{c}\) (Table 2). At \(p=0\), the operational network coincides with the full network, and many alternative paths are available to reach any node starting from the seeds of the percolation process. The diffusion time at \(p=0\) depends on the shortest one, and the lower the average path length, the lower the diffusion time. At \(p=p_c\), a different scenario obtains. The connected operational component is relatively large, but very often only one path connects distant parts of this network. The diameter of the giant component closely relates to diffusion time in this case, since it is the distance between the two nodes most far away.
Concluding, while diffusion time depends on the average path length of a network, the level of clustering is responsible for the extent of diffusion. Small-world network happen to be characterised by a relatively high clustering and low average path length. This is why they are relatively efficient in terms of speed of diffusion, but inefficient in terms of diffusion size.
Alternative Demand Curves
So far we have used a uniform distribution of reservation prices \(p_i\sim U[0,1]\) across consumers (nodes). Given the innovation price \(p\in[0,1]\), the uniform distribution gives a linear ''prior'' or ''potential'' demand \(D(p)=1-p\). In case of full information, the fraction \(1-p\) of consumers adopt the innovation, on average.
In general, for a distribution \(f[0,1]\) of reservation price values, the demand with full information is \(D(p)=N\times Prob (adoption)\), where
| $$\begin{eqnarray}Prob(adoption) & = & Prob[p_i>p]\\\nonumber & = & 1 - Prob[p_i<p]\\\nonumber & = & 1 - \int_0^p f(x)dx = 1 - F(p).\end{eqnarray}$$ | (4) |
Let us consider a Beta distribution of reservation price values, for which the probability density function reads as follows:
| $$f(p;\alpha,\beta)=\frac{1}{B(\alpha,\beta)}p^{\alpha-1}(1-p)^{\beta-1}, \quad p\in[0,1]$$ | (5) |
We run batch simulations with different demand curves for three different network structures, namely the regular one-dimensional lattice, a small-world with rewiring probability \(\mu=0.01\) and a Poisson random network. We first considered four cases with different mean value of the individual reservation price. The results reported in Figure 7 clearly show how the potential demand curve (i.e. the distribution of reservation prices) matters for innovation diffusion in a network of consumers. For a given network structure, different demand curves lead to different percolation thresholds. Consider for instance a Poisson network. This one has a percolation threshold \(p_{c}\simeq0.67\) with linear demand (Equation 1 and Figure 2). If we use a decreasing probability density function and the resulting convex demand of the example in the left panel of Figure 7 (case \(\alpha=1\), \(\beta=3\)), we obtain a much lower diffusion regime, with a percolation threshold between \(p=0.3\) and \(0.4\). An increasing distribution of reservation prices, with a concave demand (right panels of Figure 7) leads to a larger diffusion regime, instead, with a percolation threshold near to \(p=0.9\). Non-monotone probability distributions (middle panels of Figure 7) give an S-shaped potential demand, with a concave and a convex region. When consumers are embedded in a network and innovation diffuses as a percolation process, the larger the mode of the distribution, the larger the percolation threshold and the smaller the inefficiency effect of lost demand due to information transmission. These considerations also hold for both the regular network and the small-world: i.e., whenever the probability distribution of reservation prices puts more weight on lower values, the percolation threshold decreases, and the diffusion regime shrinks.
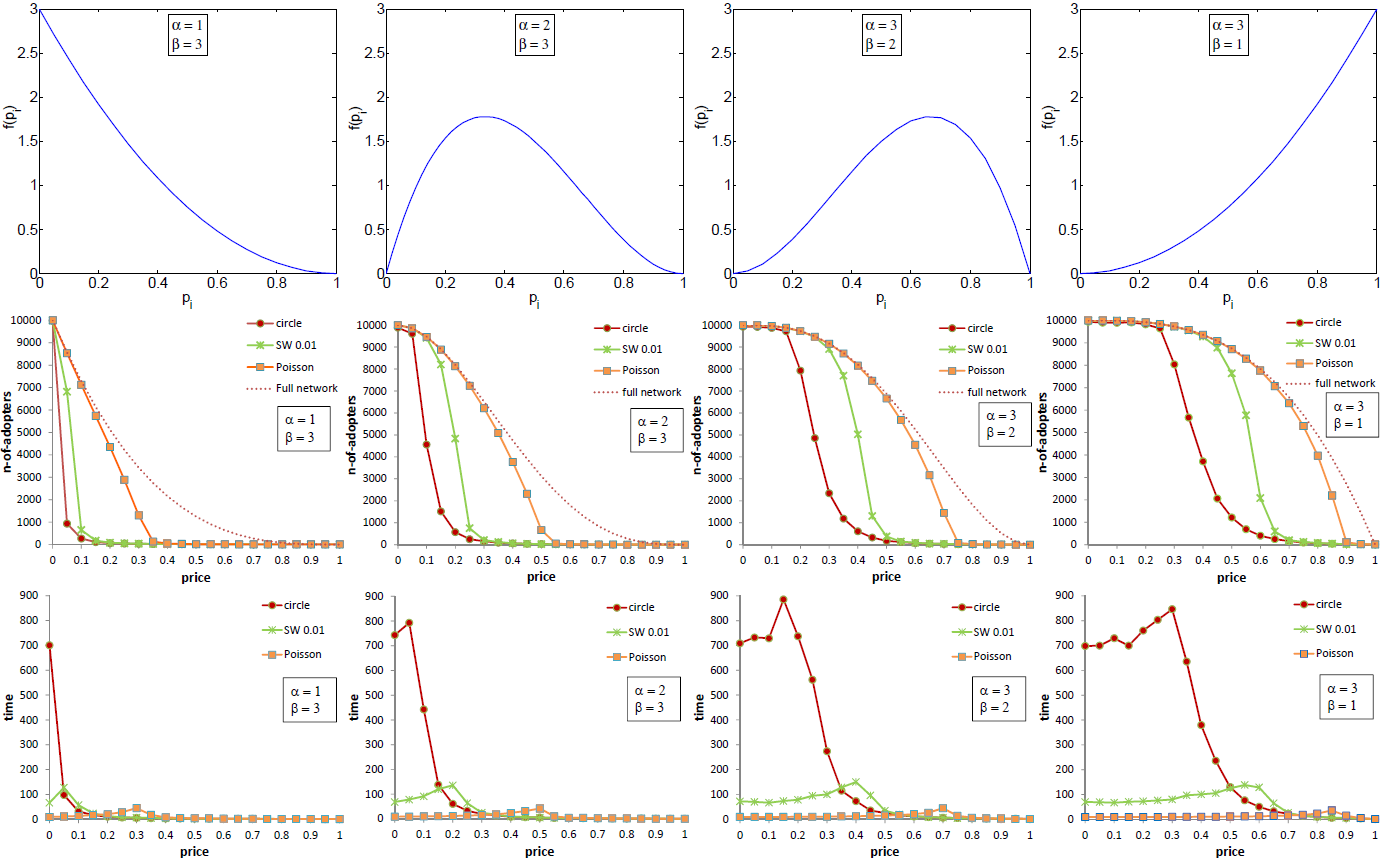
The information inefficiency and the loss in demand of a percolation process strongly depend on the reservation price distribution, and for a given distribution they depend on the consumer network structure. For the Poisson network, the more a distribution puts weight on large values of reservation prices, the smaller the inefficiency effect, and the less demand is lost (Figure 7, right panel). The more weight on low reservation price values, and the less efficient the diffusion process, with a larger loss of demand (Figure 7, left panel). For the regular network, the opposite is true. Whenever there is more weight on larger reservation prices, the realised demand increases, with a larger threshold, but not as much as for the Poisson network and the difference with the potential demand amplifies. This is because a larger mass of consumers with low reservation price produces many bottlenecks in the network, which reduce information efficiency and lead to a low diffusion regime. A larger mass of consumers with high reservation prices enlarges the connected component of the operational network. This effect is much stronger the higher the dimensionality of the network, when redundant links are rewired and used to open alternative routes that spread from the seeds of the diffusion process.
The percolation threshold gives an absolute measure of diffusion, i.e., the “fatter” the potential demand is, the larger the diffusion regime. The loss in demand is a relative measure instead, which tells about the efficiency of the network structure. When the potential demand gets “fatter” the Poisson network experiences a smaller loss of demand. However, inefficient network structures such as the regular network or the small-world network are less able to exploit this more favourable distribution of reservation price. If we think of the reservation price as a manifestation of consumers’ income, this means that in a more rich society, diffusion inefficiency due to the network structure is amplified.
The diffusion time is not affected by changes in the distribution of reservation prices, apart from the shift of the threshold peak (Figure 7, bottom panels). Both at \(p=0\) and \(p=p_{c}\) the diffusion time does not change much for different distributions. The results for the one-dimensional lattice are interesting. The percolation threshold shifts to the right with distributions that have more probability mass at larger values of price, but a peak for the diffusion time is missing, that is, the diffusion time remains long well below the threshold. The reason for this is that in a one-dimensional lattice there are only at most four alternative paths to cover the network and diffusion becomes a linear process. The larger is the distance to cover, the longer the time required, and diffusion time becomes proportional to diffusion size.
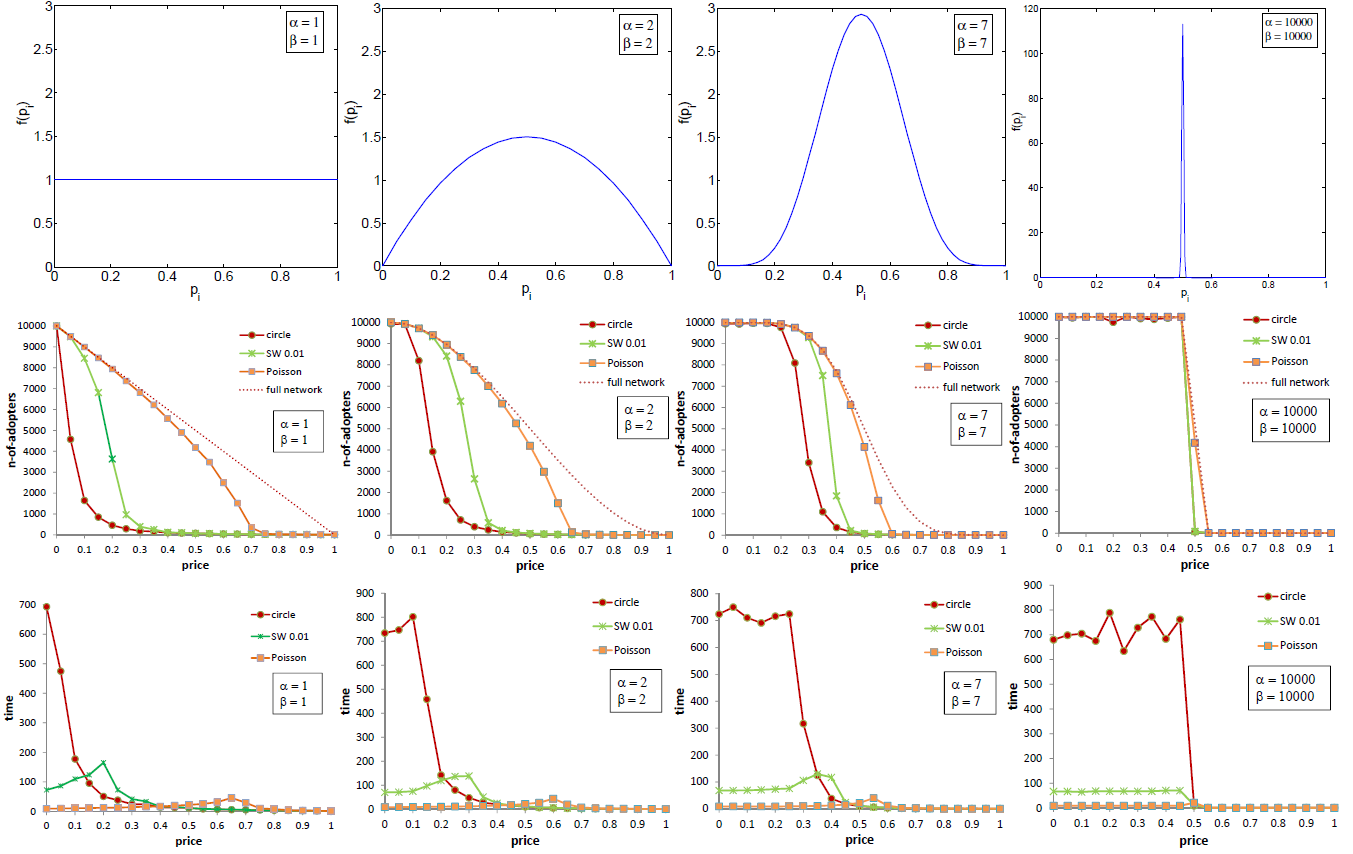
We have studied the effect of the dispersion of reservation prices by considering symmetric distributions with mean preserving spread (Figure 8). When distribution is less dispersed (and its peak more pronounced), meaning that consumers are more alike, the critical price of different network structures converges to the mean value of the distribution (\(p=0.5\)). Put differently, diverse network structures look more similar for their diffusion outcomes. When reservation prices are narrowly distributed, the mean becomes a critical value for the innovation price, above which almost all network nodes are shut down, and above which almost all of them are accessible. In the limit case of a homogeneous reservation price (\(\delta\)-Dirac distribution peaked at \(p=0.5\)), the demand curve is a step function, the mean reservation price becomes the critical price, and different networks present almost the same diffusion size. This is exactly the case with the example in the right panels of Figure 8. Irrespective of the network structure, there is a diffusion regime on \([0,0.5]\), and a no-diffusion regime on \([0.5,1]\). In this limit the percolation process is able to get the full potential demand for all network structures, with no lost demand from information inefficiency.
These results have obvious implications for consumers’ welfare. First, the convergence of different network structure towards a single reservation price results in a net gain of consumers’ surplus. Less efficient networks, such as the regular network and the small-world gain in terms of a higher critical price and a smaller loss of consumers with respect to the potential demand. However, even for the Poisson network, the effect of a smaller critical price is outweighed by a larger demand in the diffusion regime, with reduced loss of consumers.
Scale-Free Networks
When social networks are built on a digital online platform, they often have a ‘hub’ structure, which is not well described by small-worlds and Poisson random networks (Amaral et al. 2000). Few nodes, i.e., the hubs, have many links, while the majority of nodes have only few links. This feature reflects at a more fundamental scale the rich-get-richer formation dynamics of the World-Wide-Web, and the internet (Albert & Barabasi 2002). Empirical studies of new products adoption have enlightened the importance of social hubs for both the speed and the extent of the diffusion process (Goldenberg et al. 2009).
A network with a hubs structure is characterised by a power law distribution of the degree. A power law distribution is also called “scale-free”: for any value of the degree, the probability of occurrence of nodes with such degree “scales” down with the degree at the same rate. This means that if on average there are 10 nodes with 1000 links, we may expect to find 100 nodes with 100 links, 1000 nodes with 10 links, and so on[8].
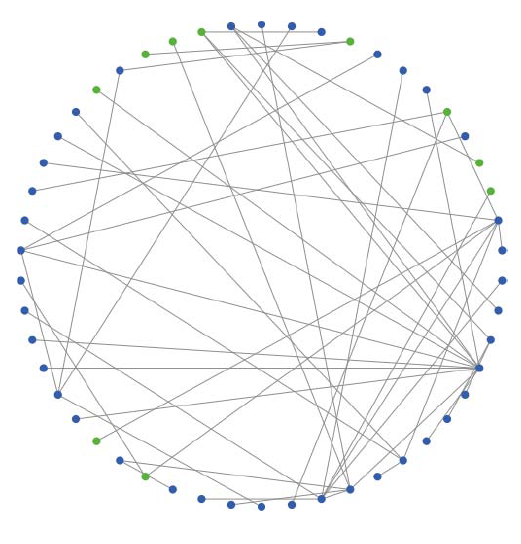
The scale-free network model introduced by Barabasi & Albert (1999) is essentially an algorithm to generate a graph with a power law degree distribution. The basic idea is a self-reinforcement mechanism of link creation, which builds on two factors, growth and preferential attachment. Figure 9 shows an example for a scale-free network of 50 nodes, generated with adding two links per every new node.
Figure 10 compares the diffusion size and diffusion time in a scale-free network with a small-world network and a Poisson random network, all with average degree \(\langle k \rangle=4\) = 4 links. The results in the left panel show that scale-free networks are relatively efficient in terms of diffusion size, and roughly match the demand pattern of consumers arranged in a Poisson network. This is in accordance with the low degree of clustering of both structures. The scale-free network gives a smoother transition between diffusion and no-diffusion regimes. Its critical price is larger than the Poisson network critical price, meaning that scale-free networks favour diffusion when the price is relatively high. The reason is that hubs are useful when the innovation price is relatively high, because whenever a hub adopts the innovation, it passes information to many neighbours, and very likely find some with reservation price high enough to adopt the innovation. However, when the price is relatively low, this advantage is less important, and the high-dimensionality of a Poisson network is slightly more beneficial to the diffusion size.
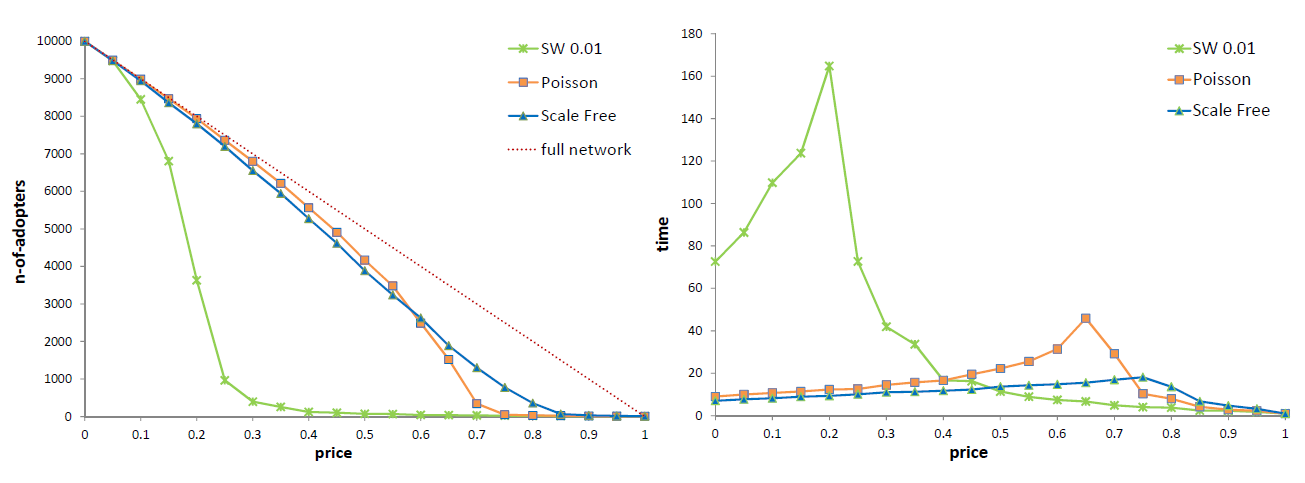
The time dimension of diffusion is also interesting as it shows that percolation processes in scale-free networks are relatively fast. On average, diffusion times in scale-free networks are lower than in Poisson networks and in small-world networks, both at the critical transition threshold and below it (Figure 10, right panel). In particular, a low diffusion time at the threshold reflects the smoothness of the critical transition of the diffusion size[9].
Concluding, scale-free networks do not depart much from Poisson networks in terms of their diffusion performance. The remarkably different network structure remains the small-world one. As long as innovation diffusion occurs following a percolation model, small-worlds happen to be much less efficient than both Poisson and scale-free networks regarding the diffusion size. The diffusion time is much longer in small-world networks than in Poisson and in scale-free network at relatively low innovation price values, but it becomes smaller at relatively high prices, when we move close to the percolation thresholds of the Poisson and of the scale-free networks.
Conclusions
A percolation model combines two important factors of innovation diffusion, that is, adoption decisions and information spreading. Percolation shows a phase transition from a diffusion to a no-diffusion regime (phase), for increasing prices. The phase transition indicates the critical price below which diffusion is almost complete. We showed that the critical price can be used as a measure of network efficiency, which depends on network topology and the distribution of reservation prices.
Percolation processes in innovation diffusion have two economic implications. First, they highlight an instance of network inefficiency: i.e., a sizeable portion of the demand is not satisfied in the no-diffusion phase regime. Second, percolation processes unfold differently in different network topologies. In particular, our results challenge common wisdom according to which small-worlds favour innovation diffusion. We showed that whenever diffusion works as a percolation process, small-worlds are rather inefficient, as diffusion size is driven by low clustering, and not by low average path-length of a network. We further showed that apart from low clustering, a less dispersed distribution of reservation prices across consumers favours diffusion, suggesting that not only richer, but also more equal societies, support new product diffusion.
Our key result on the effect of clustering on diffusion size are in line with empirical evidence on technology diffusion (Fogli & Veldkamp 2014), but against experimental evidence on behaviour diffusion (Centola 2010). Our percolation model offers a clear benchmark for the adoption mechanism. When innovation adoption is driven by individual preferences only and links between consumers carry only information, clustering has a negative effect. For behaviour spreading however, it is more likely that social pressures also play a role, in that individuals become more likely to adopt a behaviour if many neighbours already display the behaviour. An extension of the basic percolation model with a social-pressure function would indeed be a promising line for future research.
There are limitations to the present study, which can be possible directions for further research. First, our analysis of the welfare implications of social networks has been limited to the demand side, focusing on consumer surplus that is lost when the consumer remains unaware of a product which they would otherwise be willing to buy. Since, for monopolistic market structures, lower demand translates into lower prices, some of the welfare losses will be compensated by lower equilibrium prices. Campbell (2013) provides such an equilibrium model illustrating the latter effect, but without considering welfare effects due to the loss of consumer surplus (and restricted to random networks only). In future research, the percolation theory can be integrated in welfare analysis of markets, where equilibrium prices are derived, rather than treated as a parameter value. Furthermore, a game-theoretical extension can be envisaged following recent work on diffusion and imitation (Boyer & Jonard 2014).
Second, we assumed in our model that links of consumers networks are uncorrelated with reservation prices. Since the latter probably reflects consumer income, a more realistic description of the diffusion process would require us to relax this assumption, and consider some degree of assortativity in network structures, where neighbour consumers are more likely to have similar reservation prices. Assortative networks and income distribution are two key-factors in the study of the implications of percolation for innovation policy.
Third, in our framework social networks act solely as the medium for information diffusion, thus ignoring other possible effects of social interactions. For example, consumers may more probably become adopters due to local network externalities causing a consumer’s willingness to pay to increase with the number of adopters in their neighbourhood. Such a mechanism may render the percolation mechanism caused by word-of-mouth relatively less important (Birke & Swann 2010). Furthermore, a product’s price may fall over time due to technological progress and global network externalities such as learning-by-doing. These additional mechanisms will affect the extent to which a product diffuse in different networks, as shown in previous models (Delre et al. 2007, 2010). In particular, if an innovation improves over time, it may be strategically advantageous to wait for its adoption, and a slower diffusion process may enhance social welfare.
Indeed, the percolation model is first and foremost a theoretical model that applies to many social and natural contexts. It describes diffusion dynamics in networks driven by individual traits (here, reservation prices of consumers, disease resistance levels of plants, etc.), rather than an accurate description of various diffusion processes that exist in reality. As a null-model based on a single global parameter (here, price, virulence, etc.), some network topology and some distribution of individual traits, it is a useful benchmark in empirical studies of diffusion dynamics. To the extent that empirical data systematically deviate from the predictions of percolation concerning new product diffusion, additional mechanisms, such as the ones described above, should be included to better understand the exact nature of diffusion in specific technological, social and natural contexts.
Acknowledgements
We thank Luis Izquierdo and Fernando Vega-Redondo for their suggestions and comments. We acknowledge feedback from presentations of this article at the Centre of Networks and Collective Behaviour of the University of Bath (2015), the Workshop of Economics and Finance of Karlsruhe Institute of Technology (2015) the Lorentz Center workshops “Socio-Economic complexity” (2015) and “Econophysics and networks across scales” (2013) in Leiden, the UNU-MERIT of Maastricht University, the 5th Conference on Sustainability Transitions in Utrecht (2014), the Department of Economics of the University of Venice, the ECCS 2013 conference in Barcelona, the WEHIA 2013 workshop in Reykjavik, the 11th Workshop on Networks in Utrecht (2013), the 4th CompleNet Workshop in Berlin (2013), the College of Management of EPFL Lausanne, the LATSIS 2012 Symposium and the ABM-CTS 2012 conference at ETH, Zurich, and the Amsterdam School of Economics. Funding has been provided by the Netherlands Organisation for Scientific Research (NWO) under the Social Sciences Open Competition Scheme, no. 400-09-459.Notes
- A related application of percolation theory has been proposed to describe innovation dynamics in a technology space rather than a social network (Silverberg & Verspagen 2005)
- The simulation model, called “PercolationPrice”, is implemented in NetLogo. The code can be downloaded from the OpenABM database following the link: https://www.comses.net/codebases/5955/releases/1.2.0/.
- The results presented here are obtained from batch simulations experiments, by running the model a number of times for different values of the product price. The batch simulation experiment in NetLogo is set with the BehaviorSpace function.
- The exact diffusion size depends on the number of seeds, but the critical transition threshold does not. Simulations with 100 seeds yield the same patterns. Simulations with less than 10 seeds are less informative, since the variability of results is too large, with a standard deviation near 100%. The reason is that if no seeds fall in the giant connected component, no macroscopic diffusion takes place.
- A review of studies on the statistical properties of real-world networks is Albert & Barabasi (2002).
- The degree distribution of a Poisson random network is \(p(k)=\frac{1}{k}e^{-z}z^k\), where \(k\) is the degree, and the parameter \(z\) is the average degree. Each possible link has a probability \(q\) such that, given the total number of nodes \(N\), the average degree \(z=qN\) is constant (Vega-Redondo 2007).
- Equation 3 is Equation 30 of Newman & Watts (1999), and holds in the limit \(\mu<<1\). In particular it does not hold for the Poisson network (\(\mu=1\)). The critical price for the Poisson Network is given by Equation 1. The results in Newman & Watts (1999) are obtained with a slightly different model, where links are randomly added (not rewired). This modification of the Watts & Strogatz (1998) model is necessary to avoid that one node remains unconnected with positive probability, giving an infinite average path-length. The two models converge as \(\mu\rightarrow0\).
- Strictly speaking, this is the scaling property of the Zipf law. In general, power laws can present a scaling rate different from one.
- In a scale-free network with \(\langle k \rangle=2\), generated adding one link for a new node, the percolation threshold is \(p_c=0\), and the relationship between size and time of diffusion is monotone: a larger diffusion size requires a longer diffusion time. This is a consequence of the tree-like structure of this scale-free network, where there is only one path from a seed to any node.
References
ALBERT, R. & Barabasi, A. L. (2002). Statistical mechanics of complex networks. Reviews of Modern Physics, 74, 47–97. [doi:10.1103/RevModPhys.74.47]
AMARAL, L. A. N., Scala, A., Barthelemy, M. & Stanley, H. E. (2000). Classes of small-world networks. PNAS, 97(21), 11149–11152.
BANERJEE, A., Chandrasekhar, A., Duflo, E. & Jackson, M. (2013). The diffusion of microfinance. Science, 341, 363–370. [doi:10.1126/science.1236498]
BARABASI, A.-L. & Albert, R. (1999). Emergence of scaling in random networks. Science, 286, 509–512.
BASS, F. M. (1969). A new product growth for model consumer durables. Management Science, 15(5), 215–227. [doi:10.1287/mnsc.15.5.215]
BIRKE, D. & Swann, G. (2010). Network effects, network structure and consumer interaction in mobile telecommunications in Europe and Asia. Journal of Economic Behavior and Organization, 76(2), 153–167.
BOYER, T. & Jonard, N. (2014). Imitation and efficient contagion. Journal of Economic Behavior and Organization, 100, 20–32. [doi:10.1016/j.jebo.2014.01.009]
CALLAWAY, D., Newman, M., Strogatz, S. & Watts, D. (2000). Network robustness and fragility: percolation on random graphs. Physical Review Letters, 85, 5468–5471.
CAMPBELL, A. (2013). Word-of-mouth and percolation in social networks. American Economic Review, 103(6), 2466–2498. [doi:10.1257/aer.103.6.2466]
CANTONO, S. & Silverberg, G. (2009). A percolation model of eco-innovation diffusion: The relationship between diffusion, learning economies and subsidies. Technological Forecasting and Social Change, 76, 487–496.
CENTOLA, D. (2010). The spread of behavior in an online social network experiment. Science, 329, 1194–1197. [doi:10.1126/science.1185231]
COWAN, R. & Jonard, N. (2004). Network structure and the diffusion of knowledge. Journal of Economic Dynamics and Control, 28(8), 1557–1575.
DAVIES, S. (1979). Inter-firm diffusion of process innovations. European Economic Review, 12(4), 299–317. [doi:10.1016/0014-2921(79)90023-0]
DELRE, S., Jager, W., Bijmolt, T. & Janssen, M. (2010). Will it spread or not? The effects of social influences and network topology on innovation diffusion. Journal of Product Innovation Management, 27, 267–282.
DELRE, S., Jager, W. & Janssen, M. (2007). Diffusion dynamics in small-world networks with heterogeneous consumers. Computational and Mathematical Organization Theory, 13, 185–202. [doi:10.1007/s10588-006-9007-2]
DOVER, Y., Goldenberg, J. & Shapira, D. (2012). Network traces of penetration: uncovering degree distribution from adoption data. Marketing Science, 31, 689–712.
ERDÖS, P. & Rényi, A. (1960). On the evolution of random graphs. Publications of the Mathematical Institute of the Hungarian Academy of Sciences, 5, 17–61.
FOGLI, A. & Veldkamp, L. (2014). Germs, social networks and growth. Tech. Rep. DP10222, CEPR.
GARBER, T., Goldenberg, J., Libai, B. & Muller, E. (2004). From density to destiny: using spatial dimension of sales data for early prediction of new product success. Marketing Science, 23, 419–428. [doi:10.1287/mksc.1040.0051]
GOLDENBERG, J., Sangman, H., Lehmann, D. & Hong, J. W. (2009). The role of hubs in the adoption process. Journal of Marketing, 73, 1–13.
GRILICHES, Z. (1957). Hybrid corn: an exploration in the economics of technological change. Econometrica, 25(4), 501–522. [doi:10.2307/1905380]
HOHNISCH, M., Pittnauer, S. & Stauffer, D. (2008). A percolation-based model explaining delayed takeo in new-product diffusion. Industrial and Corporate Change, 17(5), 1001–1017.
HUANG, C., Sun, C. & Lin, H. (2005). Influence of local information on social simulations in small-world network models. Journal of Artificial Societies and Social Simulation, 8(4), 8: https://www.jasss.org/8/4/8.html.
MANSFIELD, E. (1961). Technical change and the rate of imitation. Econometrica, 29(4), 741–766.
NEWMAN, M., Strogatz, S. & Watts, D. (2001). Random graphs with arbitrary degree distributions and their applications. Physical Review E, 64(2), 1–17. [doi:10.1103/PhysRevE.64.026118]
NEWMAN, M. & Watts, D. (1999). Scaling and percolation in the small-world network model. Physical Review E, 60(6), 7332–7342.
ROGERS, E. (2003). Diffusion of Innovations. New York: Free Press.
SHAO, P. & Hu, P. (2017). Product diffusion using advance selling strategies: An online social network perspective. Journal of Artificial Societies and Social Simulation, 20(2), 2: https://www.jasss.org/20/2/2.html. [doi:10.18564/jasss.3207]
SILVERBERG, G. & Verspagen, B. (2005). A percolation model of innovation in complex technology spaces. Journal of Economic Dynamics and Control, 29(2), 225–244. [doi:10.1016/j.jedc.2003.05.005]
SOLOMON, S., Weisbuch, G., de Arcangelis, L., Jan, N. & Stauffer, D. (2000). Social Percolation Models. Physica A, 277, 239–247.
STAUFFER, D. & Aharony, A. (1994). Introduction to Percolation Theory. London: Taylor & Francis.
STONEMAN, P. (2001). The Economics of Technological Diffusion. Oxford: Basil Blackwell.
TRAVERS, J. & Milgram, S. (1969). An experimental study of the small World problem. Sociometry, 32(4), 425–443. [doi:10.2307/2786545]
VALENTE, T. (2005). 'Network models and methods for studying the diffusion of innovations.' In P. Carrington, J. Scott & S. Wasserman (Eds.), Models and Methods in Social Network Analysis, chap. 6, (pp. 98–116). Cambridge, USA: Cambridge University Press.
VEGA-REDONDO, F. (2007). Complex Social Networks. Cambridge, USA: Cambridge University Press. [doi:10.1017/CBO9780511804052]
WASSERMAN, S. & Faust, K. (1994). Social Network Analysis. Cambridge, USA: Cambridge University Press.
WATTS, D. J. & Strogatz, S. H. (1998). Collective dynamics of ‘small-world’ networks. Nature, 393, 440–442. [doi:10.1038/30918]