
Introduction
Insurance provides security to billions of people worldwide. It protects their homes, belongings and their livelihoods. Insurance organizes and pools risks. It requires individuals to come together, contribute premiums to a fund, and it compensates those who encounter unfortunate events such as fire, accident, theft and natural disasters. Insurance is therefore a critical part of the social fabric.
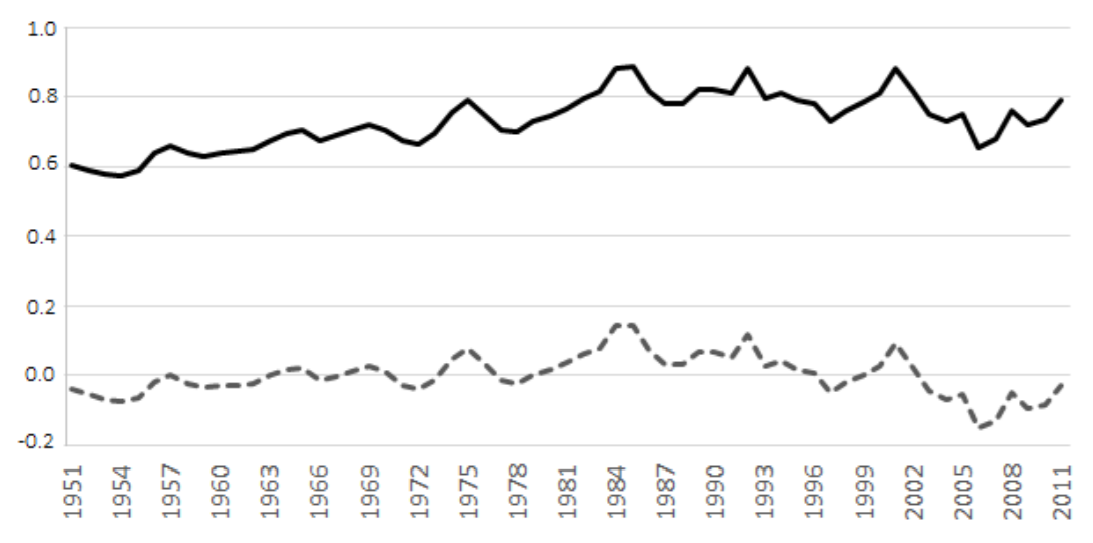
The property-casualty (or non-life) insurance industry around the world is known to experience regular cycles and periods of crises. These are poorly-understood phenomena. The cycles, known as underwriting cycles by insurance insiders, involve deep swings in prices and profitability which occur in more or less regular periods of 5-8 years (Harrington et al. 2014). These cycles appear to be independent of the general business or macroeconomic cycle. They are also visible on different insurance product lines and in different countries, but occur separately and over different time scales. A multi-year cyclical pattern is exhibited in Figure 1 which shows the loss ratio (ratio of total claims paid to total premiums earned) for the whole of the U.S. property-casualty insurance industry from 1951 to 2011.
Insurance is a trillion-dollar business and is vital to the health of the economy because it enables individuals and businesses to operate with a degree of insulation from unpredictable events. Underwriting cycles can be damaging because unexpectedly high premiums make insurance unaffordable to ordinary individuals, removing the financial protection that they require to conduct fulfilling and productive lives. Cycles also affect corporate clients and damage economically productive activity. The cycles also affect insurers themselves because low profitability, at some stages of the cycle, drives many insurers to insolvency, affecting both employees and insurance consumers.
Insurance crises occur when the troughs of the underwriting cycle are particularly deep. Prices vary over the course of the underwriting cycle, but the very availability of insurance becomes a sudden and pressing issue in an insurance crisis. Such crises have been reported regularly over the history of the insurance industry (Stewart et al. 1991). Inexplicably, the peaks and troughs of the cycles can sometimes be very deep. In the early 2000s, a severe contraction in the professional indemnity and medical malpractice insurance area in the U.S. occurred, with premiums for medical and other health professionals increasing by up to 60% within a year and leading to the withdrawal of some health services (Harrington et al. 2008). A particularly severe and widely publicized crisis happened in the mid-1980s in the U.S. liability insurance industry, when insurance premiums shot up by over 70% in a year (Winter 1988), even leading to the closure of many day care centres (Weiss 2007). After the 9/11 terror attacks, there was also a significant fall in the supply of commercial property insurance. Such events clearly have adverse socio-economic consequences.
Theories abound concerning the causes of underwriting cycles, but no single explanation has been satisfactorily provided. In this article, we consider explanations based on the psychology and behaviour of actors in the insurance industry. These explanations are grouped together under the label of 'behavioural hypotheses'. They emphasize the social interaction between individuals within insurance firms, between insurers across the insurance industry, and between insurers and customers. Without extensive survey data and statistics collected across a broad sample of insurance companies and over an extended period, it is difficult to test these theories fully. At the root of these hypotheses is the central premise that individual behaviour and social interaction at a local level can generate complex macro-level behaviour, such as cycles and crises. The purpose of this paper is to test this central premise.
The tool that we use to this end is an agent-based simulation model. Agents are insurers or customers within a particular segment of the insurance industry (property insurance in the United Kingdom). Customers and insurers are endowed with simple rules of behaviour, and are allowed to be heterogeneous. Interaction and interdependence of individual customers and insurers mean that the behaviour of the social system in which they participate is qualitatively different from simple individual-level behaviour. Complex behaviour, such as cycles and extreme events, can emerge endogenously (Axelrod 1997; Macal and North 2010).
Our main contribution to the literature is to provide evidence that simple behaviour by, and interaction between, heterogeneous individual agents in the insurance industry cannot be ruled out as a cause of complex systemic behaviour such as cycles and crises. In the next section, we review some of the theories about underwriting cycles and insurance crises, focusing on socio-anthropological and behavioural hypotheses. We then describe our model, the insurance industry data which we use, the estimation of various model parameters, and validation of the model, before discussing our main results.
Background and Motivation
The insurance industry
It helps at the outset to describe some of the key roles in an insurance firm. Underwriters estimate customers' potential claims (losses) and decide whether to sell policies to them and at what price. Actuaries collect claim (loss) statistics and use this to calculate premium rates for different classes of policyholders. Insurance prices are determined by underwriters based on market conditions and the premium rates established by actuaries. Loss adjusters (claims adjusters) decide the value of claims when these are made by customers. Note that customers may be individual or corporate policyholders. There are also many operations managers in insurance firms, particularly in Information Technology: they have become very influential with the development of technologies such as insurance aggregator websites, telematics, and machine learning using `Big Data'.
There are several theories concerning the formation of cycles and the occurrence of crises in the insurance industry, but none of these theories is accepted as a perfect explanation for these phenomena. In particular, it remains difficult to forecast the occurrence, and manage the financial impact, of cycles and crises. A theory that was formulated early on is that variation in interest rates can explain variation in insurance prices (Doherty and Kang 1988)[1]. Other early hypotheses about underwriting cycles are that irrational forecasting errors about insurance losses are made by actuaries because they extrapolate from past data (Venezian 1985), and that institutional delays in accounting or regulation trigger oscillatory behaviour through a form of lagged feedback (Cummins and Outreville 1987). These explanations have not been borne out by the data (Harrington et al. 2014).
Two other competing explanations are posited nowadays. The first is that a large and unexpected industry-wide loss, such as a devastating earthquake in an industrialized society, catches insurers by surprise causing them collectively to push prices up in a bid to avoid insolvency (Winter, 1994; Gron, 1994). This does not adequately explain the sustained down-swing in prices, however. The second hypothesis is that insurers are heterogeneous in terms of the quality of their management and forecasting ability (Harrington and Danzon 1994; Harrington et al. 2008). The worst insurers, often new and inexperienced entrants to the industry, aggressively seek market share, offering low premiums to attract customers, leading to a ‘‘price war'' with more established insurers. This explains the down-swing in prices and profitability, but not the up-swing of the cycle.
Behavioural and socio-anthropological explanations for cycles and crises
The behavioural and socio-anthropological explanations for underwriting cycles that we consider in this article are most clearly articulated by Fitzpatrick (2004), an insurance lawyer, and by the actuaries Feldblum (2001), Ingram and Underwood (2010), Ingram et al. (2012) and Ingram and Bush (2013). These insurance professionals describe a rich social tapestry of interactions among the participants in the insurance industry.
More recently, Kunreuther et al. (2013), Ligon and Thistle (2007) and Boyer et al. (2013), have supplied evidence and devised models to test these behavioural hypotheses. They base their views on the sub-discipline of behavioural economics which recognizes that economic agents are not fully rational. There is anecdotal evidence that these behavioural explanations are garnering support and seem to be the composite view of many insiders in the insurance industry such as at the influential specialist insurance marketplace Lloyd's of London (Lloyd's 2010) and in regulatory bodies like the UK Financial Conduct Authority (Erta et al. 2013).
Fear, conservatism and overconfidence
Fitzpatrick (2004) regards fear as a key emotion which drives the behaviour of individuals in the insurance industry, and consequently drives underwriting cycles. (For more about fear as an emotion, see Tudor 2003). Underwriters are remunerated by the amount of business that they generate. They therefore compare themselves to their peers across the industry. Their fear that they will lose their job or promotion to someone else will dictate sales and premium growth in the insurance business. This is complicated by the short-term incentives which dominate in insurance and the ability of underwriters to move to other insurance firms well before the impact of any mispricing becomes apparent.
Fear is also one of the major drivers of financial markets, as behavioural economists have pointed out. Kunreuther et al. (2013) detail a number of ways in which individuals working for insurers can be irrational and emotion-driven, exhibiting behavioural biases and using heuristics (rules of thumb). Classical economics assumes that insurance firms, like other firms in the economy, merely maximize expected profits. However, both Mayers and Smith (1990) and Greenwald and Stiglitz (1990) have argued that managers within these firms are essentially risk-averse individuals who are fearful of insolvency and of the consequential costs to their careers of failure of their firms[2].
Kunreuther et al. (2013, 151) go further and provide evidence that insurance managers are not just risk-averse, but they are also ambiguity-averse. Ambiguity aversion means that, when underwriters determine a premium, they focus first on the statistics-based rates handed down to them by actuaries, but then worry about ''unknown unknowns'' and either increase premiums in a potentially irrational way, deepening the underwriting cycle, or they refuse insurance coverage outright, engendering an insurance crisis. This can happen particularly in the aftermath of a catastrophic loss. Kunreuther et al. (2013, p.174) give explicit examples such as in the pricing of insurance after Hurricane Andrew in 1992 in the USA. Like Fitzpatrick (2004), Kunreuther et al. (2013) also point out that underwriters are concerned with their employment if their firms are severely affected by a large loss, which further contributes to their ambiguity aversion.
Several researchers point out that insurance underwriters are susceptible to periodic bouts of bullishness and bearishness, which are crowd phenomena. Feldblum (2001) refers to the "mass psychology" of underwriters, who swing between optimism in profitable years and pessimism in loss-making years. This can not only exacerbate, but also create, cycles in the insurance industry. Boyer et al. (2013) make this theme even more explicit, comparing underwriters to stock market traders. They believe that underwriters go through phases of bearishness where they under-react to a favourable insurance claims experience because of a conservatism bias, and then phases of bullishness where they over-react because of the representativeness heuristic (Tversky and Kahneman 1974). They show that this can trigger cycles in the same way that the stock market can go through boom and bust. Ligon and Thistle (2007) also believe that insurance managers can exhibit overconfidence in their estimates of insurance losses, and claim that this can create cycles in the industry.
Social Interaction and Interdependence
One of the key observations of Feldblum (2001) concerns the interaction of individuals within firms, the interdependence of insurers in the industry, and also the interaction with customers. He asserts that individuals at the helm of these firms engage in "conjectural variation", whereby they are constantly second-guessing how their peers in the industry will react in terms of pricing, if they themselves adjust their prices up or down. Conjectural variation means that insurers are not merely price-takers. This deviates from the assumption of a perfectly competitive insurance industry conventionally made in economic models. Feldblum (2001) claims that there are hidden barriers to entry into the insurance industry for individual professionals and their insurance firms, and that success involves a learning curve, experienced underwriting and knowledge of customers. Successful insurance professionals know how to exploit the inertia of customer demand: customers do not react merely to price and will not switch to another insurer as readily as the perfect competition ideal assumes.
Furthermore, insurance industry executives react to each other, and sometimes exhibit herd behaviour. An example given by Feldblum (2001) is how, in a situation where price wars have resulted in persistently unprofitable price cuts, executives will eventually decry this in trade magazines and conferences. This signals to the whole industry that rising rates may now be contemplated. It may take just a few market leaders, whose rates are well-publicized and against which everyone else compares themselves, to raise prices, and every other insurer then follows suit, confident that their competition are also raising prices.
Fitzpatrick (2004) suggests another way in which social interaction within the insurance industry surfaces in the form of cycles: there is a continuous shift of bureaucratic power in an insurance company. Underwriters have the upper hand in profitable times and they push prices down to maximize sales. Claims adjusters and actuaries are more powerful at times when the insurer is in financial distress; they vie to raise prices to restore profitability. This "ebb and flow of bureaucratic influence" (Fitzpatrick 2004) among the different departments within an insurance company means that different individuals come to the fore at different times, when they exercise maximal influence over management decisions. Insurance companies are ultimately composed of individuals and their judgment affects pricing decisions and this itself drives the cycles on insurance markets.
Plural rationalities
Ingram and Underwood (2010), Ingram et al. (2012) and Ingram and Bush (2013) extend this argument in a significant way by proposing that the Cultural Theory of Risk can explain underwriting cycles in the insurance industry. The Cultural Theory, also known as Theory of Plural Rationalities, originates from the work of Mary Douglas in social anthropology; see Douglas and Wildavsky (1982) and Thompson et al. (1990). Many industry insiders have been receptive to this idea, notably at Lloyd's of London (Lloyd's, 2010). Rather than the purely rational individual of classical economics, or the plethora of (sometimes contradictory) biases of behavioural economics, this theory postulates that there are four types of individuals, based on attitude to risk. Ingram and Underwood (2010), Ingram et al. (2012) and Ingram and Bush (2013) map these attitudes to insurance functions. Underwriters are `individualists': they are risk-taking profit-maximizers. Claims adjusters are `egalitarians': they are risk-averse conservators. Actuaries are 'authoritarians': they are prudent risk managers. Other operations managers (for example in IT departments) are 'fatalists': they are pragmatists.
According to Ingram and Underwood (2010) and Ingram and Bush (2013), when profits are high, profit-maximizers (underwriters) are influential and they relax underwriting standards to compete for customers and maximize sales (and their own remuneration). When profits fall and the firm is distressed, conservators (claims adjusters) take over and require stricter underwriting standards. Eventually risk managers (actuaries) gain more say as they help the company restore its finances. At various points, the pragmatists help out, making alliances to enable the company to keep operating. Eventually, profitability is restored, memory fades, and the profit-maximizers take over again, repeating the cycle. Like Fitzpatrick (2004), Ingram and Underwood (2010) contend that the interaction between the different groups in the insurance firm - the to-ing and fro-ing of power - is mirrored across many insurance companies, and that this drives cycles throughout the insurance industry.
Methodology and Data
The various behavioural hypotheses for cycles and crises in the insurance industry, as set out in the preceding section, are difficult to test for a number of reasons. First, and most obviously, this requires a large amount of field and survey data collected at several insurance companies and over a long period of time. The cycles appear distinct from one product line to another, which means that longitudinal data would be required about different individuals working on different products in different companies. Cycles appear to have a period of 5-8 years, so one would require data over decades before amassing enough evidence, by which time structural and technological changes in the industry would likely make the earlier data redundant. Second, the theory involves variables which are difficult to measure, whether quantitatively or qualitatively: the strength of networks, social influence, fear, power within and among groups, all of which must be estimated both inside an insurance company and across the industry. Third, the behavioural explanations involves multiple strands, such as shifting bureaucratic power and conjectural variation, and distinguishing between these is difficult. Finally, such a test would in fact be a joint test of the behavioural hypotheses of insurance cycles with one or more other theories, such as the socio-anthropological theory of plural rationalities or the behavioural economic theory of ambiguity aversion.
We propose instead to test a counter-proposition, namely that simple individual behaviour by insurers cannot propagate and emerge as complex cyclical collective behaviour across the industry. The behavioural and socio-anthropological hypotheses of Fitzpatrick (2004), Feldblum (2001), Ingram and Bush (2013), Kunreuther et al. (2013) and Boyer et al. (2013), as described in Sections 2.13-2.15, all implicitly assume that the behavioural biases that they ascribe to individuals in the insurance market will not cancel out on average, but will emerge instead as complex cyclical collective behaviour. If simple behaviour of individuals at the level of the firm does not result in industry-wide cycles and crises, then this negates a central premise of the behavioural hypotheses: there is no transmission mechanism whereby cycles can occur across the industry because of firm-level behaviour. Of course, the converse is not true. That is, if the agent-based simulation model exhibits cycles, this does not prove conclusively that individual or firm behaviour is the cause (or indeed the sole cause) of insurance cycles and crises.
Agent-based simulation modelling is an ideal tool to investigate this. Crucially, agent-based models afford interaction of agents within a social space and enable global behaviour to emerge which cannot be anticipated from the interaction of these individuals. They can capture the kind of interdependence and mass psychology postulated by Feldblum (2001), the behaviour of crowds implicit in much of behavioural economics (Kunreuther et al. 2013), and the interaction of roles and risk types described by Fitzpatrick (2004) and Ingram and Bush (2013). Furthermore, agent-based models allow for heterogeneity, unlike classical models of insurance economics. The plurality of risk attitudes and the diversity of roles which may dominate organizations require heterogeneity. The "winner's curse" explanation developed by Harrington and Danzon (1994) and Harrington et al. (2008), and espoused by Feldblum (2001), also demands that insurers be heterogeneous.
Our use of an agent-based simulation model to investigate the insurance industry is given greater credibility by the fact that insurance analysts have themselves shown considerable interest recently in the agent-based modelling philosophy (Palin et al. 2008; Mills, 2010; Carter, 2011; Parodi, 2012). An example is Ingram et al. (2012) who construct a toy model, the "Surprise Game", which implements a simple version of the Theory of Plural Rationalities described by Ingram and Underwood (2010) and Ingram and Bush (2013). There are 30 insurers who are agents and who choose, at each time step, one of the four risk attitudes, in response to what the other insurers do, in a bid to survive and prosper. This simple model is not designed to investigate complex behaviour such as cycles, but it does serve the purpose of showing that agent-based bottom-up artificial-society modelling can afford a richer and more realistic set of economic behaviours in the insurance industry than classical insurance economic models. In particular, their model is not estimated and validated on data and serves only as an illustration.
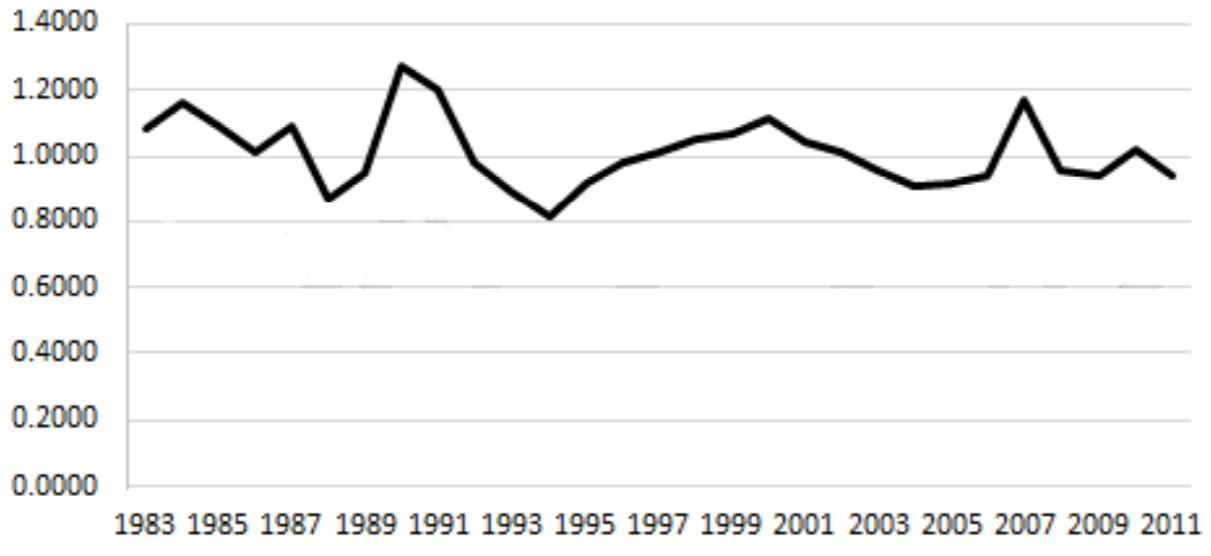
The data which we use to estimate and validate our agent-based model is based on aggregate data on insurers selling property insurance in the United Kingdom, courtesy of the Association of British Insurers (ABI). Using data from 1983 to 2011, we calculate the annual loss ratio for the UK property insurance industry. (The loss ratio is defined as the ratio of total claims paid to total premiums earned.) Figure 2 shows a time plot of the loss ratio. Note that as in Figure 1, troughs and crests appear in Figure 2 indicating a cycle. We work with the loss ratio rather than total premium because, over several years, premiums increase with inflation, making the identification of cycles difficult[3].
Model Description and Parameterization
Preference landscape and agent attributes
Our agent-based model of UK property insurance can be described as follows. There is a fixed number (\(M\)) of customers who must buy property insurance at the beginning of every year from one of a fixed number (\(N\)) of insurers[4]. Customers make random claims at the end of the year, independently of each other[5]. Insurers and customers are autonomous and self-directed agents in the model and are located on an abstract circular simulation landscape, as shown in Figure 3. The insurer's location on the circle denotes a particular set of attributes: perceived reliability, advertising methods, branding, target demographics, distribution channels, payment methods, perceived efficiency of claims service etc. The proximity of a customer to an insurer is interpreted as a greater affinity for the insurer and his product. Insurers and customers are fixed in the circular space so that their attributes and preferences do not change.
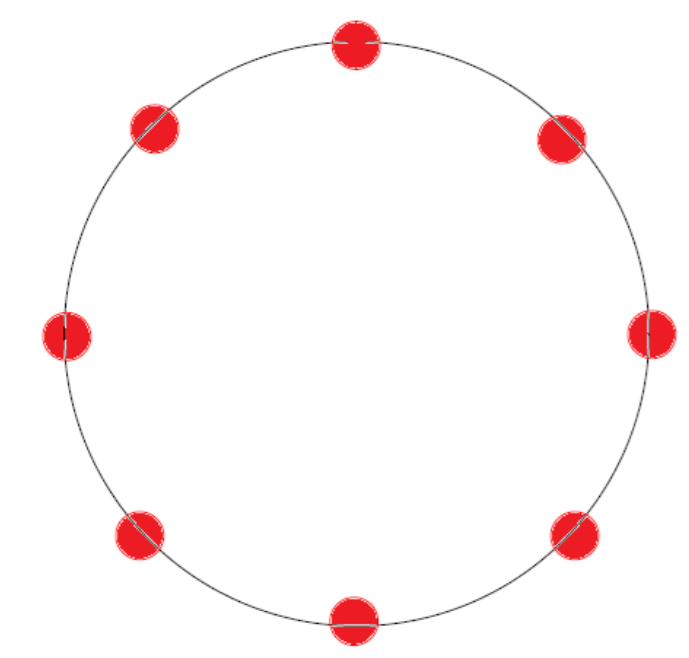
The differing locations of insurers means that they are heterogeneous. This is in line with the price-cutting model of Harrington et al. (2008). It also means that insurance products are not identical and directly substitutable. The insurance industry is therefore competitive, but not perfectly so, in line with the views of Feldblum (2001)[6]. The topology of a circular preference landscape is, of course, common to many agent-based models: see for example Gulyás (2002), as well as the work of Ladley (2013) on contagion effects in the banking industry. We choose it here for its simplicity. The circular landscape has also been used previously in insurance in the simple game theoretic model of Schlesinger and Schulenberg (1991) to investigate the effect of search and switching costs incurred by customers.
A final attribute of insurers is that they have a certain level of wealth or capital which changes over time as they sell more or less policies. A useful strategy, to achieve greater heterogeneity, is to endow each insurer with a random amount of capital (Gulyás 2002), but the choice of a suitable distribution is then arbitrary, so we elect to initialize the model with all insurers having the same amount of capital. Simulation experiments indicate that this makes little difference in the long run[7].
Insurer's pricing decision rule
At the beginning of every year, every insurer offers a single price to all customers[8]. At time \(t\), insurer \(i\) computes the price \(P_{it}\) through a two-stage process. The first stage involves the actuary and the second stage involves the underwriter. In our model, the actuary follows the usual actuarial costing or rate-making methods, as set out by Kaas et al. (2008, 203-227), Booth et al. (2005, 439), Hart et al. (2007, 213) for example. The actuary first calculates a pure premium \(\widetilde{P}_{it}\). The pure premium represents the insurer's expected claim cost in the following year. It is a weighted average of the insurer's own average past claims and the average industry-wide claim in the past year. This weighted average involves a "credibility factor" or weighting parameter \(z\) (where \(0 <z <1\)). The larger \(z\) is, the greater the weight placed by the actuary on the insurer's own claim experience. Actuaries throughout the industry pool claims data at rating bureaus or advisory organizations such as the Insurance Services Office in the U.S., hence the use of the average industry-wide claim in the above. The average past claims of the insurer is itself usually an exponentially weighted moving average of past claims, giving more weight (according to a parameter \(w\)) to claims in the recent past than in the distant past.
Finally, the actuary calculates an actuarial premium rate \(\widetilde{P}_{it} + \alpha F_{it}\). The term \(\alpha F_{it}\) is known as a risk loading, with \(\alpha\) being a loading factor (\(\alpha>0\)) and \(F_{it}\) representing some measure of risk or volatility of claims experienced by insurer \(i\) in the year (\(t-1\), \(t\)). In our model, \(F_{it}\) is the standard deviation of claims in the year (\(t-1\), \(t\)), consistent with actuarial statistics (Kaas et al. 2008, 119) and actuarial practice (Hart et al. 2007, 170). Thus, a riskier claims experience leads to a higher premium rate calculated by the actuary[9].
In the second stage, the actuary passes his premium rate to the underwriter who adjusts it to determine a competitive market price \(P_{it}\) for insurer \(i\) at time \(t\):
| $$P_{it} \;=\; \left( \widetilde{P}_{it} + \alpha F_{it} \right) e^{m_{it}}.$$ |
| $$m_{it} \;=\; \beta \widehat{m}_{it} \,+\, (1-\beta) m_{i, t-1},$$ |
Customer's purchasing decision rule
At the start of year (\(t\),~\(t+1\)), all customers are therefore offered insurance at the price \(P_{it}\) by insurer \(i\). Customer \(j\) then calculates the total cost \(TC_{ijt}\) of buying insurance from insurer \(i\) as follows:
| $$TC_{ijt} = P_{it} + \gamma \Delta_{ij},$$ |
During the year (\(t\), \(t+1\)), claims are randomly generated and independent from customer to customer. Claim amount (severity) is Gamma-distributed with mean \(\mu_G\) and standard deviation \(\sigma_G\). Claim frequency is given by a Bernoulli distribution with parameter \(b\): see Kaas et al. (2008, 32) and Hart et al. (2007, 130) for more details.
At the end of every year, the total claims paid out by insurers are added up, and likewise for the total premiums received for the year. A loss ratio, the ratio of total claims to total premiums over all the firms in the industry, is then calculated.
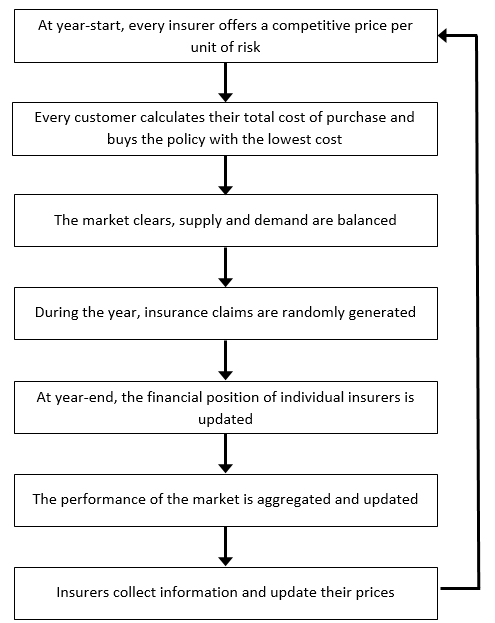
An outline of the steps in the execution of the insurance agent-based model appears in Figure 4.
Parameterization
The parameter values for our agent-based model are given in Table 1. Numerical experiments show that the three critical parameters which affect simulation results are the first three parameters in Table 1. The other parameters produce little qualitative difference in the results, except if they are assigned unrepresentative extreme values. These parameter values are chosen so as to create a reasonable representation of the real-world property insurance industry in the UK.
| Parameter | Value | Definition |
| α | 0.001 | Risk loading factor in insurers' premium calculation, Equation 1 |
| β | 0.3 | Weight in insurers' mark-up calculation, Equation 2 |
| γ | 0.08 | Weight in customers' total cost calculation, |
| M | 1000 | Number of customers |
| N | 20 | Number of insurers |
| T | 1000 | Time horizon of simulation |
| μG | 100 | Mean of Gamma-distributed i.i.d. claims |
| σG | 10 | Standard deviation of Gamma-distributed i.i.d. |
| b | 1 | Parameter of claim frequency distribution |
| w | 0.2 | Exponential smoothing parameter in insurer's |
| z | 0.2 | Credibility factor in pure risk premium |
It is well known that the numbers \(N\) or \(M\) of agents is an important parameter in agent-based simulation models. Gulyás (2002) illustrates this graphically. We test the parameters carefully making \(N\) and \(M\) large enough so that there is no noticeable quantization effect, while keeping them small enough so that the simulations execute quickly. Experiments reveal that the random claims process parameters \(\mu_G\), \(\sigma_G\), and \(b\) only affect the scale and volatility of loss ratios on the simulated market. The values selected here are partly based on the simulation study of Taylor (2008). We also use the 20/80 rule of thumb commonly adopted for the actuarial costing parameters \(w\) and \(z\) (Booth et al. 2005, Kaas et al. 2008). Sensitivity analysis shows that our results are robust to reasonable changes in these parameter values.
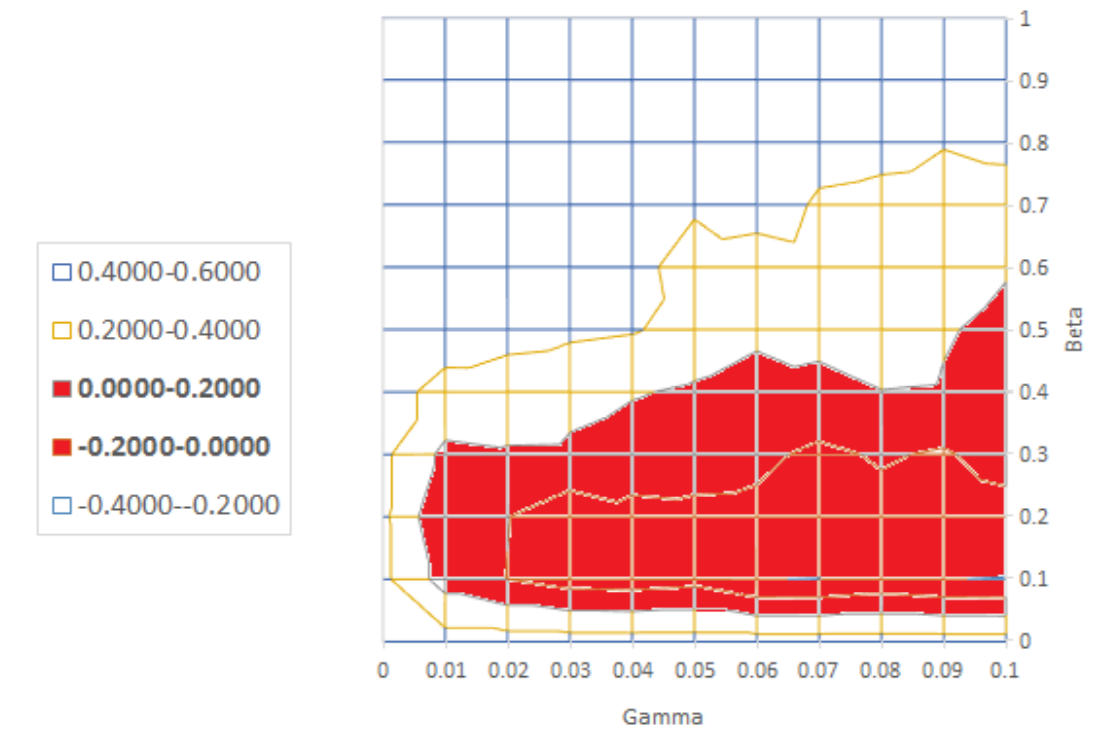
Estimation of the critical parameters \(\alpha\), \(\beta\) and \(\gamma\) proceeds by the method of moments combined with stochastic simulations of the agent-based model. Many such stochastic simulations are performed on a grid of values in the \(\alpha\)--\(\beta\)--\(\gamma\) parameter space. A grid search is then carried out to match the mean, standard deviation and lag-1 autocorrelation of the simulated loss ratios to the corresponding statistics from the actual loss ratios in the UK property insurance data[10]. The grid is then refined around the best triplet of parameter values, simulations are performed again, and a further grid search is carried out[11].The process is repeated until a reasonable degree of precision for the optimal estimates of \(\alpha\), \(\beta\) and \(\gamma\) is achieved. To illustrate this, Figure 5 shows the variation, as the parameters \(\beta\) and \(\gamma\) change, in the difference between the lag-1 autocorrelation on the actual data and the lag-1 autocorrelation in model simulations.
Model Validation
Internal validation
According to Taber and Timpone (1996, 77), the internal validity of models is concerned with whether a model gives a faithful representation of the underlying theory that is being tested. They argue that it should be checked before other forms of validation are attempted. The raison d'être of our agent-based model is to test the presumption that simple behaviour within an insurance firm and interaction within the industry will consolidate into an industry-wide cyclical dynamics. Our model does indeed impart simple behavioural rules to underwriters through mark-up pricing in Equation 1, to actuaries through credibility-weighted costing of claims, and to customers through the total cost function of price and distance in Equation 3. There is no reason to believe that any of these rules, by themselves, will generate cycles or crises. In addition, we are capturing the interaction between insurers and customers through insurers' evaluation of customers' price preferences and through customers' affinity for the insurance product (through the circular preference space). Simple interaction between insurers themselves, through pooling of claims data, is also modelled. Finally, actuaries and underwriters also interact within firms in their respective roles of costing and pricing. It is true that we disregard operations managers and claims adjusters, but their influence on insurance prices is less clear-cut. Our model is therefore internally valid in the sense that several aspects of the behavioural theory that we are testing are duly represented in the model.
Another aspect of internal validation is basic sensitivity analysis Taber and Timpone (1996, 78). When the number of customers \(M\) is increased, one would expect that the insurance market becomes less competitive, and that insurers' overall profitability increases. Simulations indeed show that the mean industry-wide loss ratio in the model falls as \(M\) increases. In fact, the volatility of the loss ratio also falls, since insurers find that demand is less responsive to a price change and they do not have to compete on price aggressively. Conversely, we find that the mean and standard deviation of the loss ratio increase as the number of insurers \(N\) increases, because competition intensifies. Increasing the mean \(\mu_G\) and standard deviation \(\sigma_G\) of claims should increase the mean and standard deviation of the industry-wide loss ratio respectively, and this is also observed in our sensitivity analysis. These results are intuitively correct and strengthen the internal validity of our agent-based model.
It is also important to test that the model is reliable in the sense that model output remains consistent over multiple runs in each stochastic simulation that we perform (Bloomquist 2006; Taber and Timpone 1996, 78). First, we test, over several distinct runs of the model, that loss ratios are stationary in the second-order stochastic sense[12]. This is done by means of the Augmented Dickey-Fuller (ADF) test. For virtually all simulated sample paths that were tested, the ADF test rejects the null hypothesis of a unit root at the 5% significance level[13]. Correlograms also show that autocorrelations decay rapidly as lag increases. We conclude that the simulated loss ratios are indeed stationary. Next, we check the ergodicity of the model by verifying that means and standard deviations of the simulated loss ratio at a common time point over an ensemble of 1000 sample paths is approximately equal to the means and standard deviations of loss ratio along one long simulated sample path. Finally, we check that our estimates of mean and standard deviation are stable over different lengths of simulation runs and also over different ensemble sizes[14].
Outcome validation
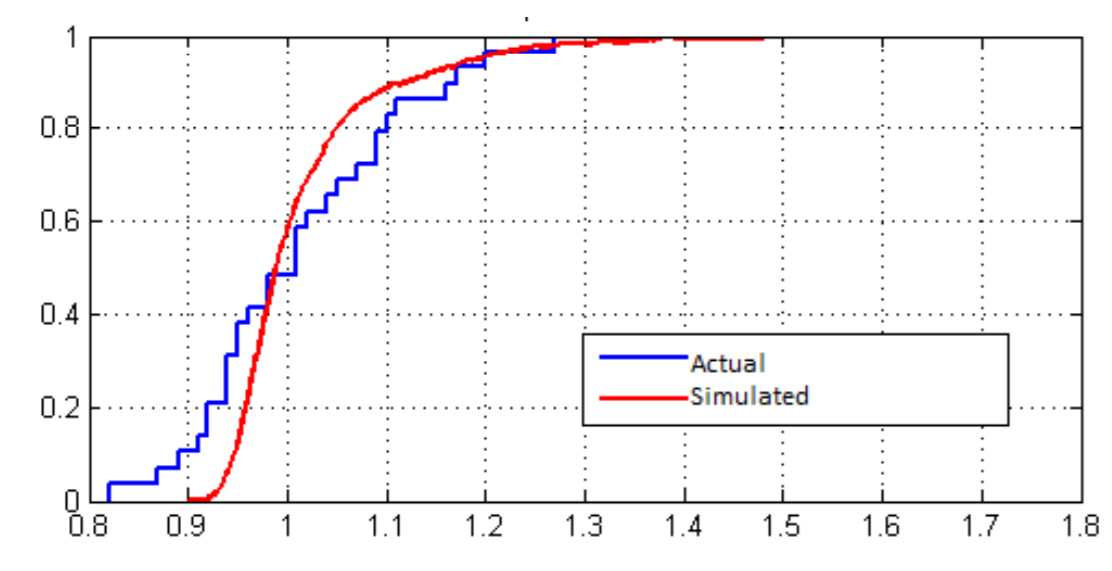
Outcome validity is concerned with whether there is a good correspondence between simulation outcomes and real-world data (Bloomquist 2006; Taber and Timpone 1996, 75). Since we successfully tested for stationarity and we verified ergodicity in the internal validation stage, we can compare the distribution of simulated loss ratios from the agent-based model to the distribution in the actual data from the UK property insurance industry. Figure 6 shows the empirical distribution functions from the simulated and actual loss ratios: they are close although the simulated loss ratios appear to be less dispersed, and very high insurer profitability (very low loss ratios) occur less frequently in our model than in the real-world UK property insurance sector. A two-sample Kolmogorov-Smirnov (KS) test fails to reject the null hypothesis that the two distributions are the same, at the 5% significance level. This confirms that our model has a good fit to the data.
Process Validation
Whereas outcome validity is about the correspondence between simulation outcomes and real-world data, process validity of models is about the correspondence between "a model's mechanisms and the real-world processes that produce the output" (Taber and Timpone 1996, 75). In our model, we attempt to reproduce the functions of rate-making actuaries, by replicating actuarial practice (Booth et al. 2005, Hart et al. 2007) while simultaneously conforming to actuarial theory (Kaas et al. 2008). The distinction that we make in our model between actuarial rate-making and underwriter pricing functions is realistic (Feldblum 2001; Booth et al. 2005, 404).
The pricing rule which governs underwriters' behaviour in our model is based on cost-plus pricing which is well-established in managerial economics (Hirschey and Pappas 1996; Petersen and Lewis 1999) as well as in insurance: see Harrington and Niehaus (2003, 137) or Hart et al. (2007, 455). It is regarded as a widely used heuristic by managers to approximately maximize their firms' expected profit (Conlisk 1996; Baumol and Quandt 1964). According to Drury and Tayles (2006), 60% of 112 firms that they surveyed in the U.K. use this form of pricing.
The decision rule of customers in our model is also closer to reality than in most models because it is a function of non-price characteristics and not just of price. Customers are clearly influenced by characteristics such as the reputation of an insurer, the perceived quality of service it provides, advertising methods etc. If they were not, then corporate budgets spent on branding, advertising and customer relationship would not be as large as they are. Although the circular preference space is abstract, it does capture customers' decisions better than most conventional economic models which concentrate on price alone.
Many real-world processes in the insurance industry are therefore represented in our model. Of course, these processes are simplified: complete process validity is both "impossible and undesirable" (Taber and Timpone 1996, 73) and some tension between maintaining simplicity (or parsimony) and capturing the complex reality of social systems is inevitable.
Main Result
The purpose of the agent-based simulation model described, parameterized and validated in the preceding sections is to assess the socio-anthropological and behavioural theories of Ingram and Underwood (2010), Feldblum (2001) and Fitzpatrick (2004) concerning the underwriting cycle and crises prevalent in the property-casualty insurance industry. More specifically, the hypothesis that we seek to falsify with our model is that complex industry-wide behaviour (such as cycles) cannot be generated by simple behaviours at the firm level and simple interaction between customers and players in the industry. If this hypothesis is rejected, then our model will lend support to these theories, although no definitive proof can be established either way.
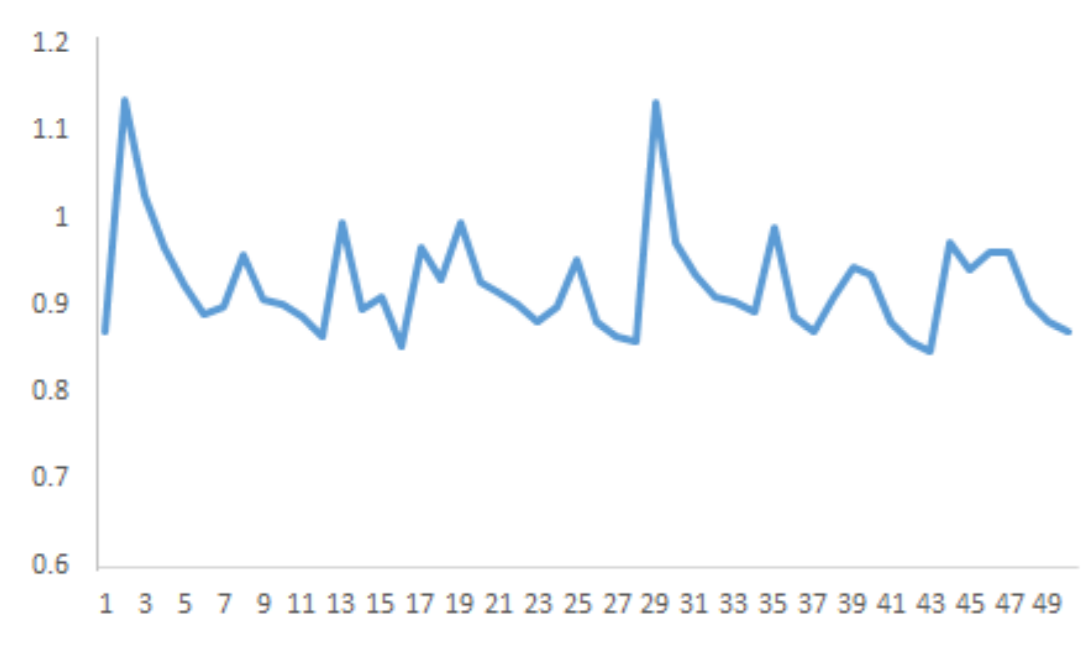
The loss ratio from one simulation run of our model is shown in Figure 7. As in the actual data from the UK property insurance sector in Figure 2, the regular ups and downs suggest that cycles may be present. The sharp turning points can arguably be interpreted as crises in the industry.
In order to test the presence of cycles, we use a similar approach to Venezian (1985), Cummins and Outreville (1987), Harrington et al. (2014) and others in the insurance literature, which is to fit a second-order autoregression, i.e. an AR(2) model (Box et al. 1994), to the loss ratio. The loss ratio from the simulated model was found to be stationary in the internal validation stage of the modelling process. The Akaike Information Criterion (AIC) takes a value of -2.2987 when an AR(2) model is fitted, compared with -2.2919 for an AR(1) and -2.2972 for an AR(3), meaning that the AR(2) is the marginally preferred model.
The fitted model is \(\Pi_t = a_0 + a_1 \Pi_{t-1} + a_2 \Pi_{t-2} + \epsilon_t\), with \(a_0=0.937\), \(a_1=0.467\) and \(a_2=-0.100\). Here \(\Pi_t\) denotes the loss ratio and \(\epsilon_t\) denotes the residuals. A condition for stationary cycles to occur in an AR(2) model is that \(a_1>0\), \(-1 <a_2 < 0\) and \(a_1^2 + 4 a_2 < 0\) (Box et al. 1994, 60). This condition is satisfied in our model, thereby establishing the presence of cycles.
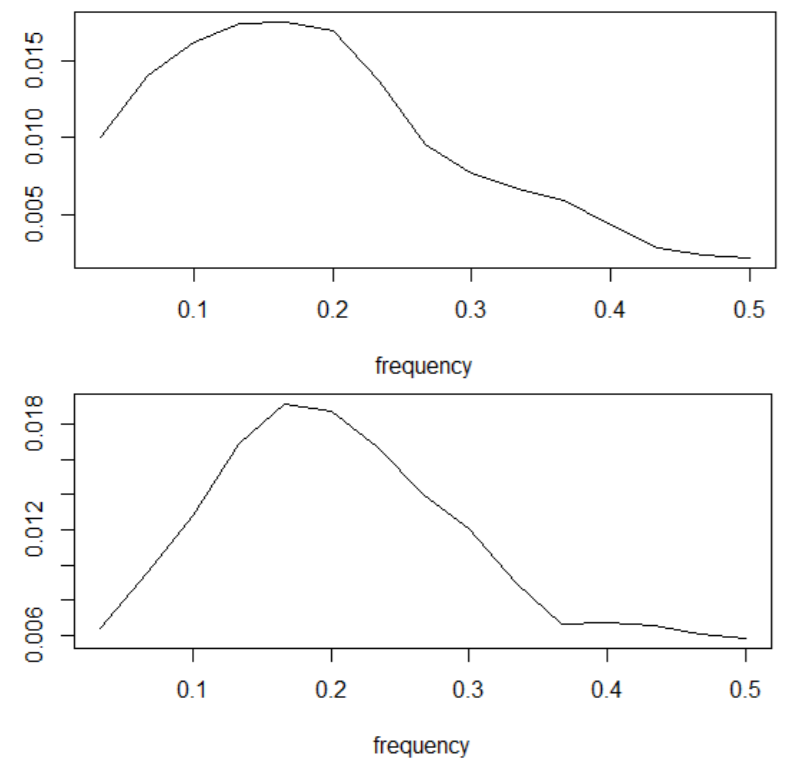
The second-order autoregression above is not entirely satisfactory. First, it has a weak fit to the data with an adjusted \(R^2\) of 0.19. Second, it is claimed that underwriting cycles are not best described by autoregressive models (Boyer and Owadally 2015). However, further support for the existence of cycles can be obtained by spectral analysis. Figure 8 shows the periodograms for the loss ratios from both the actual data on the UK property insurance sector and from the simulated agent-based model. The single peak in the periodograms, occurring at roughly the same annual frequency of 0.17, indicates that a cycle occurs with a period of about 5.9 years in both the actual insurance data and in the agent-based model. Although the above time series analysis pertains to only one simulation run, similar sample paths are generated every time that a simulation is performed, with peaks and troughs occurring roughly 6 years apart, but not necessarily at the same time points.
The presence of cycles in the simulation model, despite only simple individual-level behaviour and interaction, means that we reject the hypothesis that such simple behaviour cannot propagate and emerge as complex cyclical industry-wide behaviour. The behavioural and socio-anthropological theories furnished by Fitzpatrick (2004), Feldblum (2001), Ingram and Bush (2013), Kunreuther et al. (2013) and Boyer et al. (2013) all rely on a transmission mechanism from simple individual-level behaviour to complex macro-level behaviour. Therefore, we cannot rule out that their explanations for cycles and crises in the insurance industry are valid explanations.
Simulation Experiment
Agent-based models are, of course, ideal `sandboxes' or experimental platforms. Virtual `what if' experiments that cannot be performed in the real world can be carried out by perturbing parameters, assumptions and initial conditions: see Taber and Timpone (1996, 6), Axelrod (1997) and Lustick et al. (2004), among others.
We perform a simple experiment involving the relationship between actuaries and underwriters in an insurance firm. Both the behavioural, fear-based explanation of Fitzpatrick (2004) and the socio-anthropological explanation of Ingram and Underwood (2010), Ingram et al. (2012) and Ingram and Bush (2013) suggest that competing influence and shifting power between groups of individuals within the insurance firm can perpetuate underwriting cycles in the insurance industry. In our model, the \(\beta\) parameter in Equation 2 governs the relationship between underwriters and actuaries. A high \(\beta\) means that underwriters change prices more aggressively from year to year in response to what they perceive as customer demand. The price will then deviate from the actuarial premium rate. In other words, underwriters have more say in the price offered to customers than actuaries, as \(\beta\) increases. On the other hand, a lower \(\beta\) gives greater power to actuaries over the insurance price.
In Figure 9, we see that the volatility of the loss ratio increases as \(\beta\) increases (the vertical scales in the 3 panels are different). The plural risk attitudes in the socio-anthropological framework of Ingram and Bush (2013) do indeed transpire in our model: actuaries, as prudent risk managers, dominate when \(\beta\) is low and dampen volatility in the insurance industry; underwriters, as profit-maximizing risk-takers, dominate when \(\beta\) is high and create greater volatility.
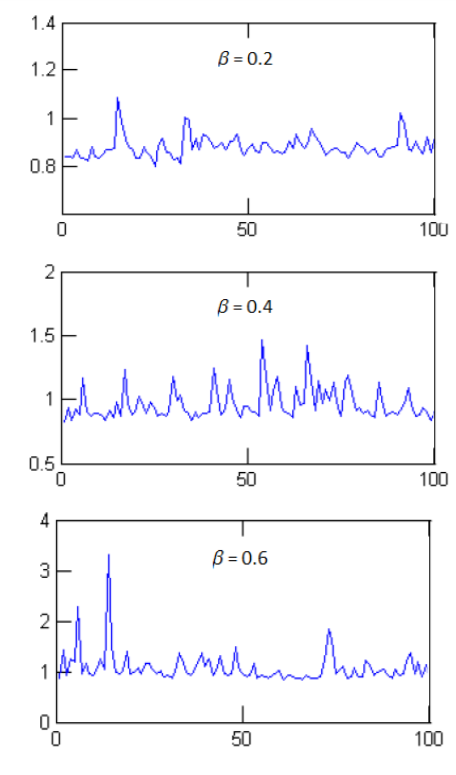
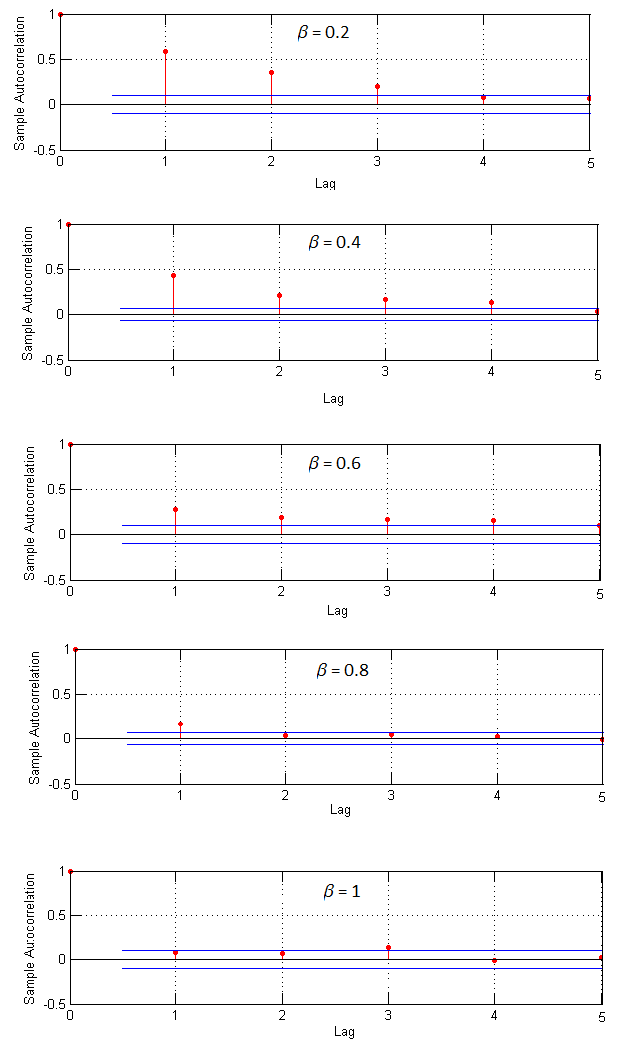
Figure 10 shows various correlograms of loss ratio for different values of \(\beta\). The loss ratio become less autocorrelated, and more like a noisy random sequence, as \(\beta\) increases. Time series features such as cycles, which arise from stochastic dependence, therefore disappear when the moderating influence of actuaries on insurance prices wanes. Taken together, these results suggest that underwriting cycles and insurance crises may well be a consequence of the interplay between actuaries and underwriters (and possibly other groups) within the insurance firm, as argued by Fitzpatrick (2004), Feldblum (2001), Ingram and Underwood (2010) and Ingram-Bush (2013). The price for less volatile insurance premiums in the short term may be greater cyclicality in the long term.
Conclusion
A stable and well-functioning insurance sector is vital to the socio-economic well-being of individuals. Yet, the insurance industry is wracked by regular cycles and periodic crises. Despite the efforts of industry regulators, consumer protection authorities and insurance risk managers, underwriting cycles continue to cause violent swings in the prices paid by insurance consumers. These cycles have a significant socio-economic cost as they damage the protection required by individuals for their homes, belongings, and livelihoods and also affect companies who require insurance for their assets. An even greater cost is incurred in the event of insurance crises, when the cycles plunge deeply and suddenly: insurance cover can become scarce or exorbitantly expensive.
In this paper, we review new hypotheses put forward to explain underwriting cycles and insurance crises: the socio-anthropological hypothesis of Ingram and Underwood (2010) and Ingram-Bush (2013), and the behavioural hypotheses of Fitzpatrick (2004) and Feldblum (2001), backed up by evidence supplied by behavioural economics applied to insurance.
There is an implicit presumption, in all of these hypotheses, that behaviour and interaction at the micro or individual scale can create complex effects on a macro or social scale. We develop an agent-based simulation model, inspired by Axelrod (1997), Macal and North (2010), Taber and Timpone (1996) and others, to investigate whether this presumption is tenable. Our model is parameterized on actual data for the property insurance sector in the UK. We assess our model rigorously for internal, outcome and process validity, and document this carefully. The main result that we obtain, from stochastic simulations of our model, is that cycles do seem to be present. This is confirmed by both time series and spectral analyses of simulated loss ratios. Visual inspection of the simulation runs reveals sharp turning points in the loss ratios, which are very suggestive of insurance crises.
These cycles and crises appear in the agent-based model even though the agents are assigned simple realistic rules of behaviour and interaction with one another. This in turn means that we cannot rule out that individual-level behaviour and interaction---as implied by the social-anthropological and behavioural hypotheses of Ingram-Underwood (2010), Fitzpatrick (2004) and Feldblum (2001) - may be a contributory factor to insurance industry cycles and crises. In a further simulation experiment, we observe that the interplay between, and countervailing influences of, underwriters and actuaries within the insurance firm may also contribute to industry-wide cycles. There appears to be a trade-off between less volatile insurance premiums in the short term and greater cyclicality in the long term.
Notes
- Insurers invest the premiums that they receive in the money and bond markets before making a payout on a claim, so their profitability will be interest rate-sensitive.
- Managers cannot hedge this risk, unlike stockholders in the firm who can own a diverse portfolio of stocks.
- Since the loss ratio is a ratio of two monetary quantities, inflation is cancelled out (assuming that inflation affects claims and premiums in a similar fashion). The loss ratio is usually stationary around a linear trend, as is visible in Figure 1. The linear trend is usually ascribed to decades-long structural change in the insurance industry caused by technological innovation, regulations, or changes in labour costs (Harrington et al. 2014)
- For simplicity, inflation, tax, expenses and fraud are ignored in the model.
- The UK very rarely experiences natural catastrophes that damage UK property with such severity that the insurance market faces large-scale industry-wide losses which could periodically trigger cycles. The assumption of statistical independence of individual claims is therefore reasonable.
- Property insurance contracts may be identical but the total insurance product package (comprised of the contract as well as branding, perceived reliability of insurer, distribution channels etc.) will not be identical and interchangeable.
- We discard the first 100 simulation periods to avoid initialization effects.
- This can be viewed as a price per unit of risk. See for example Taylor (2008).
- The actuarial rate-making procedure is considerably simplified here, but its essence is nevertheless captured. For more details about actuarial premium principles, credibility estimates, risk classification, and the computations required in insurance mathematics, see Kaas et al. (2008) or Booth et al. (2005) or Hart et al. (2007), among other standard insurance texts.
- As usual in Monte-Carlo simulations, we fix the seed of the random number generator so that the random claims made by customers are identical for every simulation carried out at each point in the grid. This minimizes sampling error.
- Spot-checks on the grid are carried out by means of further simulations to check that we search for global, not local, best estimates.
- In all simulations, we discard the first 100 periods of the sample path to avoid transient behaviour at initialization. We also use the same pseudo-random sample of claims by fixing the seed of the random number generator, so that results are comparable.
- For a small minority of runs, this rejection occurs at the 10% level.
- In other words, we check that sample statistics are stable when averaged over 1000 as well as 10000 runs, and also over a time horizon of 100 years as well as 1000 years.
References
AXELROD, R. (1997). Advancing the art of simulation in social sciences. In: Conte, R., Hegselmann, R. and Terna, P. (eds.). Simulating Social Phenomena. Springer, New York, pp. 21-40. [doi:10.1007/978-3-662-03366-1_2]
BAUMOL, W.J. and Quandt, R.E. (1964) Rules of thumb and optimally imperfect decisions. American Economic Review, 54(2), 23-46.
BLOOMQUIST, K.M. (2006). A Comparison of Agent-Based Models of Income Tax Evasion. Social Science Computer Review, 24, 411-425. [doi:10.1177/0894439306287021]
BOOTH, P., Haberman, S., Chadburn, R., James, D., Khorasanee, Z., Plumb, R. H., & Rickayzen, B. (2005). Modern Actuarial Theory and Practice, 2nd ed., Boca Raton, FL: Chapman and Hall/CRC Press.
BOX, J., Jenkins, G.M. and Reinsel, G.C. (1994). Time Series Analysis, Forecasting and Control, 3rd ed., Englewood Cliffs, NJ: Prentice Hall.
BOYER, M.M., Eisenman, J. and Outreville, J.F. (2013). Underwriting cycles and underwriter sentiment. Mimeo, HEC Montreal, University of Montreal. Paper presented to the Munich Behavioral Insurance Workshop, 12-13 December 2011, Munich, Germany.
BOYER, M.M., and Owadally, I. (2015). Underwriting Apophenia and Cryptids: Are Cycles Statistical Figments of our Imagination? Geneva Papers on Risk and Insurance Issues and Practice, 40(2), 232-255. [doi:10.1057/gpp.2014.12]
CARTER, D. (2011). Towers Watson's agent model is not staying a secret. Pensions and Investments: http://www.pionline.com/article/20110725/PRINTSUB/307259989.
CONLISK, J. (1996). Why Bounded Rationality? Journal of Economic Literature, 34(2), 669-700.
CUMMINS, J.D. and Outreville, J.F. (1987). An international analysis of underwriting cycles in property-liability insurance. Journal of Risk and Insurance, 54, 246-262.
DOHERTY, N.A. and Kang, H.B. (1988). Interest rates and insurance price cycles. Journal of Banking and Finance, 12(2), 199-214. [doi:10.1016/0378-4266(88)90035-0]
DOUGLAS, M. and Wildavsky, A. (1982). Risk and Culture: an Essay on the Selection of Technical and Environmental Dangers., Berkeley, California: University of California Press.
DRURY, C. and Tayles, M. (2006). Profitability analysis in UK organizations: an exploratory study. British Accounting Review, 38, 405-425. [doi:10.1016/j.bar.2006.05.003]
ERTA, K., Hunt, S., Iscenko, Z. and Brambley, W. (2013). Applying behavioural economics at the Financial Conduct Authority (Occasional paper No. 1). Financial Conduct Authority, London, UK.
FITZPATRICK, S.M. (2004). Fear is the key: a behavioral guide to underwriting cycles. Connecticut Insurance Law Journal, 10(2), 255-275.
FELDBLUM, S. (2001). Underwriting cycles and business strategies. Proceedings of the Casualty Actuarial Society, 38, 175-235.
GREENWALD, B.C. and Stiglitz, J.E. (1990). Asymmetric information and the New Theory of the Firm: financial constraints and risk behaviour. American Economic Review, 80(2), 160-165. [doi:10.3386/w3359]
GRON, A. (1994). Capacity constraints and cycles in property-casualty insurance markets. RAND Journal of Economics, 25(1), 110-127.
GULYÁS, L. (2002). On the Transition to Agent-Based Modeling Implementation Strategies From Variables to Agents. Social Science Computer Review, 20, 389-399. [doi:10.1177/089443902237318]
HARRINGTON, S.E. and Danzon, P.M. (1994). Price cutting in liability insurance markets. Journal of Business, 67(4), 511-538.
HARRINGTON, S.E., Danzon, P.M. and Epstein, A.J. (2008). ''Crises'' in medical malpractice insurance: Evidence of excessive price-cutting in the preceding soft market. Journal of Banking & Finance, 32, 157-169. [doi:10.1016/j.jbankfin.2007.09.009]
HARRINGTON, S.E. and Niehaus, G.R. (2003). Risk Management and Insurance, 2nd ed. New York, NY: McGraw-Hill.
HARRINGTON, S.E., Niehaus, G., Yu, T. (2014). Volatility and underwriting cycles. In: Dionne, G. (ed.) (2014). Handbook of Insurance, 2nd ed. New York, NY: Springer.
HART, D.G., Buchanan, R.A. and Howe, B.A. (2007). The Actuarial Practice of General Insurance, 7th ed. Sydney, Australia: Institute of Actuaries of Australia.
HIRSCHEY, M. and Pappas, J.L. (1996). Managerial Economics, 8th ed. Fort Worth, TX: Dryden Press.
INGRAM, D. and Underwood, A. (2010). The Human Dynamics of the Insurance Cycle and Implications for Insurers: An Introduction to the Theory of Plural Rationalities. Monograph, Society of Actuaries, Schaumburg, Illinois: http://www.soa.org/library/monographs/other-monographs/2010/april/mono-2010-m-as10-1-ingram.pdf.
INGRAM, D., Tayler, P. and Thompson, M. (2012). Surprise, surprise. From neoclassical economics to e-life. ASTIN Bulletin, 42, 389-411.
INGRAM, D. and Bush, E. (2013). Collective approaches to risk in business: an introduction to Plural Rationality Theory. North American Actuarial Journal, 17, 297-305.
KAAS, R., Goovaerts, M., Dhaene, J. and Denuit, M. (2008). Modern Actuarial Risk Theory Using R, 2nd ed. New York, NY: Kluwer. [doi:10.1007/978-3-540-70998-5]
KUNREUTHER, H.C., Pauly, M.V., McMorrow, S. (2013). Insurance and Behavioral Economics. Cambridge: Cambridge University Press.
LADLEY, D. (2013). Contagion and risk-sharing on the inter-bank market. Journal of Economic Dynamics and Control, 37(7), 1384-1400. [doi:10.1016/j.jedc.2013.03.009]
LIGON, J.A. and Thistle, P.D. (2007). A Behavioral Model of Insurance Pricing. Journal of Insurance Issues, 30(1), 46-61.
LLOYD's (2010). Behaviour bear, bull or lemming? (Lloyd's emerging risk report). London, UK: Lloyd's of London.
LUSTICK, I.S., Miodownik, D. and Jeidelson, R. (2004). Secessionism in multicultural states: does sharing power prevent or encourage it? American Political Science Review, 98, 209-229.
MACAL, C.M. and North, M.J. (2010). Tutorial on agent-based modelling and simulation. Journal of Simulation, 4(3), 151-162. [doi:10.1057/jos.2010.3]
MAYERS, D. and Smith, C.W. (1990). On the corporate demand for insurance: evidence from the reinsurance market. Journal of Business, 63(1), 19-41.
MILLS, A. (2010). Complexity science. An introduction and invitation for actuaries. Report prepared for the Health Section, Society of Actuaries, 10 June 2010: http://www.soa.org/files/pdf/research-complexity-report-v1a.pdf.
PALIN, J., Silver, N., Slater, A. and Smith, A.D. (2008). Complexity Economics Application and Relevance to Actuarial Work. Report of a Working Party of the UK Actuarial Profession. Paper presented to the Finance Investment and Risk Management Conference.
PARODI, P. (2012). Computational intelligence with applications to general insurance: a review. Annals of Actuarial Science, 6, 307-380. [doi:10.1017/S1748499512000036]
PETERSEN, H.C. and Lewis, W.C. (1999). Managerial Economics, 4th ed. Upper Saddle River, NJ: Prentice Hall.
SCHLESINGER, H. and Schulenburg, J.M.G. (1991). Search Costs, Switching Costs and Product Heterogeneity in an Insurance Market. Journal of Risk and Insurance, 58, 109-120. [doi:10.2307/3520051]
STEWART, B.D., Stewart, R.E. and Roddis, R.S. (1991). A brief history of underwriting cycles. In: Cummins, J.D., Harrington, S.E., Klein, R.W. (Eds.). Cycles and Crises in Property/Casualty Insurance: Causes and Implications for Public Policy. Kansas City, Kansas: National Association of Insurance Commissioners.
TABER, C.S. and Timpone, R.J. (1996). Computational Modeling. Thousand Oaks, California: Sage Publications. [doi:10.4135/9781412983716]
TAYLOR, G. (2008). A simple model of insurance market dynamics. North American Actuarial Journal, 12, 242-262.
THOMPSON, M., Ellis, R.J., and Wildavsky, A. (1990). Cultural Theory. Boulder, Colorado: Westview Press.
TVERSKY, A. and Kahneman, D. (1974). Judgement under uncertainty: heuristics and biases. Science, 185, 1124-1131.
TUDOR, A., 2003. A (macro) sociology of fear? The Sociological Review, 51, 238-256. [doi:10.1111/1467-954X.00417]
VENEZIAN, E.C. (1985). Ratemaking methods and profit cycles in property and liability insurance. Journal of Risk and Insurance, 52(3), 477-500.
WEISS, M.A. (2007). Underwriting cycles: a synthesis and further directions. Journal of Insurance Issues, 30(1), 31-45.
WINTER, R.A. (1988). The liability crisis and the dynamics of competitive insurance markets. Yale Journal on Regulation, 5, 455-499.
WINTER, R.A. (1994). The dynamics of competitive insurance markets. Journal of Financial Intermediation, 3, 379-415. [doi:10.1006/jfin.1994.1011]