
Introduction
Cooperation in groups is a primary adaptation with which we overcome environmental challenges. This study theorizes that the presence of cooperating groups in an individual’s environment generates selective pressure on group-based strategies. This nexus between inter-group competition and intra-group cooperation I call “tribalism.” This study presents a model of the evolution of tribalism in which the presence of inter-group competition—particularly in the face of declining resources—shifts evolutionary rewards to individuals with a propensity to engage in individually-costly, but group-strengthening behavior. I test this model using multi-agent simulation, wherein a population of selfish, egoistic agents may elect to engage in group-centric survival strategies in order to overcome acute scarcities produced by a dynamically changing ecosystem.
The substantive context of this simulation design is abstracted from the arid and semi-arid regions of east Africa, encompassing the Great Rift Valley region of northern Kenya in the west and the Mandera triangle, where the borders of Kenya, Ethiopia, and Somalia meet in the east. Nomadic pastoralists occupy large swathes of these marginally hospitable territories, making their living moving herds of animals in search of pasture and water. Though they may occasionally supplement their diets by trading with farmers and fishing, they generally subsist on the products of their animals, especially renewable products such as milk and tapped blood (Heady 1975; Fratkin et al. 2006; Sadler et al. 2010).
One of the advantages of the pastoralist economic modality is that it is viable on marginal land which is too dry for permanent cultivation. However, evidence suggests that degradation of the environment from various sources, including climate change, is upsetting the delicate ecosystems that make it possible and potentially contributing to an increase in the frequency and severity of inter-tribal violence (Parenti 2011; Hendrix & Salehyan 2012; Suliman 1993; Raleigh & Kniveton 2012; Buhaug & Rød 2006; Kuznar & Sedlmeyer 2005). Over the last three decades, both temperatures and the frequency of droughts have increased near and around the horn of east Africa, with prolonged drought occurring every five to six years, most recently in 2000-2001, 2005-2006, 2008-2009, 2010-2011, and 2015-present (Fratkin 2001; IFRC 2011; NIDIS 2015; Halake 2016; FEWS 2018). Further, land usage policies and a legacy of misguided foreign aid e orts have exacerbated the problem. In 1968, ecologist Garrett Hardin published his seminal piece in Science, The Tragedy of the Commons, in which he argues that commonly shared resources are inevitably depleted by rational individuals; thus, natural resources should be either regulated or privatized in order to ensure good stewardship (Hardin 1968). With this in mind, well-intentioned western aid organizations made grim predictions of the sustainability of pastoralist societies and encouraged local governments to implement land use reforms. The introduction of more intensive agricultural practices has in many cases produced only short-term gains in productivity that are cut short by soil exhaustion (Parenti 2011). As a result, pastoralists found their large, communally shared lands increasingly fragmented by expanding farming operations, private ranches, wheat estates, and game parks (Fratkin 2001).
Inter-tribal conflict among the pastoralists of East Africa is not new. Traditionally, these groups have relied upon kinship ties to cooperatively breed and defend their animals. The institution of “livestock raiding,” in which large groups of pastoralist tribesmen gather in order to conduct raids on other tribes for the purpose of stealing live-stock, has existed since at least the 19th century when it was first observed by the British (Fukui and Turton 1979; Parenti 2011). Raiding is believed to accomplish several social, economic, and strategic purposes. Among them, raiding can replenish stocks lost during the dry season, which could be critical for young men looking amass a dowry for marriage (Parenti 2011). Mathew and Boyd (2011) observe raiding to be an individually-costly activity producing collective goods for the tribe, including deterrence against other tribes and increased access to grazing areas and water holes. Accordingly, they observe participation in raids to be backed by cultural norms and various forms of social punishment of free-riding. For example, participation is a rite of passage into adulthood. Though this practice is deeply rooted in the cultures and pasts of these peoples, the combination of a changing climate, land fragmentation, degradation, and competing farmers appears to be increasing the frequency and severity of raiding (Parenti 2011; Suliman 1993).
Several studies have productively applied agent simulation to examine pastoralist conflict and the evolution of cooperation under a common pool resource constraints. Interestingly, group-level approaches tend to describe realistic conflict processes. For example, Kuznar and Sedlmeyer (2005) model how individuals (in a Darfur-like scenario) respond to environmental and material challenges by pursuing inter-group violence as a form of collective action. Specifically, they find that drought can lead to sustained violent conflict and a breakdown of inter-tribal relations in terms of mutually beneficial activities, such as trade. Kennedy et al. (2010) simulate a seasonal conflict model of nomadic herders and find that greater scarcity favors a strategy of domination by a single group. Hailegiorgis et al. (2010) model the Mandera Triangle region, focusing on the tensions that can emerge between groups over the utilization of common grazing land. Yet while group-level models tend to emphasize conflict processes, individual-level models emphasize the Ostromian thesis that cooperation can prevent over-exploitation of common pool resources, ultimately being a prerequisite for long-term stability (Ostrom et al. 1999). For example, ten Broeke et al. (2018) show that the proliferation of cooperation at the individual-level can render the population more resilient to even severe environmental shocks disrupting the resources they need to survive. For Crépin & Lindahl (2009) the results are more qualified—finding that whether cooperation results in over- or under-exploitation of a resource is dependent on the character of animal-pasture interactions—but either way the emphasis is on cooperation or non-cooperation, which is distinct from conflict. Taken together, these studies identify linkages between the environment and social processes. But what explains their seemingly different results? Building o of their work, I present a social-ecological model of tribalism that models both individual- and group-level dynamics as emerging from simultaneous, interdependent processes.
Theory
In modeling this system, the present research aims to gain insight into a potential co-evolutionary relationship between inter-group conflict and intragroup cooperation, and how this relationship may have been conditioned by environmental factors. The model is based on two core design principles: 1) multilevel selection, and 2) realistic (i.e., ‘material’) competition for scarce resources agents need to survive.
Multilevel selection is an extension of traditional evolutionary theory and may be employed to mathematically explain the evolution of cooperation from within the counter-intuitive, competitive-yet-cooperative, dynamics of social living (Wilson & Wilson 2007). Evolutionary game-theoretic models have been extensively used to model the proliferation (or elimination) of behavioral strategies in well-mixed populations in the same way population genetics models the proliferation of genetic traits (Nowak 2006; Gintis 2005; Dugatkin & Reeve 2000). In fact, advances in evolutionary psychology and biopolitics suggest many social behaviors have foundations in our genome (Fowler et al. 2008, 2009; Dawes & Fowler 2009; Alford et al. 2005).[1] One relevant feature of human societies, however, is that individuals are both competing and cooperating with each other in the con-text of social groups, which are themselves in competition with each other. Early social Darwinists speculated that the same evolutionary dynamics affecting individuals are played out at the group-level, reasoning that groups which are most inwardly-patriotic and cooperative would possess an advantage over rival groups in the competition for the resources they need to survive and grow (Spencer 1904; Bannister 2010; Weikart 1993). Accordingly, nature would “select” for these groups to displace groups lacking their patriotic fervor. This (frequently misappropriated) conception of evolution, however, is fundamentally mistaken because it neglects the fact that individuals within those groups will be in competition with each other and therefore under selective pressure to “defect”, or shirk their “patriotic submission” to the collective interests. For this reason, historical conceptions of so-called “group selection” are invalid from a Darwinian point of view.
Still, it is difficult to ignore the penetrating insight of Darwin’s own declaration from The Descent of Man (1871)
“[A] tribe including many members who, from possessing in high degree the spirit of patriotism, fidelity, obedience, courage, and sympathy, were always ready to aid one another, and to sacrifice themselves for the common good, would be victorious over most other tribes, and this would be natural selection.”
Multilevel selection has emerged as a re-rendering of this notion in a way that does not violate the principle of individual-level selection, while at the same time incorporating selection forces at higher-orders of competition (i.e., inter-group competition) (Nowak 2006; Wilson & Wilson 2007). Sidanius & Kurzban (2003) define a “group” as “any set of individuals that have a fitness impact on one another.” This definition does not assume any degree of genetic relatedness between individuals within a group and neither does the proposed model. According to multilevel group selection theory, nature can be said to select for an entire group if, despite some relative fitness inequality between internal phenotypes, members of all phenotypes are on the whole more successful in passing on their genes than individuals belonging to other groups. As Sidanius & Kurzban explain, this is not “an alternative to the genetic view of ... selection,” but rather is “simply another way of keeping track of genes’ success by looking at their relative replication rates within and between groups.”
Like real societies, agents are independent actors nested inside higher-order units of aggregation. The attributes of tribes are constituted from aggregations of actions their members make. A tribe’s attributes, however, may have an indirect impact on what its members are able to do in the future. A key tribal attribute is its cohesion. Cohesion is calculated as the average proportion of resources agents contribute in public games with their fellows, or the mean propensity of a tribe’s members to cooperate. The cohesion of an agent’s tribe can enable them to cooperatively drive away competing tribes from valuable resources. The efficiency with which greater levels of cohesion confer advantage in battle is determined by a parameter L, representing the Lanchester Law Exponent, developed by military theorist Frederick Lanchester (1956), who mathematically described the advantage in combat power enjoyed by a fighting force able to coordinate their behavior over an equally-sized force unable to do so. According to Linear Law, the combat power of a force which is unable to concentrate their offensive capabilities grows linearly with their number; i.e., an exponent equal to 1. The combat power of forces which are able to concentrate their attacks on designed targets, however, is presumed to increase with the square of their number, or an exponent of 2. Other benefits of proximity to tribe members include the ability to use local resources more efficiently by cooperating.
These theoretical perspectives suggest several empirical hypotheses to be tested by the present model:
Hypothesis 1: Bellicosity and cooperation exert independent, reciprocal effects on each other. The costs of violent conflict will fall disproportionately on cooperators, thus generating negative selection pressures on cooperation. Yet, the greater opportunities within-group cooperation creates for individuals to promote their selfish interests through inter-group conflict will drive increased bellicosity. Accordingly, since cooperation will yield critical advantages in combat, cooperation will still persist despite the direct fitness costs to cooperators.
Hypothesis 2: Clustered verses homogeneously distributed resources will have differential effects on cooperation and conflict. While warfare may drive the emergence of cooperation, this relationship will vary depending on the shape and character of the resources over which violent conflicts are waged. Since clustered resources are more able to be monopolized and controlled through collective action than di use resources, their benefits will be disproportionately enjoyed by more internally-cooperative but externally-bellicose tribes. Accordingly, greater scarcity of the clustered resource (water), rendering them less di use, will increase both cooperation and bellicosity.
Hypothesis 3: The ability to coordinate violent action conditions the relationships described in hypotheses 1 and 2. Human cooperation is defined not only by the quantity but the quality of collective action. In the traditional, game-theoretic model of cooperation we measure an individual’s willingness to forego certain benefits— or place some benefits at risk—in order to resolve some collective problem depending on others’ similar decisions. This model is used to describe potentially cooperative interactions between everything from prisoners in jail cells to microorganisms (Zinser & Kolter 2004). Yet cognitively complex, cultural beings such as humans are able to structure the actions of their constituent individuals in concert to generate exponentially greater benefits of cooperation.
Model
The proposed model is a computational, multi-agent based simulation of the co-evolution of intragroup cooperation and inter-group competition, which I call tribalism. In sum, this simulation is designed to test the hypothesis that realistic conflict over resources could have played a role in the evolution of tribalism as an organizing principle of human cooperation in the face of environmental challenges.
The main challenge associated with hypotheses concerning evolutionary processes is that evolution can be extremely challenging to observe empirically, especially with long-lived species like humans. Multi-agent simulation (MAS) has been used productively to study evolutionary processes in the social sciences sciences and beyond since Axelrod’s seminal “prisoners’ dilemma” tournament (Axelrod & Hamilton 1981; Seltzer & Smirnov 2015; ten Broeke et al. 2016; Johnson & Smirnov 2018). MAS is a quasi-empirical methodology in which data are “collected” from a simulated world operating according to the physics (or rules) the researcher specifies. Simulations allow us to view the world that would exist if our models were correct and complete. In other words, they allow us a glimpse at what the world would look like if it worked the way we suppose it does. Simulation can play an important role in the scientific process because it allows us to rigorously examine the implications of our assumptions in ways that, for reasons of inherent complexity and our susceptibility to biased reasoning, would be too much to expect from a human mind. Quoting Epstein (1999), the canonical agent-based experiment is as follows:
“Situate an initial population of autonomous, heterogeneous agents in a relevant spatial environment; allow them to interact according to simple, local rules and thereby generate—or ’grow’—the macroscopic regularity from the bottom up.”
Simulation design
The simulation was implemented in Python 2.7 and executed on the high-performance computing cluster at the University of Nevada, Reno. It takes place on a two-dimensional spatial grid of dimension S x S with boundaries. Each grid cell has a host of properties, including an amount of pasture and water. For the amount of water to be greater than zero, there must be a well, which occurs randomly at some frequency, u, at the onset of the simulation. Precipitation causes pasture to grow and wells to fill with water. Since both pasture and well water are determined by rainfall, a one-resource model may seem more parsimonious. Research from biology and behavioral ecology suggests the way in which resources are distributed over a foraging area (e.g., uniformly or clustered) could potentially impact the dynamics of cooperation (Senft et al. 1987; Waser 1988; Sterck et al. 1997; Koenig 2002; King et al. 2008; Wittig & Boesch 2003). For example, social animals like buffalo and gelada baboons who graze uniformly distributed resources of comparatively low-nutritive value may live in very large communities consisting of hundreds of animals. The level of coordination between them, however, is limited. This particular form of cooperation might be less suited in a situation where resources are distributed in clusters of comparatively high-nutritive value. Clustered resources may favor a kind of sociality that enables a number of individuals to cooperatively defend or assault a location, which could potentially be a driver of tribalism.
| Land quality | Base rate (r) bonus |
| Highest-quality | 0.5 |
| Med-high quality | 0.33 |
| Med-low quality | .16 |
| Low quality | 0 |
Climate
The amount of precipitation is determined by a dynamic climate model subject to cyclical and non-cyclical forcings of varying intensity. A sine wave function establishes a base-cycle of four “seasons” defined by the peak (wet season), trough (dry season), and the inflection points (equinoxes). Seasonality acts as a periodic deviation from a base rate R in [1; 11] of precipitation. At peak, precipitation is equal to:
| $$r + \frac{r}{e}sin(kt)$$ | (1) |
| $$r + \frac{r}{e}sin(kt) - v[r + \frac{r}{e}sin(kt)]$$ | (2) |
In addition, the simulation provides for variance in land quality. Specifically, land quality may decrease in quality from “left” to “right” on the cell matrix, radially from the centroid, or in quarters (according to the schedule in Table 1). At the start of the simulation one of four configurations (including the default homogeneous configuration) is randomly determined.
Agents and tribes
Agent attributes
For agents, the size of their herd is critical for increasing chances of reproduction and giving its offspring the biggest chance for its own success. Importantly, agents are also characterized by a tribal affiliation. While the agents think and act on their own, their actions have an impact on their tribe, the cumulative effects of which can indirectly affect them. Agents not only interact with the environment but also with each other when they find themselves co-located. Accordingly, each agent possesses a heritable behavioral strategy \(c \in [0, 1]\) corresponding to a propensity to cooperate with their fellow tribesmen.
Agents maximize the health of their herds by ensuring their herds are neither too hungry nor too thirsty. At any given time a herd’s hunger is \(f \in [0, 1]\), where a value of \(0\) indicates that the animal is perfectly starved and a value of \(1\) indicates it is perfectly satisfied nutritionally. Similarly, thirst \(w \in [0, 1]\) where \(0\) is perfect dehydration. The quantities of food or water an agent’s herd demand are equal to the number of animals in the herd multiplied by \(f\) and \(w\), respectively. The size of an agent’s herd determines their social status within their tribe, and in turn their chances of reproductive success. This elaborated below.
Herd hunger: \(f \in [0, 1]\)Herd thirst: \(w \in [0, 1]\)
Herd health: \(\frac{Herd hunger + Herd thirst}{2}\)
Demanded food: \(f * Herd size\)
Demanded water: \(w * Herd size\)
Prospecting
In each time period, \(t\), agents survey the environment of the cell they currently occupy as well as the eight surrounding cells. A multinomial probability distribution is then assigned over the set of tiles based on the expected utilities associated with each. Utilities are in terms of expected health outcomes for an agents’ herds, as determined by each cell’s ability to satisfy the nutrition and hydration its animals require. In order to generate the set of expected utilities, the agent imagines itself moving to (or staying in) each of the nine cells and projecting outcomes at that location. They take into account the tribal affiliation of the occupants, whether interactions are likely to be cooperative or conflictual, and, if conflictual, how well o they are likely to emerge from the conflict. There are three possible cases:
Agent will occupy cell alone: They will be free to consume whatever resources their herds demand and leave what remains (if any).Agent will occupy cell with fellow tribesmen only: Resources within the cell are initially distributed equally across the \(n\) co-located tribesmen, which becomes each individual’s endowment, \(g\), in a standard public goods game (PGG). For the PGG, each tribesman’s contribution, or e ort, level is determined according to their propensity to cooperate \(c \in U[0, 1]\). The sum of collected proceeds are multiplied by a benefit of cooperation \(b \in U[1,10]\), redivided evenly across the participants, such that agent \(i\)’s payoff is described by:
| $$\Pi_i = \frac{1}{n}\sum_{n}^{i} bgc_{i}$$ | (3) |
Agent will occupy cell with at least one out-tribesmen: When agents from multiple tribes are present, the agent imagines two scenarios: A) peaceful coexistence or B) conflict. In the case of peaceful existence, all available resources are distributed equally to all tribesmen from all tribesmen. All agents participate in PGGs with their own tribesmen, but not with members from other tribes. However, if the agent deter-mines that his tribe (or another tribe) is likely to fight for the entire share of the available resources, they will generate an expected payout, which is the product of their possible payoff if their tribe hoarded all of the resources available and the tribe’s probability of victory in battle.
Agents generate a vector of expected utilities, \(VU\), from the nine cells based on these estimations. However, the actual value of the cell will also be affected by its proximity to water, and agents must take this into account. Accordingly, the agent also generates a corresponding vector of weights, \(VW\), based on each cell’s “water value.” Note that the water value is a summation of all wells on the map, implying that even cells devoid of water—even in the middle of 8 more cells without water—will still have a calculated water value insofar as it may lie on a path to water beyond. The formula for water value is as follows:
| $$VW_{cell} = Thirst \sum_{well} \frac{(q_{well}/n_{well})}{d_{well}^{2}}$$ | (4) |
The vector defining the multinomial probability distribution (\(VN\)) over each of the \(9\) cells is therefore:
| $$VN_{cell} = \frac{VU_{cell} VW_{cell}}{\sum VU_{cell} VW_{cell}}$$ | (5) |
A random draw from this distribution determines an agent’s location in each subsequent time period.
Metabolism
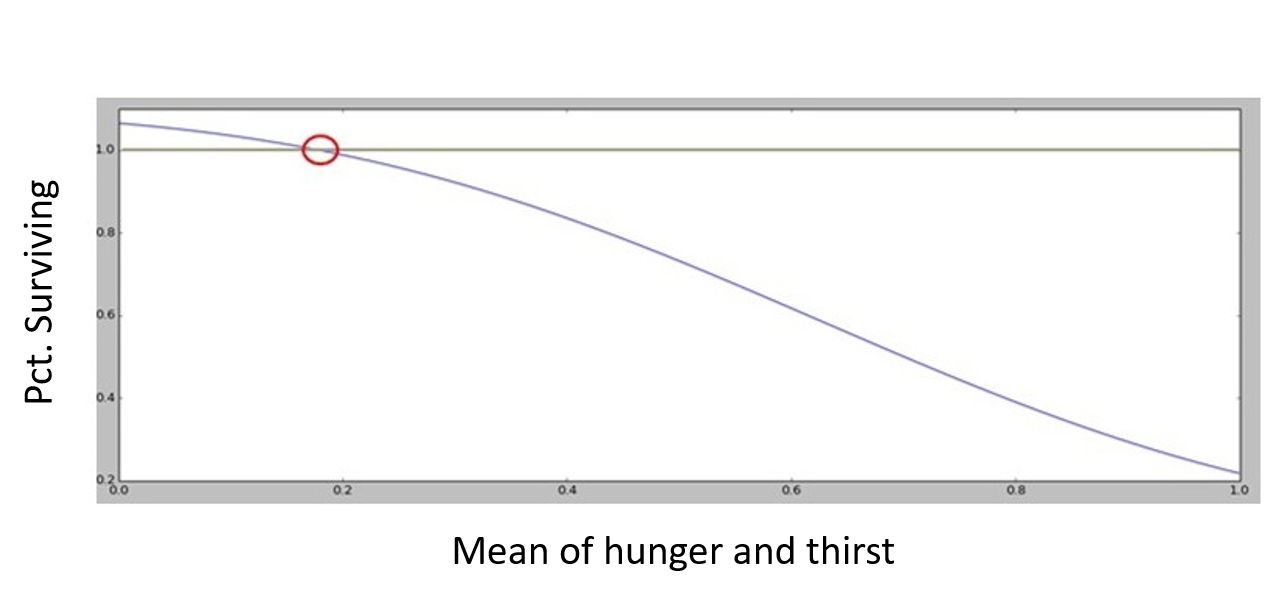
Every time period, the hunger of an agent’s herds increases by \(u\) and their thirst increases by \(h\). The longer they go without food or water, the more likely it will be that they die. The rate of herd exhaustion is calculated according to a survivor function of the form:
| $$\%Surviving_{agentsherd} = 1 + l - e^{-[1.5 - (u_{i} h_{i})^{3}]}$$ | (6) |
Where drought tolerance, \(l\), is a global variable determining how long an agent’s herds may go without food or water before it begins to incur losses. Figure 1 depicts the functional form with \(l = 0.1\).
Like the real world, agents are independent actors nested inside higher-order units of aggregation. The attributes of tribes are constituted from aggregations of actions their members take. A tribe’s attributes, how-ever, may have an indirect impact on what its members are able to do in the future. A key tribal attribute is its cohesion. Cohesion is calculated as the average proportion of resources agents contribute in public games with their fellows, or the mean propensity of a tribe’s members to cooperate, as in:
| $$Tribe A's cohesion = \frac{1}{n_A}\sum_{n_A}^{i} c_{A_i}$$ | (7) |
Inter-tribal conflict
Strong, cohesive tribes have the ability to forcefully monopolize resources, ensuring their members larger re-source shares than if they had to be split across two or more tribes. Further, a low probability of successfully dislodging a stronger tribe from a resource may deter weaker, less cohesive tribes from attempting it.
When there are members of two or more tribes located in a single cell, they may either “share” the resources or “fight” for them. Sharing resources means that they all just take their share, which they will use as their endowment, \(g\), to play with in a public goods game if any fellow tribesmen are present. This decision to fight or share is made “collectively” by the tribesmen of each tribe. If the “average tribesmen” is better o fighting, then the tribe fights. If one tribe in any dyad decides to fight, then they will fight. Importantly, all the tribesmen in a tribe participate in the battle, even if not located on the contested tile. To account for the fact that more distant agents may have less influence on the battle (perhaps due to communications or transportation difficulties), their contribution to a side’s fighting power diminishes with the inverse of their distance. A tribe decides to fight when:
| $$EU(fight) > EU(share)$$ | (8) |
| $$EU(fight) = FH_{All Resources Gained} * Pr(victory) + FH_{No Resources Gained} * [1 - Pr(victory)]$$ | (9) |
| $$Pr(victory_{A}) = \frac{pow(Tribe_{A})}{pow(Tribe_{A}) + pow(Tribe_{B})}$$ | (10) |
A tribes fighting power \(pow\) is determined by:
| $$pow(Tribe A) = (\frac{C_{A}S_{A}}{D_{A_{xy}}})^{L}$$ | (11) |
\(C_{A} =\) Tribe A’s cohesion,
\(S_{A} =\) tribe A’s size,
\(D_{A_{xy}} =\) mean distance of Tribe A’s members to cell \((x,y)\), and
\(L =\) Lanchester Law of Combat (linear or square law).
The \(L\) parameter, or the Lanchester Law, comes from World War I era military theorist Frederick Lanchester’s Laws of Combat (Lanchester 1956). Among these are the Linear Law for ancient combat and the Square Law of modern combat. In what Lanchester refered to as “ancient combat,” soldiers in tight formation, equipped with spears or swords, are essentially only able to fight one man to a man. Thus, a side’s fighting potential may be said to increase linearly with the number of soldiers. However, under so-called “modern” conditions with ranged weapons or in other cases where targeting may be concentrated, power is said to increase with the square of the number of units. Johnson & MacKay (2015) detail how human ancestral warfare is best characterized by the Square Law, suggesting a mechanism by which human evolution was potentially adapted to it. In practical usage, it is common for analysts to use an intermediary exponent like \(1.5\) because it is assumed that combat will be a mixed bag of linear and square elements.
Death in combat
While agents can only indirectly influence whether their tribe engages in combat, they are still obligated to participate. An agent’s (per time period) probability of meeting a violent death is determined according to the function:
| $$Pr(violent death_{i}) = 1 - y^{z_{i, tribe}h_{i, tribe}c_{i}}$$ | (12) |
Reproduction and cooperative breeding
A basic premise of multilevel selection is that while some inter-group competition exists, mate selection is primarily an intra-group process. In this model, agents’ likelihood of reproducing is a function of their standing within their own tribe as determined by the size of their herds. The probability of reproduction in time, \(t\), is given by:
| $$Pr(Reproduce_{i}) = MateScore_{i} * (BirthRate_{base} + CooperativeBreeding_{bonus})$$ | (13) |
| $$MateScore_{i} = (\frac{n_{i, tribe} - rank_{i}}{n_{i, tribe}})^{MateCompetitionSeverity}$$ | (14) |
| $$CooperativeBreeding_{bonus} = BirthRate_{base} * Cohesion_{i, tribe} * EffectSize_{base}$$ | (15) |
Within each tribe all tribesmen are arranged in reverse order according to the size of their herds. This is their raw rank which is normalized by the total number of tribesmen in order to get their percentile rank score. I include one additional parameter, the mate competition severity factor (MSF) \(\in U[1, 2]\), which allows me to control the “intensity” of mate competition. When MSF = 1, mate score decreases linearly with rank. When MSF = 2, mating potential decreases exponentially with rank. This value is compounded by the global parameter, natural birth rate. However, cooperative breeding practices may actually enable a tribe to achieve a birth rate greater than the “natural rate.” Thus, this rate is increased by the cooperative breeding bonus (CBB) \(\in U[1, 4]\), which is equal to the natural birth rate times the level of a tribe’s cohesion, multiplied by an additional global parameter moderating this bonus effect. If the bonus effect is 0, then there is no cooperative breeding bonus. When the bonus effect is 1, the effective birth rate of a perfectly cohesive tribe (cohesion = 1) will be exactly 2 times the natural rate.
The final result is a value bounded \([0, 1]\) unique to every agent, which is treated as a probability of reproduction. All agents in all tribes have a chance to reproduce, but the size of probability is determined only in comparison to fellow tribesmen. The most cooperative tribes get a bonus to birth rate because I assume that cooperative breeding practices enable them to have more babies.
When an agent reproduces, the offspring emerges as a fully formed adult agent and inherits a number of its parent’s herd equal to the endowment factor, \(o\), times its herd size (equivalent of a dowry). Therefore, the size of the new agent’s initial endowment is proportional to the economic success of the parent. This ensures that even though poorer tribes, ceteris paribus, are equally likely to produce offspring as wealthier ones, the offspring of wealthier tribes are going to have a better chance at survival since they are able to provide their offspring with larger number of herds.
Other modeling factors
Gene flow
In order to account for gene transfer between groups, agents probabilistically transfer to another tribe (change tribal affiliation) according to a probability, \(g\), per round. Accounting for gene flow between groups not only reflects nature but is necessary to ensure selection remains on the individual by not exaggerating between-group variances (Rogers 1990; Hamilton 1964). This is a global variable, with a default value of 5% chance of migrating within a 20 time step period, or 0.025% per time period. The reader should note that in terms of the program coding, when an agent “migrates,” the only thing that happens is its tribal identification changes. The agent is not “transported” anywhere. Whether the agent subsequently proceeds in the direction of its new fellows is “up to them,” i.e., it is an emergent outcome of the simulation.
Mutation
Every round agents will "mutate" with probability \(m\). In practical terms, this means that mutating agents’ propensity to cooperate with their tribesmen \(c\) is redrawn randomly from the initial distribution \(U[0, 1]\). This is done in order to prevent convergence on local maxima and to ensure a degree of adaptive plasticity in response to dynamically changing social and environmental circumstances.
Tribe splitting and dissolution
Anthropologist R.I.M Dunbar established encephalization quotient (brain mass to body size ratio) as a constraint on primate group size (Dunbar 1992). For humans, Dunbar’s formula predicts an expected upper-bound on group size of approximately 150 individuals with a confidence interval of 100 to 230 (Dunbar 1993). Beyond this, communities may split, or “fission” into smaller groups (Neves 1995; Bowles et al. 2003; Chagnon 1968). Empirical studies of human social network size across diverse contexts, including extant hunter-gather societies, affirm mean size below Dunbar’s threshold (Hill & Dunbar 2003; Hill et al. 2011; Allen 2005). Accordingly, if a tribe's membership exceeds \(K_{max}\), a tribe will fission into two tribes. \(\frac{K_{max}}{2}\) agents will be selected at random to form a new tribe. If a tribe's membership drops to \(0\) it is considered dissolved and removed from the simulation.
Data
In order to examine the implications of this model I employ Monte Carlo simulation methods in which the simulation is repeated many times with randomized parameterization. Though the simulation was initialized five million times, in most instances of the simulation the parameterization resulted in an environment so severe that all agents died out. In such cases, the simulation is terminated and reinitialized with a new set of parameter values. Of the total initializations, agents survived through 10,000 time periods in 18,235 cases. This threshold (10,000) was chosen to ensure outcomes are evolutionarily stable traits given the input parameters. In several test-simulations with varied parameterizations evolutionarily stable equilibria were observed after approximately 2500 time periods.
For the present study, the two outcomes I am most interested in are the prevalence of cooperation and the frequency of conflict. In order to assess their respective relationships to the environment and to each other, I model them together in a system of two simultaneous equations, which I estimate using a Three-stage Least Squares (3SLS) estimator (Zellner & Theil 1962). Like a Two-stage Least Square estimator, the 3SLS allows flex-ible instrumentation to deal with endogeneity but has the additional advantage of taking into account covariances in the disturbances across all equations in the system, which are estimated simultaneously.
The subsequent analysis will be derived from five specifications of the 3SLS estimator. These include a linear model assessing direct relationships (Model 1) and four multiplicative specifications exploring inter-dependencies in the data (Model 2-5). Whereas Models 2 and 3 explore conditioning effects of factors reducing the burden of warfare on cooperators (alternatively making warfare less costly or more rewarding for cooperators), Models 4 and 5 will focus on the conditioning effects of resource distributions.
Table 2 presents the summary of statistics of major input and output parameters of the simulation from all 18,235 cases that completed 10,000 time periods. Output parameters represent their mean values over the final 500 time periods of each simulation.
Cooperation and conflict
Linear 3SLS model
Table 3 presents the results of the linear 3SLS statistical model. As predicted, bellicosity and cooperation exhibit independent, direct effects on each other. Fighting more, ceteris paribus, implies dying more. The most patriotic, altruistically self-sacrificing warriors will in turn die with the greatest frequency. Accordingly, it makes sense that war frequency should negatively impact cooperation, assuming cooperation is a heritable trait. A one standard deviation increase in bellicosity corresponded to a roughly 6% decrease in average cooperation propensity (coef. = 0.0002, \(p<0.001\)), while cooperation increases bellicosity by roughly 1.4 standard deviations across the full range of cooperation (coef. = 314.3, \(p<0.001\)).
Disentangling this endogenous relationship requires some careful consideration of interactions between these variables and others. Before I discuss, it will be worthwhile to note that certain covariates exert substantively significant direct influences on the evolution of cooperation. Food consumption (coef. = 0.4286, \(p<0.001\)) and water consumption (coef. = 1.5632, \(p<0.001\)) rates are large (i.e., the amount of food and water an agents’ herds must consume per time period in order to maintain their health). Across the range of these variables, estimated increases in mean cooperation propensity are 10% and 38% respectively. The value of the Lanchester Law Exponent—moving from the linear to Square Law—is significant and in the expected direction, though is substantively small. Not surprisingly, the coefficient on average group size is negative. This is consistent with the general rule dating back to Olson (1965) that collective action becomes increasingly difficult to maintain as group size increases. At extreme values, tribe size can decrease cooperation by as much as 45%. The lethality of combat, y, is deleterious to cooperation. Across the range of values (death rates ranging from 0.03 to 0.2), the disproportionately high costs of war to cooperators results in a roughly 19% decrease in cooperation. This finding is consistent with Smirnov et al. (2007) and Bowles (2006) who have sought to explain the evolution of cooperation in the presence of these fitness costs to cooperators, appealing to “reproductive leveling” (fitness compensation in the form of privileged access to resources or mates) as a means to evolutionarily compensate individuals for selfless acts. This model, however, contains no such feature. Lastly, well frequency, \(u\), had a statistically and substantively significant effect on cooperation (coef. = -0.3712, \(p<0.001\)), decreasing it by as much as 6% across its range.
| Variable | Mean | Std. Dev. | Min | Max |
| Input parameters | ||||
| Starting population | 500.000 | 0.000 | 500.000 | 500.000 |
| Lanchester Law exp. (L) | 1.502 | 0.288 | 1.000 | 2.000 |
| Benefit of cooperation b | 5.551 | 2.585 | 1.001 | 9.999 |
| Combat lethality (y) | -0.888 | 0.049 | -0.970 | -0.800 |
| Well frequency (u) | 0.156 | 0.034 | 0.050 | 0.200 |
| Base rate (r) | 6.839 | 2.329 | 2.000 | 10.000 |
| Seasonal extremity (e) | 2.522 | 0.859 | 1.000 | 4.000 |
| Drought frequency (q) | 0.248 | 0.144 | 0.000 | 0.500 |
| Drought severity (v) | 0.148 | 0.087 | 0.000 | 0.300 |
| Season length (k) | 9.991 | 3.153 | 5.000 | 15.000 |
| Cycle length (d) | 27.833 | 14.178 | 4.000 | 52.000 |
| Food consume rate (f) | 0.142 | 0.068 | 0.050 | 0.300 |
| Water consume rate (w) | 0.072 | 0.022 | 0.050 | 0.294 |
| Mate competition | 1.500 | 0.289 | 1.000 | 2.000 |
| Birth rate | 0.126 | 0.041 | 0.050 | 0.200 |
| Cooperative breeding bonus | 2.473 | 0.864 | 1.000 | 4.000 |
| Mutuation rate (m) | 0.006 | 0.003 | 0.001 | 0.010 |
| Migration rate (g) | 0.001 | 0.001 | 0.000 | 0.002 |
| Heterogenous land quality | 0.745 | 0.436 | 0.000 | 1.000 |
| Drought tolerance (l) | 0.033 | 0.016 | -0.043 | 0.050 |
| Max tribe size | 155.612 | 54.592 | 60.000 | 249.000 |
| Dowry size (o) | 0.312 | 0.113 | 0.100 | 0.500 |
| Output parameters | ||||
| Cooperation | 0.185 | 0.153 | 0.001 | 0.874 |
| Bellicosity | 137.416 | 276.879 | 0.000 | 5095.258 |
| Num. of tribes | 10.023 | 9.825 | 1.000 | 135.462 |
| Avg Tribe Size | 46.300 | 15.818 | 14.148 | 171.470 |
| Avg num of animals | 32.317 | 26.255 | 4.588 | 606.891 |
| Pasture supply | 32.342 | 21.179 | 2.398 | 154.444 |
| Water supply | 8.287 | 4.939 | 0.006 | 34.810 |
| Avg age | 19.100 | 4.209 | 8.226 | 46.519 |
| Total population | 452.464 | 434.438 | 18.838 | 4401.540 |
The effect of climate model on cooperation yielded the expected result of more cooperation under overall conditions of greater scarcity and volatility, as cooperation makes greater use of fewer resources (base rate, \(r\), coef. = -0.0127, \(p<0.001\); drought frequency, \(q\), coef. -0.0128, \(p<0.001\)). Interestingly, the extent of volatility made little difference. While the coefficient on drought frequency was statistically significant, the effect was very small, increasing cooperation by less than a percent across its range. Further, the other climate parameters describing duration and depth of climate anomalies (cycle length, \(d\), and drought severity \(v\)) were not significant.
On the bellicosity equation, the largest, most important driver of conflict was cooperation. As mentioned above, a 1-unit increase in cooperation yields an increase in bellicosity about 1.4 times its standard deviation. Population density, or the overall number of agents in the simulation, also had a substantively large effect with a one standard deviation increase in population leading to an increase in bellicosity also by about one standard deviation (coef. = 0.5780, \(p<0.001\)). Though the number of violent conflicts per time period reached values as high as 5000, roughly 90% of them had values under 350. A one standard deviation increase in population (434 agents) corresponded to an increase of roughly 272 conflicts per period. Interestingly, the number of tribes present had less of an effect than expected. While one would expect the overall fractiousness of the population to result in a large increase conflict, the coefficient is relatively small (coef = 2.580, \(p<0.001\)). A one standard deviation increase (approximately 10 tribes) predicts an increase of only 25.5 violent conflicts per period. Taking these last two estimates together, it would appear that the size of the population relative to the space available matters more than the fractiousness of the population. In other words, many smaller tribes seemed to coexist peacefully when land and water were plentiful for all, but even a smaller number of very large tribes pushing the limits of carrying capacity results in frequent conflict.
| Model 1 | Model 2 | Model 3 | Model 4 | Model 5 | ||
| Cooperation | ||||||
| Bellicosity | -0.0001639*** | -0.026714*** | -0.2842676*** | -0.1014118*** | -0.018139*** | |
| Well frequency (u) | -0.3712293*** | -0.5863701*** | -0.5936828*** | -60.41183*** | -0.3173418*** | |
| Avg Tribe Size | -0.0025722*** | -0.0023838*** | -0.0025811*** | -0.0028191*** | -0.002795*** | |
| Lanchester Law Exp. (L) | 0.0162534*** | 0.0157819*** | -25.52794*** | -6.612187*** | -1.010469*** | |
| Comb. Lethality (y) | -1.085992*** | 3.54493*** | 44.39583*** | -0.6649287*** | -0.7068974*** | |
| Seasonal extremity (e) | -0.0008587 | 0.0021495 | 0.0057071 | 0.0023747 | -0.0034878*** | |
| Base rate (r) | -0.0126657*** | -0.0152025*** | -0.0165829*** | -0.0108617*** | -0.0235377 | |
| Drought severity (v) | 0.0079638 | 0.0511799*** | 0.0424908 | -0.0759284* | 0.0089069 | |
| Season length (k) | 0.0003261 | 0.0009119* | 0.0034648*** | 0.0012449 | 0.0007353 | |
| Drought frequency (q) | 0.0128327** | 0.0589534 | 0.0420838* | 0.0331438 | 0.0263535** | |
| Benefit of cooperation b | 0.0031503*** | 0.0000493 | 0.0041699*** | 0.0029361** | 0.0009979 | |
| Food consume rate (f) | 0.4286318*** | 0.5986323*** | 0.5556066*** | 0.4063666*** | 0.4994975*** | |
| Water consume rate (w) | 1.563247*** | 2.170831*** | 2.051765*** | 1.525803*** | 1.685632*** | |
| Cycle length (d) | -0.000087 | -0.0001247 | -0.0000354 | -0.0000328 | -0.0001829 | |
| Mate competition | 0.0084432*** | -0.0073032 | -0.0125412 | -0.0329648*** | -0.0014712 | |
| Cooperative breeding bonus | -0.005041*** | -0.0088007*** | -0.0053601 | -0.0054004 | -0.0017749 | |
| Drought tolerance (l) | -0.2651064*** | -0.8446499*** | -0.7068031*** | -0.2659079 | -0.3598147*** | |
| Heterogenous land quality | -0.0204746*** | -0.0203238*** | -0.0013621 | -0.0047486 | -0.0521827*** | |
| Bellicosity * lethality | -0.0299954*** | -0.3193699*** | ||||
| Bellicosity * lanchester | 0.1818708*** | 0.0654974*** | ||||
| Lethality * lanchester | -28.79058*** | |||||
| Bellicos * lethality * lanchester | 0.2043879*** | |||||
| Well Freq. * lanchester | 38.86287*** | |||||
| Bellicosity * Well Freq. | 0.5840004*** | |||||
| Bellicosity * well freq. * lanch | -0.3774463*** | |||||
| Pasture supply | -0.0419336*** | |||||
| Bellicosity * pasture | 0.0006006*** | |||||
| Bellicosity * pasture | 0.0116248*** | |||||
| Pasture * lanchester | 0.0278248*** | |||||
| Bellicos. * pasture * lanchester | -0.0003841*** | |||||
| Constant | -0.6873299 | 3.414563***td> | 39.62665*** | 9.958874*** | 1.283321*** | |
| Bellicosity | ||||||
| Cooperation | 314.3266*** | 966.6932*** | 962.3234*** | 980.7654*** | 976.0153*** | |
| Well frequency (u) | -291.9084*** | -110.9213*** | -117.0295*** | -112.5058*** | -107.5332*** | |
| Total Population | 0.5779894*** | 0.7173937*** | 0.7111606*** | 0.7142223*** | 0.7194579*** | |
| Num. of tribes | 2.580215*** | -0.4436593* | -0.1341061 | -0.1741902 | -0.499505** | |
| Seasonal extremity (e) | -1.223169 | -1.056666 | -1.052289 | -1.04591 | -1.051812 | |
| Base rate (r) | 2.926483*** | 11.46028*** | 11.36792*** | 11.60601*** | 11.59171*** | |
| Drought severity (v) | -0.0394696 | -12.19516 | -11.83829 | -12.14197 | -12.39185 | |
| Season length (k) | -0.5328873** | -0.7809184** | -0.7810466** | -0.7883264** | -0.784342** | |
| Drought frequency (q) | 0.280394 | -7.082014 | -7.042507 | -7.254079 | -7.193158 | |
| Cycle length (d) | -0.0195646 | -0.028632 | -0.0284453 | -0.0284759 | -0.0287586 | |
| Food consume rate (f) | -86.31082*** | -369.4907*** | -366.0032*** | -373.87*** | -373.9787*** | |
| Water consume rate (w) | 666.8586*** | -177.4875*** | -161.7786*** | -184.5019*** | -191.4374*** | |
| Drought tolerance (l) | -485.3029 | -409.4009 | -418.331 | -417.1497 | -406.7524*** | |
| Heterogenous land quality | 47.20934*** | 66.21061*** | 66.14901*** | 66.6963*** | 66.47868 | |
| Constant | -229.0204*** | -379.2897*** | -378.5344*** | -382.8101*** | -381.3864*** | |
| Significance levels: \(^{\ast}\) p < 0.1; \(^{\ast}\)\(^{\ast}\) p < 0.05; \(^{\ast}\)\(^{\ast}\)\(^{\ast}\) p < 0.01 | ||||||
The climate model had little direct impact on bellicosity. Base rate, \(r\), and season length, \(k\), were statistically significant, but not large enough to be substantively important. However, despite little evidence that the climate directly increased bellicosity, the character of the agents relationship to the environment did. In particular, the rate at which agents’ herds consumed water greatly increased bellicosity (coef = 666.9, \(p<0.001\)), as did the rate at which they expire when food and water are unavailable (coef = -485.3, \(p<0.001\)). This affirms the intuitive presumption that material desperation—the condition where resource scarcities have a large, direct impact on survival—is a driver of conflict.
Multiplicative models
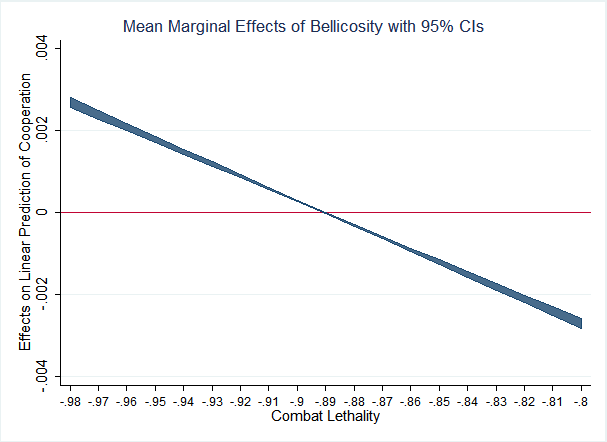
In order to tease out the complexities of the relationship between cooperation and bellicosity, it is necessary to consider its potential dependencies on other variables. In Model 1, we observe that bellicosity has a direct, negative effect on the propensity of agents to cooperate with each other of roughly 6% per standard deviation. While statistically and substantively significant, this seems smaller than one would likely expect given the dis-proportionate sacrifice (often the ultimate sacrifice) cooperators make on behalf of their tribes during times of war. Accordingly, Model 2 (Table 3) includes a two-way interaction term between bellicosity and combat lethality. Figure 2 presents the marginal effects of bellicosity on the evolution of cooperation at varying levels of combat lethality. The downward slope of the interaction crosses zero, suggesting that when combat fatalities are rare, the advantages tribes can realize through initiating conflict with other tribes easily outweighs the risks to their most altruistic members. In fact, the coefficient is roughly an order of magnitude larger than the direct, negative effect predicting an increase of 77% in cooperation propensity (across one standard deviation of bellicosity) when combat lethality approaches zero. Alternatively, when combat lethality is highest the effect is the opposite, decreasing cooperation by roughly the same amount. Intuitively, this makes sense because in the former case cooperative tribes receive the benefits generated by their altruistic tribesmen, benefiting everyone, including the altruists, while not placing the altruists at an adaptive disadvantage with regard to their more selfish fellows. When that cost is fully realized, however, inter-group conflict cannot be an explanation for the evolution of cooperation.
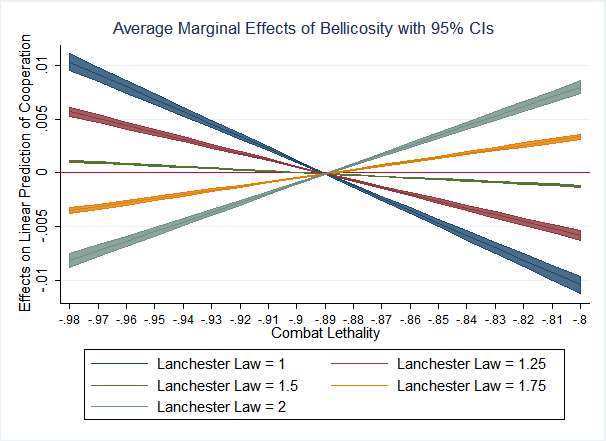
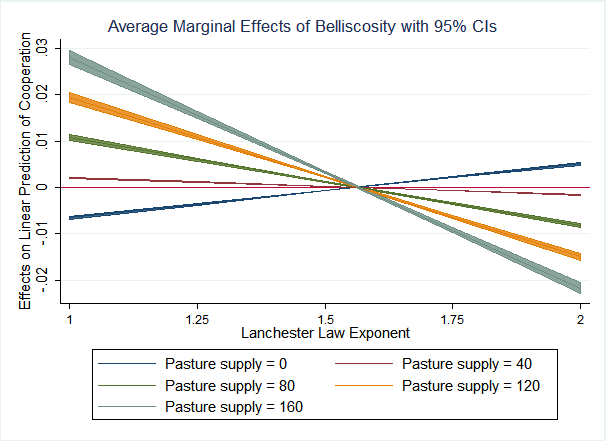
But what this analysis fails to take into account is the character of the advantage cooperation yields to the cooperative tribe. Figure 3 depicts the marginal effect of bellicosity on cooperation at levels of lethality (Model and also how this relationship changes as a function of the Lanchester Law Exponent (i.e., the three-way interaction). Model 2 seems to typify the relationship when agents possess no ability to coordinate their attacks, essentially each fighting independently. In such tribes, the gains from cooperation in combat are likely realized in the form of larger tribes, since under the Linear Law a tribe’s fighting power increases linearly with number and greater cooperation will generally enable more efficient usage of resources and larger tribes. Accordingly, this positive effect evaporates under the Square Law (\(L = 2\)). Under the Square Law, the advantage cooperation brings to the battlefield strongly moderates the relationship between bellicosity and cooperation. When tribes can coordinate their actions on the battlefield and warfare is constant and pervasive, tribes stand together or die together in warfare. Because the coefficient is negative at low lethality and under the Square Law, these data suggest that the advantage cooperation yields by allowing larger tribes is wiped out entirely; even larger but uncooperative tribes are defeated by tribes whose strength grows exponentially.
If the above analysis assesses the conditionality of the relationship between bellicosity and cooperation from a “supply-side” perspective (i.e., by taking into account the costs and forms of cooperation supplied), another way to look at it may be the “demand-side” of the equation. Accordingly, Models 4 and 5 consider the character of the resources under contest. Figure 4 depicts the two-way interaction of bellicosity and the Lanchester Law Exponent as a function of well frequency (a three-way interaction). Functionally, the well frequency parameter determines the mean distance between wells, implying that as the well frequency increases the resource becomes increasingly homogeneous, or de-clustered. At \(u = 0.17\), the probability of there being at least one well within the nine tiles surrounding (or underneath) a given agent is approximately 81%, with a 47% chance of there being more than one. For comparison, at \(u = 0.05\) the probability of there being at least one well within the nine tiles drops to 37%, with a 7% of more than one. Hypotheses 2 states that when resources are clustered, the ability to engage in concerted action to secure those resources will be paramount. Consistent with this hypothesis, when resources are most clustered (\(u = 0.05\)) the Lanchester Law Exponent fully moderates the marginal effect of bellicosity on the evolution of cooperation. In other words, when resources are clustered and tribes can employ concerted, violent action to take and monopolize those resources the frequency of warfare is an evolutionary driver of cooperation. Note that as \(u\) increases and the resource is de-clustered, the marginal effect of bellicosity on cooperation approaches zero. In this regard, the effect is fully moderated.
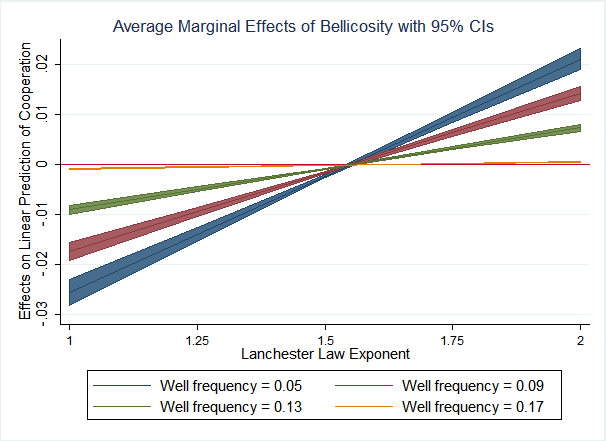
Setting the question of heterogeneity aside, what are the implications of changes in the quantity of resources independent of their distribution? Model 5 estimates a three-way interaction between bellicosity, the Lanchester Law Exponent, and pasture availability. This measure is essentially “how much is there?” as opposed to “where is it?” Figure 5 depicts this three-way interactive prediction of cooperation. Interestingly, we observe a mirrored, opposite relationship for quantity of resources compared to resource clustering. When food is scarce, the ability to organize and coordinate in battle yields no changes in the marginal effect of bellicosity on the evolution of cooperation. The clearest explanation for this is that when resources are inadequate to sustain tribespeople living in close proximity to one another, the tactical advantage of coordination cannot overcome the advantage of superior numbers. Accordingly, under the Linear Law (when agents cannot coordinate on the battlefield), the primacy of superior numbers drives cooperation as a means for more efficiently allocating re-sources and achieving higher relative densities than a tribe’s adversaries. At the bottom right quadrant of Figure 5, we see significant, negative coefficients under circumstances of high food availability and the Square Law of Combat. In this case, the advantage of absolute numbers in combat diminishes, but so does the reward/risk ratio of going to war over an abundant resource easily obtained elsewhere. Cooperators in a tribe are subject to rapidly diminishing returns on their altruistic investment in their fellows, and thus we see negative selection on cooperation.
Discussion
This study modeled the evolution of tribalism under pastoralism. While pastoralism may not perfectly characterize either the hunter-gatherer environment in which humans evolved or the modern world, it inspires a more focused, simplified meditation on the fundamental role of the environment on social processes. Taken as a whole, these results support the view that tribal systems emerge from dynamics associated with multilevel selection, which not only have implications for how we think about inter-group conflict today but also the role it may have played in the human evolutionary past.
This is evident in several ways. First, consistent with Hypothesis 1, bellicosity and cooperation exerted independent, reciprocal effects on each other; when agents were more cooperative with their compatriots, the world was more warlike. One would think that the prevalence of war would hinder the evolution of brave, altruistic warriors who disproportionately bear the costs, but circumstances of the social-ecology may amplify the rewards for inter-group violence enough to evolutionarily o set those costs.
Consistent with Hypothesis 2, the shape and character of the resources agents needed to survive conditioned the evolution of cooperation and conflict. There was a positive relationship between warfare and cooperation when resources were clustered. However, it was surprising to discover that cooperation could also evolve when resources were di use, albeit cooperation of a very different character. This leads to a critical discussion of Hypothesis 3, which suggested that the evolution of cooperation is defined not only by how much agents cooperated but also how they cooperated. A triple-interaction revealed that the moderating effect of resource distribution on the relationship between warfare and cooperation was itself fully moderated by an additional variable: the Lanchester Law Exponent. Results suggest that warfare can drive the evolution of cooperation, but the character of the resources, whether clustered or di use, profoundly shapes the kind of cooperation that emerges in ways consistent with either the Square Law or Linear Law, respectively.
In the case of more clustered resources, conflict favors smaller, more tactically cooperating tribes where guile and maneuver determine victory. In the case of more di use resources, the tribe with the largest population wins the battle. Accordingly, the present research strongly suggests that early humans were likely dependent on limited clusters of resources that could sustain a small population of highly-intelligent, coordinated cooperators able to monopolize them. Further, the simultaneous need to keep group size at or below the carrying capacities of those resources but also retain adequate combat force to secure them from rival groups likely placed selective pressure on social-cognitive and even physical abilities that allow them to coordinate more cohesively as a tactical unit (e.g., language, planning, theory of mind, anticipation of each other’s actions, culture, identity, and the ability to accurately aim projectiles from afar). When resources are di use, however, a strong, positive relationship between bellicosity and cooperation was only observed under the condition of the Linear Law of Combat. This suggests distinct mechanisms underlying the evolution of cooperation among different species facing different social-ecological challenges.
Insofar as human team sports are an exercise of these primordial abilities, it is enjoyable to imagine what team sports would be like for an intelligent race whose evolutionary ancestors instead thrived on some di use re-source. When beings evolve on di use pastures, the dynamics of inter-group conflict appear to be determined by the number of tribemembers. Greater abundance of resources allows for larger tribes and therefore driving conflict. By maximizing the number of tribesmembers and squeezing increasingly more fighters onto smaller spaces, tribes rely on brute force, rather than tactical maneuvering, to simply push competing tribes aside with their greater mass. Based on these results, strategy and teamwork in sports would not be as important as simply forming a larger team than the competitor.
Additionally, these findings have implications for the dynamics of future conflicts which may be, in part, caused by ongoing climate change and climate disruption. Resource scarcity is likely to increase the amount individuals invest in their sectarian identities to collectively secure resources, resulting in greater social fractionalization. Results suggest several possible outcomes. In one point of view, since the most ardent patriots bare disproportionate costs of violent conflict, ethnic conflict has the potential to exhaust itself. For example, the lethality of tribal raiding among the Turkana tribes is not historically high, but it has increased in recent decades with the pervasive availability of inexpensive small arms le in the region following the numerous proxy conflicts of the Cold War (Parenti 2011). Given enough time, there is a gradual decline of fighters willing to risk their lives as they die in combat, which points to a return to the more benign, largely symbolic conflict of the past. However, if climate change or misguided development policies continue to degrade the availability of critically needed water resources, such conflicts may not only escalate but accentuate ethnic and tribal divisions.
Still, greater inter-group conflict does not necessarily imply greater bellicosity, as even the simple agents populating this simulation tend to avoid violence unless it was absolutely necessary to secure the resources they needed for survival. Thus, we can expect that when competing groups have opportunities to resolve disputes through non-violent means (i.e., through more institutional, legalistic arenas for inter-group conflict), they will use them. The recent surge in so-called “identity politics” may be an expression of this. This should suggest to peace activists that the development of trusted, non-partisan institutions for conflict resolution will be vital, especially if the contested resources meet one or both of the following conditions: 1) The resources are immediately needed for the survival of a desperate group, and/or 2) the character of the resource is such that it may be “monopolized” by one group able to “lock out” others.
Where such institutions cannot be relied upon, these conclusions offer additional guidance for how more direct forms of humanitarian aid (e.g., food, medicines, clean water, etc.) are distributed in locations under acute economic disruption, whether climate induced or otherwise. Echoing recent peace and conflict research, international aid agencies may inadvertently increase the risk of violent inter-group conflict among target-populations if their distribution protocol results in “clustered” distribution channels (Nunn & Qian 2014; Wood & Sullivan 2015; Wood & Molfino 2016). Polman (2010) reports that in some cases up to 80% of food aid-shipments may be stolen en route and may still yet be confiscated by armed groups. The prospect of controlling these channels inspires turf wars between rivaling factions. When aid agencies are directing aid through state institutions, they should be wary of the sectarian dynamics of local politics and unintentionally igniting ethnic conflicts. In locations where elected o ices are largely ethnic or tribal contests, channeling aid through a government body charged with local distribution may heighten the stakes of electoral outcomes, potentially rendering a political defeat which is unacceptable to the losers, and further degrade the integrity of institutions.
Notes
- It is important to keep in mind that ‘genes’ may also be understood as strategies; ‘population genetics’ may therefore be thought of as a praxis for keeping track of strategies in a large population. Whether these strategies are coded chemically as DNA or in some cognitive capacity is not as important as how they are transferred, or replicated, within the population. The primary mechanism through which strategies are transferred between individuals is heredity. Individual agents possess an attribute, c, which discharges a particular strategy. If those individuals live longer, more prosperous lives than other individuals exhibiting alternative strategies, there will be progressively more individuals in the population exhibiting attribute c. In other words, while the details of the replication algorithm employed bear the closest resemblance to genetic evolution by natural selection, the critical idea is that successful strategies will proliferate faster than unsuccessful strategies.
Appendix: ODD Protocol
Purpose
The purpose of the model is to explore the underlying, individual-level processes by which super-identities, or groups, begin to take on behavioral aspects of agents. It does this by modeling the emergence of cooperative groups in an individual’s environment may, under certain circumstances, compel individuals to join groups themselves that they otherwise may not have. As group-level competition increases and becomes more essential for individuals’ survival, groups may “demand” greater levels of commitment to group-level strategies/goals on the parts of their members, and in-so-doing become more like agents apart from their constituents.
Entities, state variables, and scales
Entities:
Agents/individuals. Agents represent nomadic herders. They prospect about a 2-D environment in search of two resources: pasture and water (wells) in order to feed their herds, which sustain them and also represent their wealth and/or status. When resources are plentiful, their herds tend to grow. When resources are scarcer, their herds tend to diminish. Should their herds diminish to zero the agents will expire. Herders may also engage in intertribal warfare, which could result in death. Tribes (second-order agents). Herders are born to tribes, which are essentially an arbitrary units for group- or kin- based cooperation. When co-occupying the same location, tribesmen make more efficient use of resources (get more from the same space). They may also cooperate with tribesmen to engage in primitive intergroup conflict, enabling them to push members of other tribes o of a location and to monopolize a resource. Spatial units (e.g., grid cells). The simulation takes place on and X by X grid, where each cell is able to be occupied by multiple agents. Each cell also contains a regenerating supply of resources (food and/or water). Environment/Climate. Food and water are replenished by a dynamic climate model with both cyclical and non-cyclical components, representing “dry” and “wet” seasons, as well as transitional seasons. During dry seasons, pasture and wells replenish more slowly than in wet seasons. During non-cyclical climate periods, or “droughts,” resources replenish even more slowly.
Process overview and scheduling
The structure of the simulation is as follows:
1. Create custom functions, classes, and data frames. Select variables.
Using an object-oriented programming design, custom classes are defined for agents, tribes, the climate system, and the world. Custom functions are also defined for a number of operations to be completed. Data frames are defined for record keeping and subsequent analysis. State variables are either input manually or randomly selected from specified distributions (for Monte Carlo-type simulation).
2. Generate world and populate.
Running custom functions, the X by X world is created and populated with agents. The location of “wells” (water resources) and agents are initially distributed randomly according to randomly selected variables. Any properties of the land (or wells), such as land quality/well depth, are also determined here.
3. Initiate main time loop and run precipitation model.
The climate model is initiated, inducing a level of precipitation according to state variables and seasonality.
Precipitation allows pasture to grow and water to accumulate in wells.
4. Agents prospect, looking for food and water. Agents are able to view surrounding tiles (9 tiles, including the one they are occupying) and estimate expected utilities of each. Expected utility is a function of how badly the agent needs food, water, or both, how much is available at each tile, and expectations of what a potential share of those resources would be given who is likely to be there (fellow tribesmen or members of other tribes). Based on the set of expected utilities corresponding to each tile, the chance of the agent moving to a given tile is determined by its tile’s proportional share of total utility. Agents move probabilistically.
5. Resolve encounters.
After agents move, any encounters with other agents must be resolved. If the agent is alone, then the agent will simply consume as many of the locally available resources as their herds demand. If two or more agents of the same tribe are present, they will have an opportunity to cooperate with each other in the form of a public goods game (i.e., each agent may contribute a portion of their equal share of local resources). Their contribution is determined by a fixed, but heritable, trait (an individual-level cooperation coefficient). The collective contributions are multiplied by some benefit of cooperation (state variable) and redistributed to tribesmen.
If members of multiple tribes are present, resources on the tile are initially assigned to each tribe proportionately. However, tribes may decide to initiate a conflict to push others off of the tile and afford their members larger share. Tribes decide this collectively, albeit indirectly. A calculation is made that revises expected utilities for each tribesman based on expected probabilities of victory or loss, and compared with the alternative of peaceful coexistence with the out-tribe. If conflict is likely to benefit the tribesmen on average then a conflict is initiated.
Conflict outcomes are determined probabilistically where each belligerent’s probability of victory is determined by two main factors: A) the overall size of their tribe, including tribesmen not located on the tile. While non-local tribesmen are counted, their influence is weighted by the inverse square of their distance. B) the tribe’s ability to coordinate their fighting power. This ability is a function of a state variable, Lanchester Law Exponent, and the average level of cooperation in the tribe. More cooperative tribes are more effective in battle, especially when the Lanchester exponent is higher (i.e., the ability to coordinate tactically in battle).
6. Calculate changes.
With all moves complete, changes are individual, tribal, and global changes are calculated. These include changes to herds, including new births to well-fed, healthy animals and deaths of underfed, unhealthy ones. Agents are agents by 1 and, if applicable, expire given a specified age. Agents may also “migrate” from one tribe to another according to some specified probability. This is common practice in evolutionary simulation to ensure adequate “gene flow” between groups.
Reproduction. At the end of a time-period, agents have a chance to reproduce. Their probability of reproduction is based on their social status in their tribe, i.e. their relative wealth-standing compared to their tribesmen. This is a manifestation of within-group competition. The extent to which probabilities of reproduction are biased toward the most successful agents is a state variable. Generally, newborn agents inherit the heritable traits of their parents, including their propensity to cooperate with others. However, with some small probability they may be born as “mutants,” or receive a new trait value randomly from the initial distribution. Cohesive tribes (or tribes with higher mean levels of cooperation) will enjoy a bonus to reproduction rates through cooperative breeding activities, such as shared childcare. The degree of intra-group mate competition is a randomly varying parameter.
Tribe splitting. Consistent with anthropological and ethnographic evidence, when tribes grow to some specified size (e.g., 150) they tend to “fission,” or split. Thus, tribes growing to that number will be split into two tribes of equal (or near equal) numbers. Tribes with no remaining members are retired.
7. End simulation loop and record data.
The main loop is now complete. Data are recorded and the loop returns to item 3 of this pseudo-code. Simulation is run for up to 10,000 time-periods.
Design concepts
Multilevel selection. This model is based on Darwinian evolution with selection ultimately on individuals. How-ever, scholars have speculated on second-order selection processes giving the appearance of the non-Darwinian notion of “group selection,” or selection on entire groups of individuals (Wilson & Wilson 2007, (Nowak 2006). The notion of group selection fails because it tends to neglect the role of intra-group competition. In other words, while the presence of cooperators may, in fact, make a group more competitive against other groups, the cooperative traits will not necessarily survive since a group’s defectors are advantaged over cooperators. One workaround, however, is if the group is growing so fast that relative to other groups (because of its cooperators), that even while the proportion of cooperators in the group declines the total number of cooperators in the global population increases. This is evolution by multilevel selection.
Lanchester Laws of Combat. The Lanchester Laws of Combat (Lanchester 1956) mathematically express the combat advantage a fighting force able to concentrate its fire (i.e., coordinate tactically) enjoys over a fighting force that does not. According to the Square Law, the combat power of a fighting force able to do so grows according to the square of its number, whereas the power of a force unable to do so increases linearly with its numbers (Linear Law). In this simulation, a Lanchester exponent (ranging from 1 to 2, inclusive) is selected at the beginning of a simulation run, imparting a global ability of agents to work together tactically, but only if they “choose” to; i.e. according to their average propensity to cooperate.
Initialization
Data are collected on the both the initial-states and end-states of simulated worlds. In order to ensure a large, unbiased sample of all possible worlds, the simulation is repeated thousands of times with random parameters drawn from specified probability distributions. This is a form of Monte Carlo simulation.
References
ALFORD, J. R., Funk, C. L. & Hibbing, J. R. (2005). Are political orientations genetically transmitted? American Political Science Review, 99(02), 153–167. [doi:10.1017/S0003055405051579]
ALLEN, C. (2005). Dunbar & World of Warcraft. Blog post. Available at: http://www.lifewithalacrity.com/2005/08/dunbar_world_of.html.
AXELROD, R. & Hamilton, W. D. (1981). The evolution of cooperation. Science, 211(4489), 1390–1396. [doi:10.1126/science.7466396]
BANNISTER, R. (2010). Social Darwinism: Science and Myth in Anglo-American Social Thought. Philadelphia, PA: Temple University Press.
BOWLES, S. (2006). Group competition, reproductive leveling, and the evolution of human altruism. Science, 314(5805), 1569–1572. [doi:10.1126/science.1134829]
BOWLES, S., Choi, J.-K. & Hopfensitz, A. (2003). The co-evolution of individual behaviors and social institutions. Journal of Theoretical Biology, 223(2), 135–147.
BUHAUG, H. & Rød, J. K. (2006). Local determinants of African civil wars, 1970-2001. Political Geography, 25(3), 315–335. [doi:10.1016/j.polgeo.2006.02.005]
CHAGNON, N. (1968). ‘Yanomamo social organization and warfare.’ In M. Fried, M. Harris, & R. Murphy (Eds.), War: The Anthropology of Armed Conflict and Aggression. New York: The Natural History Press, pp. 109–159.
CRÉPIN, A.-S. & Lindahl, T. (2009). Grazing games: sharing common property resources with complex dynamics. Environmental and Resource Economics, 44(1), 29–46. [doi:10.1007/s10640-008-9258-0]
DARWIN, C. (1871). The Descent of Man. (Reprint edition 2016). New York, NY: Diversion.
DAWES, C. T. & Fowler, J. H. (2009). Partisanship, voting, and the dopamine d2 receptor gene. The Journal of Politics,71(3), 1157–1171. [doi:10.1017/S002238160909094X]
DUGATKIN, L. A. & Reeve, H. K. (2000). Game Theory and Animal Behavior. Oxford: Oxford University Press.
DUNBAR, R. I. (1992). Neocortex size as a constraint on group size in primates. Journal of Human Evolution, 22>(6), 469–493. [doi:10.1016/0047-2484(92)90081-J]
DUNBAR, R. I. (1993). Coevolution of neocortical size, group size and language in humans. Behavioral and Brain Sciences, 16(4), 681–694.
EPSTEIN, J. M. (2009). Agent‐based computational models and generative social science. Complexity, 4(5), 41–60. [doi:10.1002/(SICI)1099-0526(199905/06)4:5<41::AID-CPLX9>3.0.CO;2-F]
FEWS (2018). Protracted conflict and below-average rainfall likely to drive increased acute food insecurity 2018. Famine Early Warning Systems Network. Available at:http://fews.net/east-africa.
FOWLER, J. H., Baker, L. A. & Dawes, C. T. (2008). Genetic variation in political participation. American Political Science Review, 102(02), 233–248. [doi:10.1017/S0003055408080209]
FOWLER, J. H., Dawes, C. T. & Christakis, N. A. (2009). Model of genetic variation in human social networks. Proceedings of the National Academy of Sciences, 106(6), 1720–1724.
FRATKIN, E. (2001). East African pastoralism in transition: Maasai, Boran, and Rendille cases. African Studies Review, 44(3), 1–25. [doi:10.2307/525591]
FRATKIN, E., A Nathan, M. & Roth, E. (2006). Is settling good for pastoralists? The effects of pastoral sedentarization on children’s nutrition, growth, and health among Rendille and Ariaal of Marsabit District, Northern Kenya.Presentation for “Pastoralism and Poverty Reduction in East Africa: A Policy Research Conference” – International Livestock Research Institute, 27-28 June 2006, Nairobi.
FUKUI, K. & Turton, D. (1979). Warfare among East African Herders. Osaka: National Museum of Ethnology.
GINTIS, H. (2005). Moral Sentiments and Material Interests: The Foundations of Cooperation in Economic Life, Vol. 6. Cambridge MA: MIT Press.
HAILEGIORGIS, A. B., Kennedy, W. G., Balan, G., Bassett, J. K. & Gulden, T. (2010). An agent based model of climate change and conflict among pastoralists in East Africa. In Proceedings of the 2010 International Congress on Environmental Modelling and Software.
HALAKE, S. (2016). La Nina threatens to bring drought to East Africa. Voice of America News.. https://www.voanews.com/a/la-nina-threatens-drought-east-africa/3387916.html.
HAMILTON, W. D. (1964). The genetical evolution of social behaviour. II. Journal of Theoretical Biology, 7(1), 17–52. [doi:10.1016/0022-5193(64)90039-6]
HARDIN, G. (1968). The tragedy of the commons. Science, 162(3859), 1243–1248.
HEADY, H. F. (1975). Rangeland Management. New York: McGraw-Hill.
HENDRIX, C. S. & Salehyan, I. (2012). Climate change, rainfall, and social conflict in Africa. Journal of Peace Research, 49(1), 35–50.
HILL, K. R., Walker, R. S., Božičević, M., Eder, J., Headland, T., Hewlett, B., Hurtado, A. M., Marlowe, F., Wiessner, P. & Wood, B. (2011). Co-residence patterns in hunter-gatherer societies show unique human social structure. Science, 331(6022), 1286–1289. [doi:10.1126/science.1199071]
HILL, R. A. & Dunbar, R. I. (2003). Social network size in humans. Human Nature, 14(1), 53–72.
IFRC (2011). Drought in the horn of Africa: Preventing the next disaster. Tech. rep., International Federation of Red Cross and Red Crescent Societies.
JOHNSON, D. D. & MacKay, N. J. (2015). Fight the power: Lanchester’s laws of combat in human evolution. Evolution and Human Behavior, 36(2), 152-163.
JOHNSON, T. & Smirnov, O. (2018). Inequality as information: Wealth homophily facilitates the evolution of cooperation. Scientific Reports, 8(1), 11605. [doi:10.1038/s41598-018-30052-1]
KENNEDY, W. G., Hailegiorgis, A. B., Rouleau, M., Bassett, J. K., Coletti, M., Balan, G. C. & Gulden, T. (2010). An agent-based model of conflict in East Africa and the effect of watering holes. In Proceedings of the 19th Conference on Behavior Representation in Modeling and Simulation (BRiMS).
KING, A. J., Douglas, C., Huchard, E., Isaac, N. J. & Cowlishaw, G. (2008). Dominance and affiliation mediate despotism in a social primate. Current Biology, 18(23), 1833–1838. [doi:10.1016/j.cub.2008.10.048]
KOENIG, A. (2002). Competition for resources and its behavioral consequences among female primates. International Journal of Primatology, 23(4), 759–783.
KUZNAR, L. A. & Sedlmeyer, R. (2005). Collective violence in Darfur: An agent-based model of pastoral nomad/sedentary peasant interaction, Mathematical Anthropology and Cultural Theory: An International Journal, 1(4), 1-22.
LANCHESTER, F. W. (1956). Mathematics in warfare. The World of Mathematics, 4, 2138–2157.
MATHEW, S. & Boyd, R. (2011). Punishment sustains large-scale cooperation in prestate warfare. Proceedings of the National Academy of Sciences, 108(28), 11375–11380. [doi:10.1073/pnas.1105604108]
NEVES, E. (1995). Village fissioning in Amazonia: a critique of monocausal determinism. Revista do Museu de Arqueologia e Etnologia, (5), 195–209.
NIDIS (2015). Global Drought Information System: http://www.drought.gov/gdm/current-conditions.
NOWAK, M. A. (2006). Five rules for the evolution of cooperation. Science, 314(5805), 1560–1563.
NUNN, N. & Qian, N. (2014). Us food aid and civil conflict. American Economic Review, 104(6), 1630–66. [doi:10.1257/aer.104.6.1630]
OLSON, M. (1965). The Logic of Collective Action: Public Goods and the Theory of Group. Cambridge MA: Harvard University Press.
OSTROM, E., Burger, J., Field, C. B., Norgaard, R. B. & Policansky, D. (1999). Revisiting the commons: local lessons, global challenges. Science, 284(5412), 278–282. [doi:10.1126/science.284.5412.278]
PARENTI, C. (2011). Tropic of Chaos: Climate Change and the New Geography of Violence. New York: Nation Books.
POLMAN, L. (2010). The Crisis Caravan: What’s Wrong with Humanitarian Aid? New York: Metropolitan Books.
RALEIGH, C. & Kniveton, D. (2012). Come rain or shine: An analysis of conflict and climate variability in East Africa. Journal of Peace Research, 49(1), 51–64.
ROGERS, A. R. (1990). Group selection by selective emigration: the effects of migration and kin structure. The American Naturalist, 135(3), 398–413. [doi:10.1086/285053]
SADLER, K., Kerven, C., Calo, M., Manske, M. & Catley, A. (2010). The fat and the lean: review of production and use of milk by pastoralists. Pastoralism, 1(2), 291–324.
SELTZER, N. & Smirnov, O. (2015). Degrees of separation, social learning, and the evolution of cooperation in a small-world network. Journal of Artificial Societies and Social Simulation, 18(4), 12: https://www.jasss.org/18/4/12.html. [doi:10.18564/jasss.2851]
SENFT, R., Coughenour, M., Bailey, D., Rittenhouse, L., Sala, O. & Swift, D. (1987). Large herbivore foraging and ecological hierarchies. BioScience, 37(11), 789–795.
SIDANIUS, Jim and Kurzban, R. (2003). ‘Evolutionary Approaches to Political Psychology.’ In R. E. Sears, David O and Huddy, Leonie Ed and Jervis (Eds.), Oxford Handbook of Political Psychology, Oxford University Press, pp. 111–146.
SMIRNOV, O., Arrow, H., Kennett, D. & Orbell, J. (2007). Ancestral war and the evolutionary origins of “heroism”. Journal of Politics, 69(4), 927–940.
SPENCER, H. (1904). A System of Synthetic Philosophy. Vol. 1: First Principles. London: Read Books.
STERCK, E. H., Watts, D. P. & van Schaik, C. P. (1997). The evolution of female social relationships in nonhuman primates. Behavioral Ecology and Sociobiology, 41(5), 291–309.
SULIMAN, M. (1993). Civil war in the Sudan: From ethnic to ecological conflict. Ecologist, 23(3), 104–109.
TEN BROEKE, G., van Voorn, G. & Ligtenberg, A. (2016). Which sensitivity analysis method should I use for my agent-based model? Journal of Artificial Societies and Social Simulation, 19(1), 5: https://www.jasss.org/19/1/5.html. [doi:10.18564/jasss.2857]
TEN BROEKE, G., van Voorn, G., Ligtenberg, A. & Molenaar, J. (2018). Cooperation can improve the resilience of common-pool resource systems against over-harvesting. Ecological Complexity. [doi:10.1016/j.ecocom.2018.08.009]
WASER, P. M. (1988). Resources, philopatry, and social interactions among mammals. In C. N. Slobodchiko (Ed.), The Ecology of Social Behavior, San Diego, CA: Academic Press, pp. 109–130.
WEIKART, R. (1993). The origins of Social Darwinism in Germany, 1859-1895. Journal of the History of Ideas, 54(3), 469–488. [doi:10.2307/2710024]
WILSON, D. S. & Wilson, E. O. (2007). Rethinking the theoretical foundation of sociobiology. The Quarterly Review of Biology, 82(4), 327–348.
WITTIG, R. M. & Boesch, C. (2003). Food competition and linear dominance hierarchy among female chimpanzees of the Taï National Park. International Journal of Primatology, 24(4), 847–867. [doi:10.1023/A:1024632923180]
WOOD, R. M. & Molfino, E. (2016). Aiding victims, abetting violence: the influence of humanitarian aid on violence patterns during civil conflict. Journal of Global Security Studies, 1(3), 186–203.
WOOD, R. M. & Sullivan, C. (2015). Doing harm by doing good? the negative externalities of humanitarian aid provision during civil conflict. The Journal of Politics, 77(3), 736–748. [doi:10.1086/681239]
ZELLNER, A. & Theil, H. (1962). Three-stage least squares: simultaneous estimation of simultaneous equations. Econometrica: Journal of the Econometric Society, 30, 54–78.
ZINSER, E. R. & Kolter, R. (2004). Escherichia coli evolution during stationary phase. Research in Microbiology, 155(5), 328–336. [doi:10.1016/j.resmic.2004.01.014]