
Introduction
Research on animal-sourced foods has gained momentum due to the increased recognition about the problem that livestock production and consumption poses for health for both the planet and the population. Environmental and ecological sciences tend to agree about the dramatic contribution of livestock production to climate change associated with high levels of greenhouse gas emissions (GHGEs): about 15% of the global anthropogenic emissions comes from livestock production (Gerber et al. 2013). Meat production also requires a disproportionate amount of land: in 2009, it was estimated that 70% of global agriculture was used to graze ruminants (cattle, sheep and goats), corresponding to 25% of the global land surface (Stehfest et al. 2009). Indeed, a decrease in consumption in mainly developed countries has been deemed necessary to mitigate climate change (Intergovernmental Panel on Climate Change 2019). Some studies estimate that a reduction in GHGEs up to about 50% could be achieved by shifting the population towards diets low in animal-sourced foods, although this varies depending on the overall diet composition (Aleksandrowicz et al. 2016; Perignon et al. 2017).
There is also a growing concern about the effect of overconsumption of red and processed meat on health. The International Agency for Research on Cancer classifies processed meats as a carcinogenic product and red meats as a probable carcinogenic product to humans, especially with respect to colorectal cancer; high consumption of these meats have also been associated with an increased risk of other types of cancer (i.e. oesophagus, lung, stomach, and prostate) (World Cancer Research Fund & American Institute for Cancer Research 2007). Bringing together health and environmental concerns, there is an urgent need to shift the population towards eating healthy and sustainable diets, which include only small amounts of meat. The challenge is how to achieve a dietary change.
The current work aims to integrate theories and evidence from consumer behaviour, social psychology, and nutrition studies using agent-based modelling to create a reliable simulation model of British consumers’ meat consumption. The model will be used to test the potential impacts of different strategies to reduce the amount of meat eaten.
The model is developed specifically around the role of peers’ influence and networks. The literature suggests that social influence can exert an important role on food consumption (Feunekes et al. 1998; Pachucki, Jacques, & Christakis 2011; Robinson, Fleming, & Higgs 2014; Zhang 2014). For instance, Pachucki et al. (2011) found that eating patterns appear to be socially transmitted across different people depending on the relationships (with spouses showing the strongest correlation in eating patterns). By linking individual behaviours to social consequences (Bruch & Atwell 2015), computational models allow changes in consumption patterns at the population level resulting from multiple interactions over time between individual consumers to be explored. We were particularly interested in exploring the effects of social marketing campaigns across consumption contexts (workplace-home).
Starting from Hamill and Gilbert, who defined personal networks as “representations of the relationships between one person and others” (2010, 78), we use the term eating network to indicate the set of relationships among people who are eating together during a meal. This study considers two distinct eating networks working asynchronously. The first one includes the set of co-workers eating together during lunch at their workplace, while the second network refers to household members eating at home. The combination of these eating networks forms the social network underpinning our simulation.
Background: Modelling Food Consumption
ABMs have been described as “simulation models describing a system of heterogeneous agents that influence each other over time” (Blok et al. 2015, 606) and allows individual characteristics (e.g. age, gender, and education), preferences, and behaviour (e.g. taste preferences, and health beliefs) to be modelled. Spatial information can also be included to account for differences in choices.
Agent-based models (ABMs) are often used for the integration of data and theories from different disciplines. Their use in public health studies is increasing, especially with regards to the investigation of dietary behaviours (Zhang et al. 2014). For instance, Blok et al. (2015) explored the efficacy of different interventions on reducing income inequalities in healthy eating by simultaneously representing consumers and food outlets in an ABM. Similarly, Auchincloss et al. (2011) used an ABM to investigate the effect of different policies to counter income disparities in terms of healthy eating. ABMs can be a valuable method to complement empirical research for modelling policies and interventions that could be implemented in the real world.
Rules are used at the agents’ level to give rise to predictable behaviour, but the interactions that occur during the simulation among agents and the virtual world can result in the emergence of unexpected social patterns (Bruch & Atwell 2015). This approach has been used in studies and assessed under different population interventions. An ABM offers the chance to create a virtual laboratory where experiments follow a “what-if” approach. For instance, Bravo et al. (2013) designed a model of household consumption patterns in Italy associated with food, transportation, and energy, which was then used to estimate the overall GHGEs under the application of different policies (e.g. the introduction of carbon taxes). The model also estimated the change in environmental concern in the population derived from the diffusion of information campaigns and the consequential impact on consumption preferences. More recently, in the context of obesity, Hennessy et al. (2016) developed a simulation to aid the design and evaluation of behaviour change interventions aimed at increasing physical activity and healthy eating habits.
Agent-based models have also been used to explore the spread of unhealthy behaviours across networks via peer influence. For instance, Shoham et al. (2012) investigated peers influence on adolescents’ body size and physical activity, which supported the idea that body size is affected by a process of social influence in friendship networks. Zhang et al. (2014) explored interventions of a rise in price of unhealthy food and the promotion of healthy norms via marketing using ABM. The design of the processes of influence on agents by peers and by food marketing resembled the mechanisms of norm-based influence (Zhang et al. 2014), which nudge a consumer towards conformity by emphasising peers’ behaviour. The mechanisms of social influence in eating networks in the model described in this paper is adapted from their work.
Model Description
The model is described below using the ODD+D protocol, which is a standard way to describe and compare agent-based models (Grimm et al. 2010; Müller et al. 2013).
Purpose
The ABM aims to reproduce the behaviour of the British population in relation to meat consumption by replicating individual preferences and peer influence among consumers. The model is built with the goal to observe behavioural changes under the application of different policies. Emphasis is placed on how social marketing campaigns can changes determinants of meat consumption in one context (e.g. the workplace) and subsequently affect members present in another context (household). The main outcome reported is the mean weekly consumption of meat (g) per person and the secondary outcome is the mean likelihood of eating meat. The simulation is empirically based, using data from multiple sources to inform the ABM.
Agents, state variables, and scales
The agents of the model represent adult consumers. Each agent is characterised by an individual probability to eat meat, which is computed at the start of the simulation and then updated at every meal (i.e. every time step) based on the agent’s socio-demographic characteristics, personal concerns, perceived peer influence, and price of meat (more details can be found in Sections 3.14-3.15 below). Agents are defined by sex, age, monthly income, employment status, individual perception of the living cost and whether they follow a meat-free diet, all of which are assumed constant over the simulation. In addition, each agent has personal concerns regarding the impact of meat consumption on health, the environment and animal welfare, which can change over time due to a process of social influence.
All agents are part of an eating network comprising household members, while only some of them have a second eating network that connects co-workers. Each household is structured as a clique where each member is connected with every other members of the household. Households are used to define from whom an agent can be influenced and whom it can influence when eating at home. Similarly, the workplace network defines the boundaries of social influence among co-workers. Each worker is connected to every other member of the same work team, and work teams are randomly connected to represent a hypothetical organisation. The households and work teams are fixed for each individual run of the model and they do not own any state variables. For the purpose of the simulation, links between agents are assumed unidirectional (i.e. two agents exercise the same power of influence on each other).
Process overview and scheduling
For the current model there is a time framework, with each tick of the simulation corresponding to a meal. Eating episodes follow a sequential order: breakfast, lunch, and evening meal and therefore, three ticks represents one day. The simulation runs for a period of three years so that the simulation output can be compared to the consumption of meat provided by the Agriculture and Horticulture Development Board (2018) for the period 2014-2017. We also chose this length of time since changes in dietary behaviours are generally slow (Godfray et al. 2018), especially when based on social influence.
At the beginning of each run the program creates and initialises agents’ variables by accessing consumers’ data file, and it then creates the eating networks. Every agent eats breakfast and dinner at home with other household members. Agents classified as workers have lunch at the workplace with co-workers, while other agents eat at home alone or with non-worker household members. Weekends are taken into account such that workers have lunch at home with household members. Agents cannot skip a meal, but each agent has a probability, based on real observations, of eating alone rather than with others.
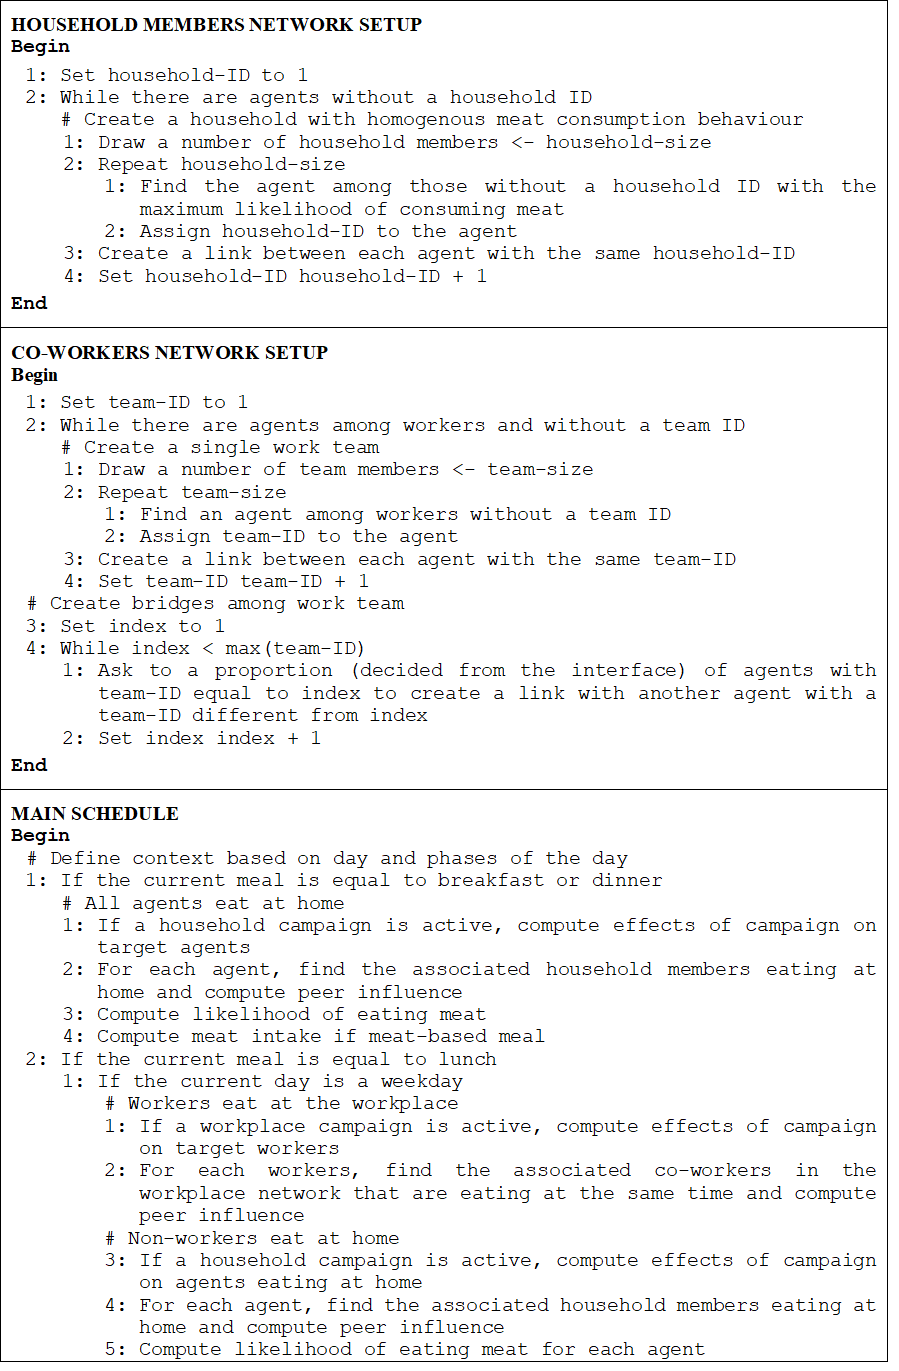
At each eating episode, the simulation evaluates the location (home/workplace) and activates the corresponding eating network. When a network is active an agent can only influence and be influenced by those agents that are eating at the same time and within the same network. The pseudo-code for constructing and managing the networks during the simulation is presented in Figure 1. At the end of day some random oscillations that are equally distributed over time occur to simulate changes in agents’ concerns due to other sources of influence (such as the media) that are not explicitly modelled. A parameter sweep was conducted to select optimal values and inspected during the validation process.
Design concepts
The model draws on and integrates basic principles of several scientific theories.
Agent’s behaviour is grounded in the Theory of Reasoned Action (TRA; Ajzen & Fishbein 1980; Fishbein & Ajzen 1975). The TRA states that human behaviour is determined by the person’s intention to perform the behaviour, which is in turn predicted by the individual attitude and influence derived from the person’s social network. Based on the TRA, we modelled the individual antecedents of intention separately from the social one. As stated by Feunekes et al. (1998), eating behaviours is influenced by social factors given that attitudes and habits develop by interacting with other people. Accordingly, we created a bridge between the personal attitude and the social dimension to allow a dynamic interplay between these components, such that over time processes of social influence affects some of the attitude components. Intention is assumed to be the best predictor to use as a proxy for actual behaviour and it is computed via logistic regression.
In accordance with Hamill & Gilbert (2010), the modelled eating networks (household and workplace) reflect the strongest and weak groups, respectively, with whom people are connected based on the strength of ties. In their work the authors describe the basic characteristics that personal and social networks should possess and propose a novel model of networks based on the idea of social distance (measured in terms of geographical distance). In line with their work, some concepts were borrowed to design the eating networks, such that both the personal networks possess links only between agents that can reciprocate the relation, while at the social level communities (highly connected groups with few ties outside the group) are present. The use of a network facilitates the formalisation of peer influence and the regulation of the latter through different meals across the day. Moreover, networks were built following homophily principles (Mcpherson, Smith-Lovin, & Cook 2001): households are homogeneous within them and heterogeneous between them with respect to the probability of eating meat. Homogeneity within households with respect to food consumption has been observed in previous research (Feunekes et al. 1998; Pachucki et al. 2011).
Interventions based on social influence have been conceptualised starting with their application in real life e.g. to promote fruit and vegetable intakes, to reduce alcohol intake (Haines & Spear 1996), decrease electricity consumption (Horne & Kennedy 2017) and promote pro-environmental behaviour (Farrow, Grolleau, & Ibanez 2017). Stok et al. (2014) showed that a simple one-line descriptive norm message was able to positively influence fruit consumption for up to two days. The translation of the effects of marketing campaigns into the current model is based on other ABM (Zhang et al. 2014). Finally, regards the susceptibilities towards household and colleagues influence, the design of the model is informed by the previous work on food choice and networks (de Castro 1994; Feunekes et al. 1998; Pachucki et al. 2011). Additional concepts embedded in the model are shown in Table 1.
| Emergence | In addition to consumption patterns, emerging phenomena can be found in boomerang effects (Schultz, Nolan, Cialdini, Goldstein, & Griskevicius 2007), which refer to the backfire of campaigns messages. |
| Adaption | Adaptation occurs when an agent decreases the amount of meat consumed in response to an intervention such as a price change. In this model agents do not predict change in prices, but rather they react afterwards by adapting their consumption. |
| Sensing | Agents sense the concerns of other agents that are part of the same household or work team, and this is altered by social marketing messages. Agents sees the price of product and deviations from the initial price. |
| Interaction | Interaction occurs via peer influence when an agent evaluates the concerns of household members or colleagues. |
| Stochasticity | Stochasticity is included at each run of the simulation during the assignment of an agent to a household and to a work team. Stochasticity also occurs in the order agents are involved in the process of influence. |
| Observations | Observations are recorded every week and comprise data about the likelihood to consume meat and the amount of meat consumed (g/week/agent). |
| Heterogeneity | The main source of heterogeneity derives from the different concerns’ agents have regarding the impact of meat consumption on health, environment, and animal welfare. |
Implementation and initialisation
The model is implemented in the multi-agent programmable environment NetLogo 3D 5.3.1 (Wilensky 1999). A copy of the model with supplementary information can be downloaded[1] from the model library of the CoMSES Net website (www.comses.net). The number of agents are created by reading the number of rows contained in the input file, which contains a random sample[2] (N = 397) of cases extracted from the British Social Attitude Survey (NatCen Social Research 2016). Next, agents are assigned randomly to a household and workers to a work team. The distribution of adults per household observed in 2014 in the UK is recreated. Children are not represented in the current model. This decision was made in accordance with the choice of focusing the interventions for this model on the workplace and we assumed people under the age of 18 years would represent only a minor influence on household members’ concerns for meat consumption. The mean size of the work team is fixed at four members as previous research reported that the number of people eating together at lunch in the worksite canteen ranged from one to eight people (Bell & Pliner 2003). Following the idea of a previous agent-based model (Natalini & Bravo 2014), the agents’ position in the 3D space was chosen on the basis of their individual concerns. The x-axis corresponds to agents’ health concern, y-axis to environmental concern, and z-axis to animal welfare concerns. The position is updated at every time step of the simulation to display changes in agents’ concerns.
Input data
At the beginning the model reads an input file containing the empirical data from the BSA survey prepared for the simulation. This means that every agent represents exactly one of the respondents in the survey. Besides demographic information (i.e. sex, age, employment status, and income), the input file contains the perception of living cost and personal concerns about the impact of meat consumption. Additional data to inform agents’ behaviour comes from the National Diet and Nutrition Survey (NDNS; Bates et al. 2016). The NDNS collects information on food consumption of a representative sample of the UK population. Where information were not available parameters values were identified by a parameter sweep (Table 2).
| Agents’ attribute | Description | Dynamic?1 | Source2 | Range3 |
| Sex | Men; women | No | BSAS | {1; 2} |
| Age | Age | No | BSAS | [18, 99] |
| Worker | Employment status | No | BSAS | {true; false} |
| Susceptibility (s) | Susceptibility towards influence from household members and co-workers | No | Endogenous | [0, 0.30] |
| Income | Monthly household income decile | No | BSAS | [1, 10] |
| Cost perception | Perception of the cost of living (price sensitivity) | Yes | BSAS | [1, 5] |
| Meat-free diet | Self-reported meat-free diet | No | BSAS | {0; 1} |
| Health concerns | Beliefs about the meat impact on health | Yes | BSAS | [1, 5] |
| Environmental concerns | View on environmental impact of meat | Yes | BSAS | [1, 5] |
| Animal welfare concerns | Concern about animal welfare | Yes | BSAS | [1, 5] |
| Preference for meat | Likelihood of eating meat | Yes | Endogenous | [0, 1] |
| Meat amount | Grams of meat eaten per meal | Yes | NDNS | [1, ) |
| Chances of eating alone | Likelihood to having a meal without other people | Yes | NDNS | [0, 1] |
| Price elasticity | Elasticity of the price of meat by income group | No | Tiffin et al. (2011) | {0.839; 0.804} |
| Mean work team size | Mean number of co-workers eating together during lunch at work | No | Bell & Pliner (2003) | 4 |
| 1“Dynamic?” means that the value of the variable are allowed to change during the run of the simulation. 2“Endogenous” indicates that variables values are determined in the model. “BSAS” indicates the British Social Attitude Survey (NatCen Social Research 2016). “NDNS” refers to the UK National Diet and Nutrition Survey (from 2008/9 to 2013/14; Bates et al. 2016). 3“Range” shows the potential values the variable can assume. | ||||
Submodels
Meal selection
A preliminary study was conducted prior to the modelling phase. The responses collected by the BSA survey (NatCen Social Research 2016) were analysed using a logistic regression model to identify the significant predictors of the likelihood to consume meat. The respondents’ self-reported consumption at the time of the survey was dichotomised (eating same amount/more meat than the previous year vs. reduced meat from previous year/stopped eating meat) and used as a dependent variable. Participants with missing data were excluded from analysis providing overall 2878 responses (96% of total respondents). The logistic regression correctly predicted 71% of respondents’ behaviours. Consumers’ sex, age and concerns associated with meat are all significant predictors of eating meat. Despite not being a statistically significant predictor of meat consumption likelihood, perception of living cost is included as the proxy for consumers’ price sensitivity. At each time step an agent evaluates their own likelihood to consume a meat-based meal based on the aforementioned factors. The resulting regression model for an agent i at time t corresponds to:
| $$y_i = b_0 + b_1(\textit{sex}_i) + b_2(\textit{age}_i) + b_3(\textit{env}_{i,t}) + b_4(\textit{hlt}_{i,t}) + b_5(\textit{awe}_{i,t}) + b_6(\textit{plc}_i)(\textit{meat.price}_t)$$ | (1) |
| Parameter | Value | Description |
| sexi | {1; 2} | Agent i’s sex (1=female) |
| agei | [18, 99) | Agent i’s age |
| envi,t | [1, 5] | Agent i’s concerns for the environment at time t |
| hlti,t | [1, 5] | Agent i’s concerns for his/her health at time t |
| awei,t | [1, 5] | Agent i’s concerns for animal welfare at time t |
| plci | [1, 5] | Agent i’s perception of living cost |
| meat.pricet | [1, 2] | Price of meat at time t. Equal 1 for the standard cost of meat. |
| b0 | -6.321 | Constant of the equation |
| b1 | 0.655 | Weighting for consumer’s sex |
| b2 | 0.016 | Weighting for agent’s age |
| b3 | 0.287 | Weighting for environmental concerns |
| b4 | 0.623 | Weighting for health concerns |
| b5 | 0.178 | Weighting for animal welfare importance |
| b6 | 0.101 | Weighting for perception of living cost |
To estimate the likelihood to consume meat, the result of the previous equation was used. A dummy variable is included (veg) to account for consumers’ following a meat-free diet. The variable is computed from the BSA original survey responses (0 = meat-free diet; 1 = meat-eater). Due to the original phrasing of the BSA survey questions, the regression model returns the probability of reducing meat rather than its consumption. As a result, the likelihood to eat meat for an agent i at time t equals to:
| $$p_{i,t}(\textit{consume.meat}) = (1 - \frac{e^{y_i}}{(1 + e^{y_i})})\ast \textit{veg}_i $$ | (2) |
Social influence and effects of social marketing campaigns
Following the approach proposed by Zhang et al. (2014), the influence is implemented as a weighted average depending on the weight w and the relative concerns of an agent i compared to those of its relatives or colleagues. When w equals zero, peers influence occurs without any effect of the social marketing campaign.
| $$c_{i,t}=(1 -s_i)C_{1,t - 1} + s_i \frac{\sum_{C_{j,t-1}>C_{i,t-1}}^{j\in \textit{peers}(i)} (1+w)C_{j, t-1} + \sum_{C_{j,t-1}\leq C_{i,t-1}}^{j\in \textit{peers}(i)} (1-w)C_{j,t-1}}{ \sum_{C_{j,t-1}>C_{i,t-1}}^{j\in \textit{peers}(i)} (1+w) + \sum_{C_{j,t-1}\leq C_{i,t-1}}^{j\in \textit{peers}(i)} (1-w)} $$ | (3) |
C represents the value of an agent’s concern regarding a specific aspect of meat consumption (health, environment, or animal welfare) at time t; parameter w denotes interventions based on social marketing campaigns; s indicates the agent’s susceptibility towards household members and co-workers. This process is applied separately for each agent’s concern and as a result, an agent can be simultaneously influenced by agents in relation to health, and being influenced by some others about animal welfare. w is used to bias agents’ attention towards those peers with higher concerns than them (Zhang et al. 2014).
The degree a campaign affects the agents is simulated by varying the value of w (a low, medium, or high campaign success can be hypothesised). Parameter w can be manipulated from the interface of the model and its value decays over time to simulate lower attention to marketing campaigns by agents (see specific Sections 3.14-3.22 for details). Again, different values can be specified separately for each campaign.
Finally, parameter s represents others’ power of influence over agent i. Social modelling of eating behaviour suggests family are the primary source of influence on food choices (de Castro 1994). Hence, the average value of susceptibility towards household members is higher than the susceptibility towards co-workers. Since to our knowledge no specific data exists on the probability distribution of consumers’ susceptibility, we followed the suggestion by Bruch and Atwell (2015) and assumed a normal distribution such that some agents will be more easily influenced compared to others.
Decay of the effects of social marketing campaigns
Attention paid to messages tends to dissipate over time (Cialdini, Raymond, & Carl 1990). Therefore, the effects of social marketing campaigns are introduced using a time-decay function:
| $$w_t = w_t \ast e^{(-dt)} $$ | (2) |
where w indicates the effects of marketing campaigns on agents’ concerns, d represents the exponential decay constant, and t reports the current month in the simulation. d was based on the literature about the persistence of the effects of social marketing campaigns, specifically on norm-based messages (Allcott 2011; Allcott & Rogers 2012; Ferraro, Miranda, & Price 2011; Nolan et al. 2008; Robinson et al. 2014). We assumed the same rate of decay independently from the campaign.
Estimation of the amount of meat consumed per consumer
A submodel is used in the simulation to estimate the amount of meat eaten by each agent at every eating episode where a meat-based meal is chosen. The UK National Diet and Nutrition Survey (NDNS) (2012-14) (Bates et al. 2016) is used as a reference to create a model within the simulation to generate values of quantity of meat that is similar to the original data. Meat intake depends on sex, time, and context (Horgan et al. 2019). In line with this, the model generates the amount of meat eaten by an agent depending on its sex and time of the day drawing a value from a distribution which approximate empirical data.
Price elasticity and quantity consumed
While the probability of eating meat is affected by the changes in agents’ concerns, the amount of meat eaten is also affected by the price elasticity of demand. The analysis conducted by Tiffin, Balcombe, Salois, & Kehlbacher (2011) using the Living Costs and Food Survey (2001-2009) showed that when the cost of meat increases by 1%, low income households decreases consumption by 0. 839%, whereas the rest of population decreases consumption by 0.804%. Accordingly, to model price elasticity the grams of eaten meat by each consumer are corrected by a factor e, which is equal to:
| $$e_i = 1 - (\textit{ped}_i \ast (\textit{meat.price}_t / 100 - 1)) $$ | (5) |
Experiments
Validation
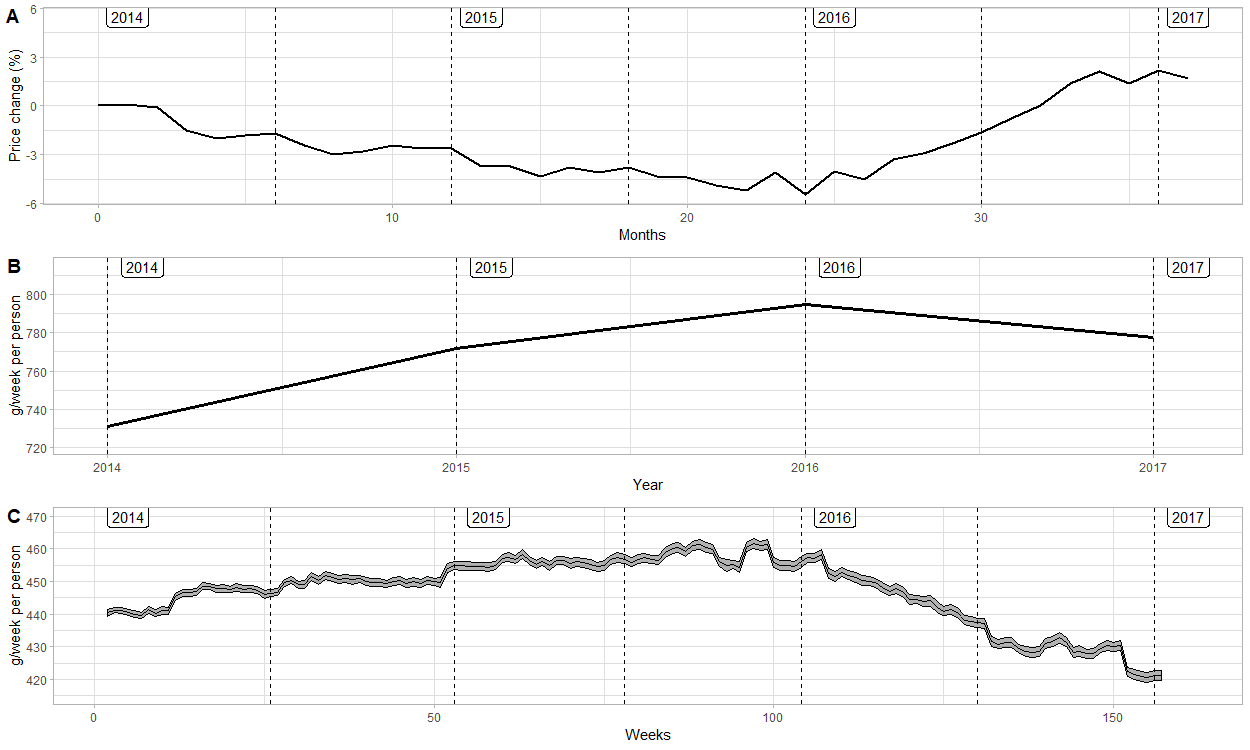
The model is empirically validated (Squazzoni 2012), which means that parameters used across sections of the model are informed by empirical data and simulation outputs are assessed against empirical data (Figure 2). Prior to the experiments, the consumption pattern emerging from the model was assessed against the data on meat consumption reported by the Agriculture and Horticulture Development Board (AHDB 2018) for the period 2014-2017. However, while the input data for agents’ consumption reflect consumers’ self-reported meat intake, the volumes of meat provided by the AHDB are carcase weight. Although the carcase weight will vary by animal, the average amount of edible meat yield from a carcase is 75% (Nijdam, Rood, & Westhoek 2012). In addition, the process of cooking reduces the weight of meat products. Although such change in weight varies by type of product, based on previous analysis (Lombardi-Boccia, Lanzi, & Aguzzi 2005) it is estimated for meat products an average weight loss of about 37%. Therefore, we recomputed the data provided by the AHDB to account for both the carcase weight and cooking process since in the model the meat intake is based on meat as eaten (i.e. cooked). Figure 2b displays the estimates of meat after conversion to a weight as eaten. Further, the small remaining difference could be explained by waste produced during the processing the meat and by underreporting of food intakes in the National Diet and Nutrition Survey, which is common in dietary surveys.
For the validation the baseline model (i.e. no interventions applied) was run 100 times. At the end of each run the mean weekly consumption was computed using R version 3.5.1 (R Development Core Team 2008) together with the 95% confidence intervals. Results from the simulation model showed a similar pattern across the years to the one reported by the AHDB, with a mean increase in the consumption from 2014 to 2016 and a decrease during the successive year. The emergent trend can be mainly explained by the variation of the price of meat over the years which, apart from the flexion between 2014-2016, constantly grew up to 26% compared to 2007 (Figure 2a; Department for Environment Food & Rural Affairs 2017a; Office for National Statistics 2016). However, agents in the simulation tend to systematically consume less meat compared to consumers’ data. Such discrepancy could be explained by food waste, which is not accounted by AHDB elaboration, and by the exclusion of food consumed by individuals less than 18 years of age from the simulation.
Tested experiments
Two sets of experiments are tested. In the first set we compare the impact of a 5%, 10%, and 20% price increase of meat with three social marketing campaigns, each one focused on a specific consumers’ concern. In the second set, we test the emergence of boomerang effects by launching an environmental campaign during the first year and targeting environmentally unconcerned and concerned agents. Although a number of parameters are available to set the social marketing campaigns (for instance, age and sex of campaign targets), for the current work we limited their use. Future work will evaluate the impact of specific marketing strategies.
Results were collected during the simulation at the end of each week. Data from first week are excluded from the analyses to allow an initial period during which agents adjust their concerns with respect with adjacent agents in the household network, while changes in price and social marketing campaigns start after the first month. For each experiment, 100 simulations were run, and the mean result was collected. Data was analysed using R version 3.5.1 (R Development Core Team 2008). Results from the baseline model are reported in both sets of experiments to offer a reference to compare experiment outputs.
Results
Price increase versus social marketing
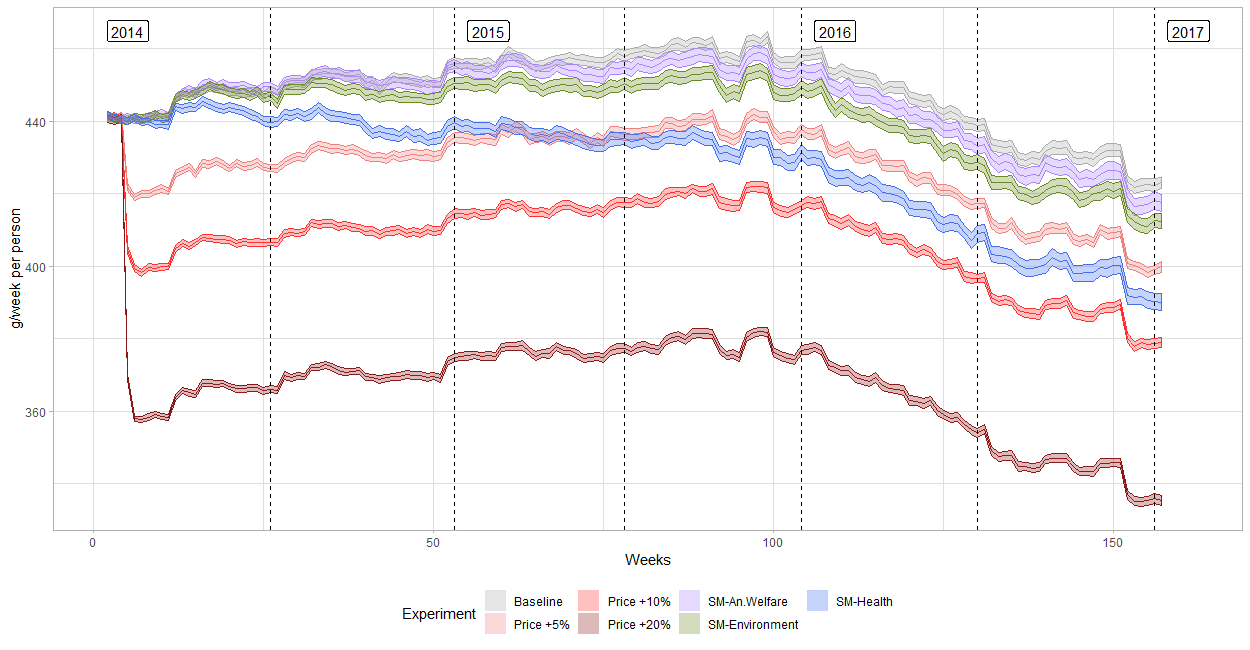
The first set of experiments compared two general approaches: price increase and social marketing. Under the first approach, we increased the price of meat by 5% as it was deemed a realistic initial increase of meat price; however, recent works on food taxation estimated the effects of a 10% and 20% tax (Afshin et al. 2017; Revoredo-Giha, Chalmers, & Akaichi 2018). With respect to the second approach, we simulated the launch of three campaigns each one focused on animal welfare, environment, or health. All campaign settings were the same to allow for comparisons: namely, the campaigns were directed to all agents without any distinction of age, sex, working status, or pre-existing concern, and a medium success rate was hypothesised. Contrary to the rise in prices, which lasted for the whole simulation period, each campaign was active only for the duration of the first year. Figure 3 shows the results of consumption during the simulation for the overall population.
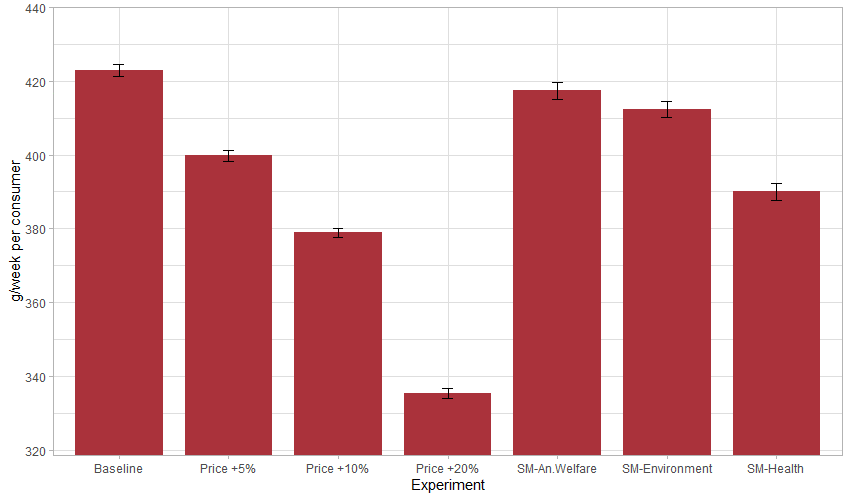
While the first year tends to show changes from the baseline model output, all scenarios showed a tendency to follow the original trends. All campaigns showed a significant change on the amount of consumption at the end of the simulations, although the magnitude of their effects differ (Figure 4). An environmental and animal welfare campaign showed a moderate decrease in consumption (-1.31%, p-value < 0.001, t = 3.87, and -2.49%, p-value < 0.001, t = 7.75). An increase of 5%, 10%, and 20% in price showed a larger effect, respectively: consumption decreased by 5.46% (p-value < 0.001, t = 21.19), 10.40% (p-value < 0.001, t = 42.68), and 20.69% (p-value < 0.001, t = 84.58) in the overall population compared to the baseline. The health campaign showed a reduction of 7.77% (p-value < 0.001, t = 23.09).
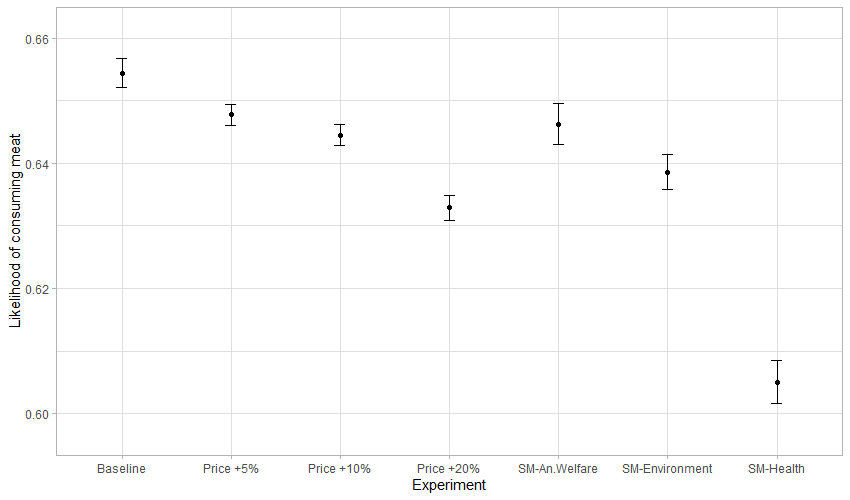
Similar results were obtained in relation to the likelihood of consuming meat, however the likelihood of eating meat under a 5% price increase did not decrease more than any social marketing campaigns (Figure 5). Both the environmental and health campaign showed a significant reduction of the likelihood of meat consumption (-2.41%, p-value < 0.001, t = 8.42, and -7.54% p-value < 0.001, t = 23.25, respectively). A 10% and 20% price increase reduced the likelihood of eating meat, respectively, by 1.50% (p-value < 0.001, t = 6.73) and 3.28% (p-value < 0.001, t = 13.84).
The price increases from the previous set of experiments were also analysed by income group of the agents. The low-income group had a lower intake of meat than the rest of the population independent of the experiment. Results showed that both income (low and med/high) groups altered their consumption in response to marketing campaigns compared to the baseline. A 5% price increase had a slightly higher impact on the group of low-income agents than on the rest of the population (weekly intake was reduced by 5.70% vs. 4.81%, respectively). However, higher increases in price slightly decreased the gap between the low-income group and medium-high agents (-10.53% vs. -10.05% for a 10% price increase, and -20.88% vs. 20.18% for a 20% price increase).
Boomerang effects
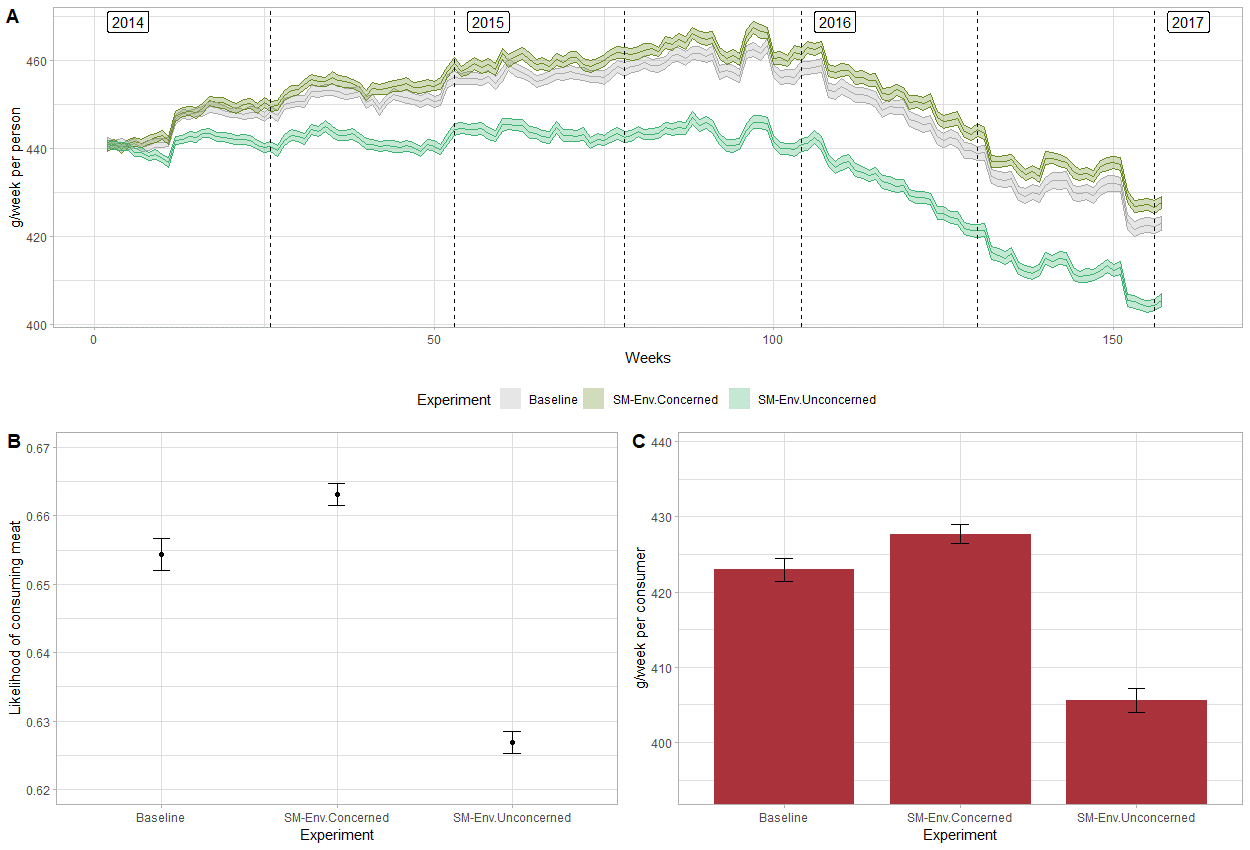
We modelled an environmental campaign targeting those agents with an environmental concern score within the upper and lower 12.5% of the overall rank score (resulting in about 7.5% of the artificial population for each case). Figure 6 shows the consumption over time and outcomes at the end of the simulations. When the environmental campaign is targeted only at people with concerns for the environment, the results showed a slight increment in the trend of consumption after the half of the first year (Figure 6a) that persists for the rest of the simulation. In the end, compared to the baseline consumption in the population increased by +1.12% rather than decreasing (p-value < 0.001, t = - 4.56). On the contrary, when the same campaign targeted people with low environmental concerns the overall population reduced consumption by -4.11% (p-value < 0.001, t = 15.42). Similar to consumption, the probability of eating meat followed the same pattern.
Discussion
The simulation model intended to replicate meat consumption in the adult population in Britain. Empirical data on consumers’ attitude towards and intake of meat was used to inform the simulations. In addition, peers’ influence on food choices was integrated in the model and its effect on consumption was studied. Overall, the model succeeded in reproducing the consumption pattern observed during the years 2014-2017. The consumption over this period of time was a point of reference to compare alternative scenarios built around strategies to reduce meat intake in the population.
In the first set of experiments the interventions did not deviate from the original trends of consumption that occurred after the first year in the baseline model. The response of the artificial population could signal the complexity of altering dietary patterns at the population level even in response to external interventions. Moreover, the first set of experiments compared a price increase against a social marketing strategy. The results from the model by Zhang et al. (2014) suggests that network influence may be more effective in increasing healthy food behaviour than any other strategies. The results from the experiments conducted with our model, specifically on meat consumption, suggests a more manifold response.
Firstly, the outcomes of an intervention based on social influence depends on the focus of the campaign. Targeting different aspect of the consequences of meat consumption generates different responses in the artificial population. In accordance with Wellesley, Happer, & Froggatt (2015), the emphasis on health obtained the greatest positive change among the marketing campaigns. Instead, when the focus was on the environmental and animal welfare more modest changes were gained. Such results are in accordance with Bravo et al. (2013), who modelled a rise in environmental education and did not notice any large change in consumption patterns. Animal welfare is deemed as a promising driver for meat reduction (Dibb & Fitzpatrick 2014), however, an animal welfare campaign did not show a great impact on consumption compared to other strategies of meat reduction. Interestingly, a campaign focused on health produced a decrease in consumption greater than the one achieved by a rise in price of 5%. However, greater reductions were observed by increasing the price further. Compared to a previous work by Afshin et al. (2017) that estimated for a 10% rise in prices there was around a 6% reduction in unhealthy food demand, our simulation showed a greater decrease in meat consumption (about 10%). This discrepancy might be due to the different objects of the interventions (unhealthy foods rather than specifically meat). A 20% price increase showed a substantial decrease in the weekly meat intake compared to all other scenarios, suggesting that it could be the most effective way to reduce meat consumption at the population level. It must be noted that the simulated marketing campaigns did not address specific groups of the population and a medium success rate was hypothesised: alternative settings could generate different patterns of consumption. Although an increase by 20% in prices led to the greatest consumption decrease, the likelihood of eating meat remained consistently high compared to the other interventions. In particular, the spread of health messages obtained the greatest success in reducing the probability of choosing meat compared to all other actions, which may suggest a further gradual decrease in intake over the successive years.
When analysed by income group, a 5% price increase exhibited a greater decrease in consumption for the low-income agents compared to the rest of the agents. This mirrors the findings from the report by the Department for Environment Food & Rural Affairs (2017b), which suggests that generally a rise in price is more difficult to cope with for low-income households as they spend a greater portion of their income on food compared to the rest of the population. In this sense, the model successfully reproduced the impact of price increase on different income groups. However, when the price was increased to 10% and 20% the gap between income classes became less distinctive. Such discrepancy could be explained by the fact that income was not included in our individual model of decision-making. The exclusion of such a factor was made in accordance with the preliminary analysis, which did not indicate income of the single respondent as a significant predictor of meat consumption. Such result is consistent with other works: for instance, Wellesley, Happer, & Froggatt (2015) do not reported any evidence in support of a correlation between household income and likelihood of consuming meat. Further research is needed to investigate the discrepancies that occur when considering data and decision-making models set at different levels (i.e. single consumers vs. households).
The second set of experiments explored the effects of targeting a group of the population based on their existing concerns. For this, we chose an environmental campaign as research suggested targeting those most concerned about environmental issues may be the most fruitful approach in the short term (Wellesley, Happer, & Froggatt 2015). In this case, the simulation output shows a significant increase in consumption in the overall population compared to the baseline model. The increase can be explained by the emergence of the so-called boomerang effects (Cho & Salmon 2007; Schultz et al. 2007), which indicate situations where a social marketing campaign focused on norms produced the opposite effect to the one that was aimed to generate. In this case agents characterised by having a high environmental concern are influenced by the marketing campaign to pay attention to others’ concerns. However, given the fact that they are at the edge of the maximum concern score it was difficult to find other agents with a higher environmental concern than themselves. As a result, the pressure towards conformity (i.e. the mean value of environmental concern in adjacent agents in the network) forces them to reduce their concern, which in turn increases the likelihood of eating meat.
Limitations and future research
Despite being able to reproduce the observed consumption pattern, the current model has some limitations. First, although the consumption trend that emerged from the simulation is qualitatively similar to the empirical one, quantitatively it differs slightly. Future research could include additional behaviours (e.g. food waste in processing) to account for such discrepancy. Second, although the impact of price increase is modelled differently based on agents’ income class, we did not introduce a marginal decay effect of rise of prices. This would require the addition of further external factors which were beyond the scope of the current work (e.g. increments in consumers’ purchasing power).
In relation to the process of influence, we gave the agents the capability of sensing each other’s concern without assuming discrepancies from the actual value. However, it is possible that in certain situations people may under- or over-state their actual concerns, bringing further complexity to the modelling work. In addition, the current model did not implement a hierarchical structure on the workplace network, which could potentially reflect real differences in terms of the power of any influence among workers. Given the randomness embedded into the construction of the networks, such a feature could make it harder to interpret the outputs, but the issue of intra-organisational team dynamics is nevertheless important. This would be a useful future development for the model. A specific model on the eating network in the context of workplace canteens and restaurants would be required in order to investigate if and when workers influence each other habits with respect to food. We did not include children in the household as it is unclear how much of a role they play in deciding meal choices or affecting concerns around meat consumption. However, some literature suggests that some adults with children make different food choices to accommodate them (Cairns, Angus, & Hastings 2009), and children can be influenced by their own peers (not modelled in our simulation). This is an aspect that could be explored in future research.
Finally, with respect to food consumption behaviour, we did not take into account potential differences in consumption pattern across different times of the day. It is possible that the influence among workers affect intake at lunch, while consumption trends remain stable at breakfast and dinner. Further refinements of the model could include an increase in the granularity of the observations.
Conclusion
This paper described an agent-based model of British consumers’ meat consumption. The model pays special attention to the influence exercised by colleagues in the workplace and household members at home. We grounded the model both theoretically and empirically and conducted a series of experiments to showcase the capability of the simulation to inform and evaluate different strategies aimed at reducing meat intake in the population.
The first set of experiments showed how the same process of influence can lead to different outcomes due to the heterogeneity of agents’ concerns around meat. In accordance with the literature, an animal welfare and environmental campaign led to modest changes in consumption, while a health campaign had a greater impact. Moreover, these set of experiments show that different interventions can lead to contrasting results in relation to agents’ intention (i.e. likelihood to eat meat) and behaviour (i.e. actual amount of meat consumed). The model showed that some interventions can produce boomerang effects, increasing the consumption rather than decreasing it. In developing the simulation, we imposed a series of limitations and assumptions which will be reviewed and used to extend the model in the future. In particular, the current model did not test any mixed strategy in line with the idea of starting by isolating the individual effect of single interventions. The simulation of sustainable workplace policies described by (García-Mira et al. 2017) suggested that the combination of different policy instruments may be more effective than single actions given that the former involves multiple drivers of change. To test this idea, it will be necessary to create scenarios where different configurations of campaigns with different settings run at the same time. The emergence of further patterns of consumption under different policy combination scenarios is expected, and such investigations will be particularly useful in providing an evidence base which policy designers can draw on when designing public strategies to reduce meat consumption.
Acknowledgements
This work was supported by The Scottish Government's Rural and Environment Science and Analytical Services Division (RESAS).Notes
- The model can be found at https://www.comses.net/codebase-release/0b9aabad-44b2-42ae-baf3-6400f5ebe5bb/.
- Since previous simulations showed that outputs did not qualitatively differ when using the overall sample, we opted for a subsample to lower computational requirements.
References
AFSHIN, A., Peñalvo, J. L., Gobbo, L. Del, Silva, J., Michaelson, M., O’Flaherty, M., Capewell, S., Spiegelman, D., Danaei, G., & Mozaffarian, D. (2017). The prospective impact of food pricing on improving dietary consumption: A systematic review and meta-analysis. PLoS ONE, 12(3): e0172277. [doi:10.1371/journal.pone.0172277]
AGRICULTURE AND HORTICULTURE DEVELOPMENT BOARD (2018). UK Cattle Yearbook 2018. Warwickshire, UK: AHDB.
AJZEN, I., & Fishbein, M. (1980). Understanding Attitudes and Predicting Social Bbehavior. Englewood Cliffs, NJ: Prentice-Hall.
ALEKSANDROWICZ, L., Green, R., Joy, E. J. M., Smith, P., & Haines, A. (2016). The Impacts of Dietary Change on Greenhouse Gas Emissions, Land Use, Water Use, and Health: A Systematic Review. PLoS ONE, 11(11), e0165797. [doi:10.1371/journal.pone.0165797]
ALLCOTT, H. (2011). Social norms and energy conservation. Journal of Public Economics, 95(9–10), 1082–1095. [doi:10.1016/j.jpubeco.2011.03.003]
ALLCOTT, H., & Rogers, T. (2012). How long do treatment effects last? Persistence and durability of a descriptive norms intervention’s effect on energy conservation (HKS Faculty Research Working Paper Series RWP12-045). Harvard, MA.
AUCHINCLOSS, A. H., Riolo, R. L., Brown, D. G., Cook, J., & Diez Roux, A. V. (2011). An agent-based model of income inequalities in diet in the context of residential segregation. American Journal of Preventive Medicine,40(3), 303–311. [doi:10.1016/j.amepre.2010.10.033]
BATES, B., Cox, L., Nicholson, S., Page, P., Prentice, A., Steer, T., & Swan, G. (2016). National Diet and Nutrition Survey Results from Years 5 and 6 (combined) of the Rolling Programme (2012/2013–2013/2014). London, UK. https://www.gov.uk/government/statistics/ndns-results-from-years-5-and-6-combined.
BELL, R., & Pliner, P. L. (2003). Time to eat: The relationship between the number of people eating and meal duration in three lunch settings. Appetite,41(2), 215–218. [doi:10.1016/s0195-6663(03)00109-0]
BLOK, D. J., De Vlas, S. J., Bakker, R., & Van Lenthe, F. J. (2015). Reducing income inequalities in food consumption: Explorations with an agent-based model. American Journal of Preventive Medicine, 49(4), 605–613. [doi:10.1016/j.amepre.2015.03.042]
BRAVO, G., Vallino, E., Cerutti, A. K., & Pairotti, M. B. (2013). Alternative scenarios of green consumption in Italy: An empirically grounded model. Environmental Modelling and Software, 47, 225–234. [doi:10.1016/j.envsoft.2013.05.015]
BRUCH, E., & Atwell, J. (2015). Agent-based models in empirical social research. Sociological Methods & Research, 44(2), 186–221. [doi:10.1177/0049124113506405]
CAIRNS, G., Angus, K., & Hastings, G. (2009). The extent, nature and effects of food promotion to children: A review of the evidence to 2008. Geneva, Switzerland. http://www.who.int/dietphysicalactivity/Evidence_Update_2009.pdf.
CHO, H., & Salmon, C. T. (2007). Unintended effects of health communication campaigns. Journal of Communication, 57 (2), 293–317. [doi:10.1111/j.1460-2466.2007.00344.x]
CIALDINI, R. B., Raymond, R., & Carl, K. (1990). A focus theory of normative conduct: Recycling the concept of norms to reduce littering in public places. Journal of Personality and Social Psychology, 58(6), 1015. [doi:10.1037//0022-3514.58.6.1015]
DE CASTRO, J. M. (1994). Family and friends produce greater social facilitation of food intake than other companions. Physiology and Behavior, 56(3), 445–455. [doi:10.1016/0031-9384(94)90286-0]
DEPARTMENT for Environment Food & Rural Affairs (DEFRA). (2017a). Family Food Statistics: https://www.gov.uk/government/collections/family-food-statistics.
DEPARTMENT for Environment Food & Rural Affairs (DEFRA). (2017b). Food Statistics Pocketbook 2016. London, UK.
DIBB, S., & Fitzpatrick, I. (2014). Let’s talk about meat: changing dietary behaviour for the 21st century. Eating Better: https://www.eating-better.org/uploads/Documents/LetsTalkAboutMeat.pdf.
FARROW, K., Grolleau, G., & Ibanez, L. (2017). Social norms and pro-environmental behavior: A review of the evidence. Ecological Economics,140, 1–13. [doi:10.1016/j.ecolecon.2017.04.017]
FERRARO, P. J., Miranda, J. J., & Price, M. K. (2011). The persistence of treatment effects with norm-based policy instruments: Evidence from a randomized environmental policy experiment. American Economic Review, 101, (3), 318–322. [doi:10.1257/aer.101.3.318]
FEUNEKES, G. I. J., De Graaf, C., Meyboom, S., & Van Staveren, W. A. (1998). Food choice and fat intake of adolescents and adults: Associations of intakes within social networks. Preventive Medicine, 27(5 I), 645–656. [doi:10.1006/pmed.1998.0341]
FISHBEIN, M., & Ajzen, I. (1975). Belief, Attitude, Intention and Behavior: An Introduction to Theory and Research. Reading, MA: Addison-Wesley.
GARCÍA-MIRA, R., Dumitru, A., Alonso-Betanzos, A., Sánchez-Maroño, N., Fontenla-Romero, Ó., Craig, T., & Polhill, J. G. (2017). Testing scenarios to achieve workplace sustainability goals using backcasting and agent-based modeling. Environment and Behavior, 49(9), 1007–1037. [doi:10.1177/0013916516673869]
GERBER, P.J., Steinfeld, H., Henderson, B., Mottet, A., Opio, C., Dijkman, J., Falcucci, A. & Tempio, G. (2013).Tackling climate change through livestock – A global assessment of emissions and mitigation opportunities. Rome, Italy: Food and Agriculture Organization of the United Nations (FAO).
GODFRAY, H. C. J., Aveyard, P., Garnett, T., Hall, J. W., Key, T. J., Lorimer, J., Pieerrehumbert, R. T., Scarborough, P., Springmann, M., & Jebb, S. A. (2018). Meat consumption, health, and the environment. Science, 361(6399). [doi:10.1126/science.aam5324]
GRIMM, V., Berger, U., DeAngelis, D. L., Polhill, J. G., Giske, J., & Railsback, S. F. (2010). The ODD protocol: A review and first update. Ecological Modelling, 221(23), 2760–2768. [doi:10.1016/j.ecolmodel.2010.08.019]
HAINES, M., & Spear, S. F. (1996). Changing the perception of the norm: A strategy to decrease binge drinking among college students. Journal of American College Health, 45(3), 134–140. [doi:10.1080/07448481.1996.9936873]
HAMILL, L., & Gilbert, N. (2010). Simulating large social networks in agent-based models: A social circle model. Emergence: Complexity and Organization,12(4), 78–94.
HENNESSY, E., Ornstein, J. T., Economos, C. D., Herzog, J. B., Lynskey, V., Coffield, E., & Hammond, R. A. (2016). Designing an Agent-Based Model for Childhood Obesity Interventions: A Case Study of Child Obesity180. Preventing Chronic Disease, 13, 150414. [doi:10.5888/pcd13.150414]
HORGAN, G. W., Scalco, A., Craig, T., Whybrow, S., & Macdiarmid, J. I. (2019). Social, temporal and situational influences on meat consumption in the UK population. Appetite, 138, 1–9. [doi:10.1016/j.appet.2019.03.007]
HORNE, C., & Kennedy, E. H. (2017). The power of social norms for reducing and shifting electricity use. Energy Policy, 107, 43–52. [doi:10.1016/j.enpol.2017.04.029]
INTERGOVERNMENTAL PANEL ON CLIMATE CHANGE (IPCC). (2019). Climate Change and Land. An IPCC Special Report on climate change, desertification, land degradation, sustainable land management, food security, and greenhouse gas fluxes in terrestrial ecosystems. (A. Arneth, H. Barbosa, T. Benton, K. Calvin, E. Calvo, S. Connors, A. Cowie, ..., Z. Zommers, Eds.). Geneva, Switzerland: World Meteorological Organization: www.ipcc.ch.
LOMBARDI-BOCCIA, G., Lanzi, S., & Aguzzi, A. (2005). Aspects of meat quality: Trace elements and B vitamins in raw and cooked meats. Journal of Food Composition and Analysis, 18(1), 39–46. [doi:10.1016/j.jfca.2003.10.007]
MCPHERSON, M., Smith-Lovin, L., & Cook, J. M. (2001). Birds of a feather: Homophily in social networks. Annual Review of Sociology,27, 415–444. [doi:10.1146/annurev.soc.27.1.415]
MÜLLER, B., Bohn, F., Dreßler, G., Groeneveld, J., Klassert, C., Martin, R., Schlüter, M., Schulze, J., Weise, H., Schwarz, N. (2013). Describing human decisions in agent-based models - ODD+D, an extension of the ODD protocol. Environmental Modelling and Software, 48, 37–48. [doi:10.1016/j.envsoft.2013.06.003]
NATALINI, D., & Bravo, G. (2014). Encouraging sustainable transport choices in American households: Results from an empirically grounded agent-based model. Sustainability, 6 (1), 50–69. [doi:10.3390/su6010050]
NATCEN SOCIAL RESEARCH. (2016). British Social Attitudes Survey, 2014 (2nd Ed.). Colchester, UK: UK Data Archive.
NIJDAM, D., Rood, T., Westhoek, H. (2012). The price of protein: Review of land use and carbon footprints from life cycle assessments of animal food products and their substitutes. Food Policy, 37, 760–770. [doi:10.1016/j.foodpol.2012.08.002]
NOLAN, J. M., Schultz, P. W., Cialdini, R. B., Goldstein, N. J., & Griskevicius, V. (2008). Normative social influence is underdetected. Personality and Social Psychology Bulletin, 34 (7), 913–923. [doi:10.1177/0146167208316691]
OFFICE for National Statistics. (2016). Statistical bulletin: Families and households in the UK: 2016: https://www.ons.gov.uk/.
PACHUCKI, M. A., Jacques, P. F., & Christakis, N. A. (2011). Social network concordance in food choice among spouses, friends, and siblings. American Journal of Public Health, 101(11), 2170–2177. [doi:10.2105/ajph.2011.300282]
PERIGNON, M., Vieux, F., Soler, L. G., Masset, G., & Darmon, N. (2017). Improving diet sustainability through evolution of food choices: Review of epidemiological studies on the environmental impact of diets. Nutrition Reviews, 75(1), 2–17. [doi:10.1093/nutrit/nuw043]
R DEVELOPMENT CORE TEAM. (2008). R: A Language and Environment for Statistical Computing. Vienna, Austria: R Foundation for Statistical Computing.
REVOREDO-GIHA, C., Chalmers, N., & Akaichi, F. (2018). Simulating the impact of carbon taxes on greenhouse gas emission and nutrition in the UK. Sustainability, 10(2), 134. [doi:10.3390/su10010134]
ROBINSON, E., Fleming, A., & Higgs, S. (2014). Prompting healthier eating: Testing the use of health and social norm based messages. Health Psychology, 33(9), 1057–1064. [doi:10.1037/a0034213]
SCHULTZ, P. W., Nolan, J. M., Cialdini, R. B., Goldstein, N. J., & Griskevicius, V. (2007). The constructive, destructive, and reconstructive power of social norms. Psychological Science, 18(5), 429. [doi:10.1111/j.1467-9280.2007.01917.x]
SHOHAM, D. A., Tong, L., Lamberson, P. J., Auchincloss, A. H., Zhang, J., Dugas, L., Kaufman, J. S., Cooper, R. S., & Luke, A. (2012). An actor-based model of social network influence on adolescent body size, screen time, and playing sports. PLoS ONE, 7(6): e39795. [doi:10.1371/journal.pone.0039795]
SQUAZZONI, F. (2012). Agent-Based Computational Sociology. Hoboken, NJ: John Wiley & Sons.
STEHFEST, E., Bouwman, L., Van Vuuren, D. P., Den Elzen, M. G. J., Eickhout, B., & Kabat, P. (2009). Climate benefits of changing diet. Climatic Change, 95(1–2), 83–102. [doi:10.1007/s10584-008-9534-6]
STOK, F. M., De Ridder, D. T. D., De Vet, E., & De Wit, J. B. F. (2014). Don’t tell me what I should do, but what others do: The influence of descriptive and injunctive peer norms on fruit consumption in adolescents. British Journal of Health Psychology, 19(1), 52–64. [doi:10.1111/bjhp.12030]
TIFFIN, R., Balcombe, K., Salois, M., & Kehlbacher, A. (2011). Estimating Food and Drink Elasticities. University of Reading: https://assets.publishing.service.gov.uk/government/uploads/system/uploads/attachment_data/file/137726/defra-stats-foodfarm-food-price-elasticities-120208.pdf.
WELLESLEY, L., Happer, C., & Froggatt, A. (2015). Changing Climate, Changing Diets Pathways to Lower Meat Consumption. Chatham House Report: https://www.chathamhouse.org.
WILENSKY, U. (1999). NetLogo. Evanston, IL: Center for Connected Learning and Computer-Based Modeling, Northwestern University: http://ccl.northwestern.edu/netlogo/.
WORLD CANCER RESEARCH FUND, & American Institute for Cancer Research. (2007). Food, nutrition, physical activity, and the prevention of cancer: A global perspective cancer research: https://www.wcrf.org.
ZHANG, D., Giabbanelli, P. J., Arah, O. A., & Zimmerman, F. J. (2014). Impact of different policies on unhealthy dietary behaviors in an urban adult population: An agent-based simulation model. American Journal of Public Health, 104(7), 1217–1222. [doi:10.2105/ajph.2014.301934]