
Introduction
In 1785, the philosopher Jeremy Bentham wrote an article critically examining the harshness with which homosexuality was treated in England (Bentham & Crompton 1978). He could not find a sound basis for such unforgiving treatment. Yet, for many centuries before and the centuries thereafter, gays have been stigmatized. However, in the last few decades, some parts of the world have experienced a significant change in their attitudes towards gays. In Great Britain, the fraction of adults expressing disapproval of sexual relations between adults of the same gender declined from 64% in 1987 to 22% in 2012 (Park & Rhead 2013).[1] In the United States, there has been a comparable change in attitude as reflected, for example, in the growing acceptance of same-sex marriage. In 2001, the Pew Research Center reported that 57% of Americans disapproved of same-sex marriage with only 35% expressing approval. By 2016, those numbers had almost flipped, as 55% approved and 37% disapproved.[2] Of course, in some sub-groups of the United States and in many parts of the world, homosexuality is still a powerful stigma and associated with it is an intolerance of gays (Adamczyk 2017).
The changing attitudes regarding gays highlights the endogeneity of an attribute as a stigma and naturally raises questions of what would lead to a movement from intolerance to tolerance. The objective of this paper is to investigate theoretically the social dynamics of stigma towards deriving insight into the conditions conducive to a society expressing acceptance of those previously stigmatized. What change in social conditions can disrupt a norm of intolerance? What are the conditions sustaining a norm of acceptance?
To address these questions, we begin with the pioneering perspective of Goffman (1963) on stigma, which he defines as an attribute that signals a deviation from the social norm and can be a source of harmful discrimination. In his micro-social theory of stigma, there are three types of actors. There are those endowed with the attribute which may be considered a stigma by others in society. Then there are those who are free of such an attribute, of which there is a subset, which Goffman refers to as "the wise," who are sympathetic toward the stigmatized few. The emphasis in his theory is on the one-on-one relationship between these three types of actors rather than the attributes themselves: "The term stigma, then, will be used to refer to an attribute that is deeply discrediting, but it should be seen that a language of relationships, not attributes, is really needed." (Goffman 1963, p. 3.)
In spite of the emphasis placed by Goffman on relationships, a literature review fifty years later noted the striking absence of research taking that perspective:
As Goffman (1963) reminded us early on, stigma is fundamentally a social phenomenon rooted in social relationships and shaped by the culture and structure of society. As such, the solution to understanding and changing must similarly be embedded in social relationships and changing the structures that shape social relationships. Yet the research in this area remains at an early stage and primitive in nature. (Pescosolido & Martin 2015, p. 105)
Towards understanding social norms regarding stigma, this paper develops a computational framework that encompasses the macro-social implications of the inter-personal relationships among different types of actors and thereby goes beyond the micro-sociological treatment of stigma. Following Goffman (1963), we incorporate three types of agents in our model. First, we divide the population into those with and without the stigmatizing trait. An agent with the stigmatized trait is modelled as deciding whether or not to reveal the distinctive trait. This decision will depend on the extent to which others in the agent's social network are accepting of those with the trait. Using Goffman's (1963) language, the stigma considered here is then of the discreditable type.[3] Some examples include sexual orientation, mental disorder, drug addiction, alcoholism, criminal background, certain traits of ethnic group, nationality, or of religion that is deemed a deviation from the accepted norms (including atheism). For those agents in the majority without that trait, they decide whether or not to be accepting of those with the trait. Consistent with diffusion models, some of those agents make their decision based on a desire to conform, and, therefore, are tolerant if and only if enough other agents in their social networks are tolerant. Distinct from previous diffusion models, we encompass another type of agent who is modelled on "the wise" as described by Goffman (1963). These agents do not have the trait but are compassionate with regards to those who are stigmatized. They are accepting as long as there are some in their social networks known to have the trait.
The presence of these three types of agents introduces a rich triadic dynamic. Those with the distinctive trait will only reveal if there are enough accepting agents in their networks. Those who are sympathetic towards the stigmatized will express their support but only if the stigmatized reveal themselves. And those who are conformists will be accepting of the stigmatized only when enough other agents have expressed acceptance. With these social relationships operating within a population over time, there are two potential drivers of tolerance that we explore. First, how does the relative presence of compassion and conformity in a society affect whether a norm of acceptance develops? We find that both traits have a role to play and that acceptance is maximized when there is a mix of agents, some who are compassionate and some who conform.[4] Second, how does the insularity of agents' social networks - by which we mean the extent to which links are local and thus there are many shared friends - affect whether a norm of acceptance develops? This question is central to the diffusion models of Watts & Strogatz (1998) and Centola & Macy (2007), and has its roots in the seminal work of Granovetter (1973). Here, we find that the insularity of networks interacts with the mix of compassion and conformity. When conformity is strong in a society, highly insular networks are conducive to tolerance. However, when conformity is weak and compassion is strong, the weak ties of Granovetter (1973) and Watts & Strogatz (1998) can promote tolerance.
Our research has implications for two distinct strands of research. First, the micro-sociological study of stigma starting with Goffman (1963), which, while empirically rich and insightful, has been restricted to considering one-on-one relationships between the different actors in a system. How such inter-personal relationships may spill over and ultimately change the social status of stigma at the macro level has not been explored. Our work provides a way to bridge that gap by explicitly modelling the structure of interactions among different types of agents and tracking the endogenous macro-level outcome of such interactions over time.
Second, there is the voluminous literature modelling social diffusion which generally assumes that an individual's decision to adopt or reject the object of interest depends on how widely it has been adopted among a relevant subset of agents such as friends, colleagues, and neighbors (Rogers 2003; Valente 1995). The object of interest may be a technological innovation such as a new farming practice (Ryan & Gross 1943), a management practice (Strang & Soule 1998), a cultural fad such as what clothes to wear (Crane 1999), a residential choice such as where to live (Schelling 1971), or an antisocial act such as participating in a riot or a strike (Bohstedt & Williams 1988; Conell & Cohn 1995). The situation is fundamentally different, however, when the "object of interest" is a person rather than an idea or a practice, and the decision is whether to approve or disapprove of them. That the object is a person adds two additional agent types to the usual presence of conformists in a model of social diffusion. First, there are those individuals whose decision to accept or reject the stigmatized is driven not by conformity but by the value they attach to stigmatized agents' well-being. In other words, they care about them and that is determinative. Second, those stigmatized agents decide whether to reveal their stigma, and it is only through disclosure can the compassionate agents be induced to act. The presence of the three types of agents introduces a new triadic dynamic to social diffusion models. One of the contributions of this paper is to begin to understand the implications of this dynamic, how it depends on the structure of the social network, and what can cause a shift in social norms.
Our work also fits into the sociological and social psychological literature on social approval and conformity. Within this enormous literature, our model is most closely related to those that address the behavior of individuals who, driven by the desire to conform, act against their own belief. This literature includes research on preference falsification (Kuran 1995), pluralistic ignorance (Prentice & Miller 1993), spiral of silence (Noelle-Neumann 1974), and false enforcement of unpopular norms (Bicchieri 2006; Centola et al. 2005; Willer et al. 2009). Of particular interest is the agent-based computational model in Centola et al. (2005), in which the population of agents make compliance and enforcement decisions over a given norm. Embedded in their population is a small group of "true believers" whose conviction is so strong that they always comply with the norm regardless of the compliance by other agents. The remaining population consists of believers and disbelievers whose compliance and enforcement of the norm depend on the observed actions of others, similar to our conformists. The focus of their study is on the "false enforcement" by false disbelievers (who privately oppose but publicly support the norm), whereby they engage in pressuring others to comply with the norm "to avoid exposure as an opportunistic imposter." While there are some similarities between their true believers and our compassionists, and between their disbelievers and our conformists, the two models diverge in two important aspects. First, we focus on the acceptance/opposition (compliance) behavior of the agents without modeling their enforcement behavior. In our model the observed compliance by other agents is the sole determinant of the conformists' acceptance decisions -- there is no pressuring of others for signaling purposes in our model. Second, the stigmatized agents in our model, through their decision to reveal or hide their trait, take the central role in the social dynamics of the stigmatizing behavior between the compassionists and conformists. It is the exploration of this triadic dynamic between the three agent types which makes our contribution unique.
Finally, our work is closely aligned with the line of research on “status construction theory” as first presented in Ridgeway (1991), then refined and formalized in Ridgeway & Balkwell (1997) and Mark et al. (2009). The central question in this line of research is how to explain the presence of status differentiation between social groups that are observationally distinct in terms of their nominal characteristics. Ridgeway (1991) presented an intuitive explanation for the differential status values based on differences in the resource ownership levels of the individuals. This verbal argument was formalized in Ridgeway & Balkwell (1997), which offered an explicit model of the belief diffusion process. These earlier works explained the differential status values on the basis of resource ownership by assuming a pre-existing correlation between the nominal characteristic and the resource characteristic of individuals. Mark et al. (2009), using two micro-level mechanisms – status belief diffusion and status belief loss – were able to extend the theory by showing that consensual status beliefs can emerge even in the absence of any explicit status-relevant variable such as resources. The earlier model of status construction theory was most recently extended by Grow et al. (2017). By developing a computational model that integrates the status construction theory with the network theory, they showed that a structural characteristic of social networks such as local clustering can have a significant impact on the diffusion of status beliefs, resulting in noticeable regional variation in status beliefs.
There is a clear conceptual linkage between social status and social stigma – the target of our investigation – to the extent that a display of the stigmatized trait confers a lower social status to the person with such trait. In this context, stigma can be viewed as a realization of particular status ranking as agreed upon by the members of the society. The status construction theory addresses the process by which such ranking gets established, while, in our model of social stigma, we take the existence of such ranking as given but explore the process by which it can be neutralized or reinforced through individual choices to accept or reject those with the stigmatized trait. Nevertheless, the diffusion mechanism driving the changes in attitude toward stigma in our model is very much in line with the mechanism driving the diffusion of status beliefs on social groups. Grow et al. (2017) is particularly relevant in this regard, as the “clustered” network structure they consider is similar to that in our model where interactions among individuals are partially constrained by the community structure of the social system. Their contribution is in showing that the presence and the extent of belief inertia (in the form of consensus threshold) and the local clustering of interaction networks significantly influence the diffusion of social status beliefs. They, however, assumed homogeneity among individuals in that the level of belief inertia was specified to be uniform across the population. In addition, they considered the degree of clustering in the networks only as an either-or proposition as their analysis was limited to the networks being either clustered by a fixed degree or not clustered at all. Our model diverges from theirs in two important aspects. First, given that our study of social stigma considers the interaction between compassion and conformity as well as the disclosure behavior of the stigmatized individuals, we explicitly introduce heterogeneous and type-dependent thresholds for individuals’ acceptance of stigma. Second, we consider a wide variation in the local specificity (local clustering) of networks. These extensions allow us to examine in detail the impact network structure has on the interactive dynamic between the different types and the resulting level of acceptance in the population. We believe these extensions and the results are relevant for the study of status construction process as it pertains to a particular form of social status as implied by the stigmatizing behavior.
The Model
Spatial environment
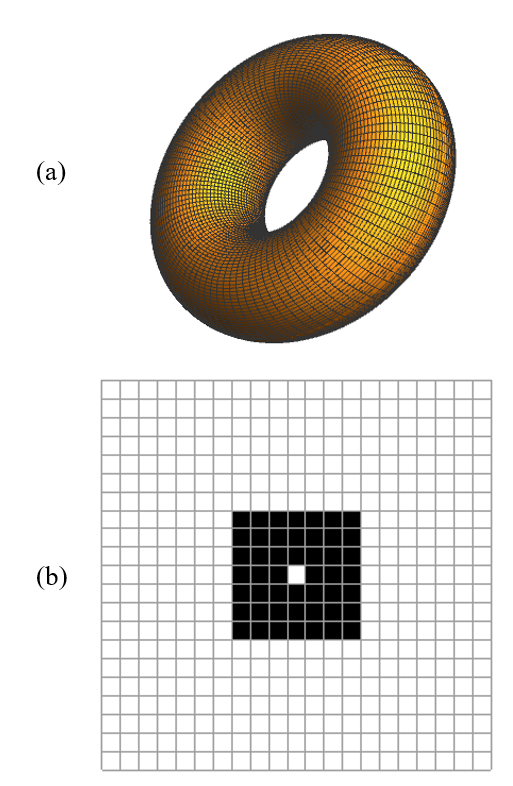
There is a fixed population of agents, \(M \equiv \{1, \dots, m\}\), who are distributed over a two-dimensional \(X\times Y\) lattice. One agent is located at each point (or node) on the lattice — so \(m = |X|\ast|Y|\) — where a point (\(x\),\(y\)) represents an agent's location. The lattice wraps around from right to left and from top to bottom, forming a torus; see Figure 1a. The use of a torus ensures symmetry in the physical environment for all agents, hence avoiding a potential edge effect.[5] Each agent \(i\) has a ''neighborhood'', denoted \(N(i)\), that consists of all other agents within the Moore neighborhood of range \(n\).[6] This means that each agent has \((2n+1)^2-1\) neighbors. As a patch from the torus in Figure 1a, Figure 1b gives an example of a Moore neighborhood of range 3 for the agent represented by the hollow square at the center.
Agents: Networks and types
Agent \(i\) has a social network, denoted \(L(i)\), that consists of \(l\) links with a subset of other agents in the population: \(L(i) \in \{B|B\subset M, |B|=l, i\notin B\}\). A network is naturally thought of as family and friends, and links are assumed to be symmetric: \(j\in L(i)\iff i\in L(j)\). Most, though not necessarily all, of these links are with the agent's neighbors. The construction of the network is described in Section 3.
Some agents may be endowed with a trait that could be the basis for a stigma. We refer to them as stigmatized (though recognizing that whether the attribute is a stigma is endogenous). The stigma considered here is of the discreditable type, such as homosexuality and atheism. The decision faced by a stigmatized agent is whether to reveal the attribute. The remainder of the population comprises agents lacking the attribute, who are referred to as normal. Their decision is whether to accept those with the attribute; that is, whether or not to stigmatize them. (It should be noted that the term “normal” is Goffman’s parlance in his book. We use the term purely for the sake of retaining consistency with the original work that our model derives from.)
A stigmatized type, which we also refer to as a type \(S\), would like to reveal that he has the attribute but is concerned with being ostracized. It is assumed that he will choose to "reveal" if and only if the fraction of agents in his social network who are accepting of those with this trait equals or exceeds a critical threshold \(τ^s \in (0, 1)\). It is assumed that when a stigmatized agent reveals his trait that he also expresses acceptance of others like him.
A normal agent decides whether or not to express his acceptance of those with the stigmatized trait. There are two types of normal agents, and they differ in the basis upon which they make the decision to accept the stigmatized. The acceptance decision of a conformist (CNF) is driven by a desire to conform. He will accept the stigmatized if and only if the fraction of agents in his network that have expressed their acceptance of the stigmatized is at least some critical value \(τ^{CNF} \in (0, 1)\). The conformist type is common in diffusion models. There is a second normal type whose decision of whether to accept the stigmatized is based on caring about those in her network. A compassionist (CMP) will accept the stigmatized if and only if the fraction of agents in her network with the stigmatizing trait (and who have revealed it) is at least some critical value \(τ^{CPM} \in (0, 1)\). Thus, in making their acceptance decisions, conformists rely on what all other agents are doing, while compassionists respond to the stigmatized. The compassionist type is unique to diffusion models but is natural given the "object" of diffusion involves people, as opposed to ideas or practices.
In sum, agent \(i\) can be one of three possible types: \(z(i)\in \{S, CNF, CMP\}\). The critical thresholds are common within each agent type, but differ between the three types, and stay fixed over time. The higher is an agent's threshold, the more resistant she is to changing her status as it takes a bigger fraction of her network links to induce the change. For a normal agent, the threshold represents the degree of her "intolerance" toward the stigmatized, while for a stigmatized agent it represents his "reluctance" to reveal himself for fear that he may be ostracized by those in his network. Finally, it is assumed that a proportion \(s\) of the population are stigmatized and the remaining proportion (\(1- s\)) are normal. Of the normal population, a proportion \(w\) are specified as conformists and (\(1-w\)) as compassionists. Hence, given the population of \(m\) agents, there are \(s\cdot m\) agents who are stigmatized, \((1-s)\cdot m\cdot w\) conformists, and \((1-s)\cdot m\cdot (1-w)\) compassionists.
Agent states and state transition rules
At any moment of time, the state of a stigmatized agent is either "revealed" (in which case he has also expressed acceptance of the stigmatized) or "hidden" (in which case he has not expressed acceptance with regards to the stigmatized). The state of a normal agent is either she has expressed acceptance of the stigmatized or not. With a conformist, we refer to the "not acceptance" state as "opposition," while for a compassionist (and a stigmatized agent) we refer to it as "neutral." While this semantic distinction is not important for the ensuing analysis, as the focus is on how many are accepting of the stigmatized, it seems natural to think of the "non-accepting" state as meaning opposition (otherwise, there is no harm from being stigmatized) with the exception of the compassionists who do not express either acceptance or opposition until they feel a compulsion to support those in their social network.
Although it will be assumed that most of the stigmatized agents in the population start out by hiding their trait, it is essential for there to be a small seed group who have revealed so that the diffusion process can be initiated. One could imagine that they are the brave or principled few or that the possession of the trait was inadvertently revealed. We may also allow some of the normal agents to start in the state of acceptance, though most (and sometimes all) will start in the state of non-acceptance. Notationally, a proportion \(p^r\) of the stigmatized start out as "revealed" (and, therefore, "accepting"), and a proportion \(p^a\) of the normals start out as "accepting." Note that the population begins in a state for which the social norm is intolerance (\(p^a\) is low) and the stigmatized are hidden (\(p^r\) is low).[7]
From these initial conditions for the population, let us describe how the state of the population evolves. For this purpose, we denote by \(\alpha_i^t \in \{N, A, O\}\) the expression of attitude state of agent \(i\) in period \(t\), where \(N\) denotes "neutral," \(A\) denotes "acceptance,"and \(O\) denotes "opposition." Likewise, we denote by \(\beta_i^t \in \{R, H\}\) the disclosure state of (stigmatized) agent \(i\) in period \(t\), where \(R\) denotes "revealed" and \(H\) denotes "hidden." The state of an individual agent's network in period \(t\) is summarized by \(r_i^t\) and \(a_i^t\), where \(r_i^t\) is the proportion of revealed type-S agents in \(i\)'s network and \(a_i^t\) is the proportion of accepting agents in \(i\)'s network:
| $$r_i^t = \frac{|\{j\in L(i)|\beta_j^t=R\}|}{|L(i)|} $$ | (1) |
| $$a_i^t=\frac{|\{j\in L(i)|a_j^t=A\}|}{|L(i)|}$$ | (2) |
For all \(t\geq 1\) an individual agent's states are updated based on the following rules:
- For all \(i\) with \(z(i) = S\):
- If \((\alpha_i^{t-1},\beta_i^{t-1})=(A,R)\), then \((\alpha_i^t,\beta_i^t)=(A,R)\);
- If \((\alpha_i^{t-1},\beta_i^{t-1})=(N,H)\), then
| $$(\alpha_i^t,\beta_i^t)= \begin{cases} (N,H) \quad \text{if}\quad 0\leq a_i^{t-1}<\tau^S\\ (A,R)\quad\text{if}\quad\tau^S\leq a_i^{t-1}\leq 1\text{.} \end{cases}$$ | (3) |
- For all \(i\) with \(z(i) = CNF\):
| $$\alpha_i^t= \begin{cases}O\quad\text{if}\quad 0\leq a_i^{t-1}<\tau^{CNF}\\ A\quad\text{if}\quad \tau^{CNF}\leq a_i^{t-1}\leq 1 \text{.} \end{cases}$$ | (4) |
- For all \(i\) with \(z(i)\) \(=\) \(CMP\):
| $$\alpha_i^t= \begin{cases} N\quad\text{if}\quad 0\leq r_i^{t-1}<\tau^{CMP}\\ A\quad\text{if}\quad \tau^{CMP}\leq r_i^{t-1}\leq 1 \text{.} \end{cases}$$ | (5) |
It should be noted that all agents’ attitudes are updated synchronously at the beginning of each time step, rather than consecutively, so that an agent’s updating in a given period does not affect another agent’s updating in the same period.
Setting Up the Computational Experiments
Parameter specifications
We create a population of 10,000 agents \((m= 10,000)\) and distribute them on a 100 x 100 grid which forms the outer surface of a torus.[9] Each agent is assigned its type at the outset based on the two parameters, \(s\) and \(w\); we set \(s=\) so that 10% of the population are stigmatized. The 1,000 stigmatized agents and 9,000 normal agents are randomly allocated over the torus. Out of those 9,000 normal agents, a proportion \(w\) are randomly selected to be conformists (CNFs) with the rest as compassionists (CMPs).
The first issue of interest is how the proclivity for compassion and conformity in the population affects the rate of social acceptance. To explore this issue, we consider \(w\in \{0, 0.1, 0.2,\dots, 1\}\). The normal population consists only of compassionists when \(w=0\) and only of conformists when \(w=1\). For \(0<w<1\), the population has a mixture of the two types.
The second issue is how the structure of the social networks affects the diffusion process and ultimately the steady-state rate of acceptance. The focus is on the degree of insularity of networks. One can think of agent \(i\)'s neighborhood \(N(i)\) as defined by proximity in terms of geography (those in the same town) or education or income or some other trait. The issue is to what extent agent \(i\)'s social network \(L(i)\) is largely drawn from that community or instead has links with those in other regions, educational levels, or income levels. The more that \(L(i)\) is drawn from \(N(i)\), the more insular are networks. [10]
More formally, we construct the network for each individual, \(L(i)\), by creating links from different regions of the space. For each agent \(i\), most of her network connections will come from her own neighborhood, \(N(i)\), while the remaining connections come from outside, \(M-N(i)-\{i\}\). Specifically, each connection in \(i\)'s network is randomly selected from \(M-N(i)-\{i\}\) with probability \(q\) and from \(N(i)\) with probability \((1-q)\). The range of the Moore neighborhood, \(n\), is assumed to be 3 in our experiments. Hence, each agent has \(48(=(2\times 3+1)^2-1)\) neighbors. A fraction \((q)\) of his network connections comes from these 48 agents in her neighborhood, while the remaining fraction q come from the other 9,951 agents. We consider \(q\in \{0, 0.05, 0.1, 0.15, 0.2, 0.3,\dots, 0.9, 1\}\), where \(q=0\) is the benchmark case for our presentation. When \(q=0\), the networks are close to being regular lattice networks and are highly insular.[11] As \(q\) rises above zero, an increasing fraction of an agent's network connections come from outside of his neighborhood. Our network model is a version of the well-known “stochastic block models” which explicitly introduce the concept of “local communities” into the generation of social networks; see Abbe (2018) for a recent and comprehensive survey of this group of generative network models.
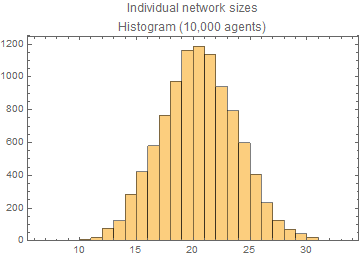
The size of an agent's network (i.e., the number of links) is specified to be \(l=20\). However, given that the networks are bidirectional, assigning a fixed network size for every agent in the population may not be feasible. Even when it is feasible, it is computationally intensive to construct the bidirectional networks of equal size across the entire population. Instead, we impose the condition that the networks for the population achieve a mean size of 20, which reduces the computational intensity considerably. Subject to the networks having mean size of 20, we then construct individual networks through a random matching algorithm assuming symmetry; if \(j\) is in \(i\)'s network, then \(i\) is also in \(j\)'s network. The random matching is done sequentially for each agent in the population until the average network size reaches 20. Figure 2 shows the distribution of network sizes across agents from this procedure.[12]
The initial conditions for the population are given by \(p^r\) (the proportion of stigmatized agents who are revealed) and \(p^a\) (the proportion of the normal agents who are accepting). We consider \(p^r\in \{0.15, 0.25\}\) and \(p^a\in \{0, 0.025\}\). \(p^a\) is kept low because if many normal agents were initially accepting then preliminary simulations showed that acceptance prevails almost irrespective of the other parameters. For our parameterizations, we want the obtaining of a norm of social acceptance to be challenging but feasible so that we can assess the conditions that promote it. Given that there are 1,000 stigmatized agents and 9,000 normal agents, when \((p^r,p^a) = (0.25, 0.025)\), the number of initially revealed stigmatized agents is \(250(=1000\ast 0.25\)), which is of the same order of magnitude as the number of initially accepting normal agents, \(225=(9000\ast 0.025)\). The baseline values and the set of all parameter values used in the simulations are provided in Table 1.
| parameter | description | baseline | all values |
| \(m\) | population size | 10,000 | 10,000 |
| \(n\) | range of the Moore neighborhood, \(N (i)\) | 3 | 3 |
| s | proportion of the population with stigma | 0.1 | 0.1 |
| \(1 - s\) | proportion of the population w/o stigma | 0.9 | 0.9 |
| \(w\) | proportion of the normals who are conformists | 0.3 | {0, 0.1, …, 1} |
| \(1 – w\) | proportion of the normals who are compassionists | 0.7 | {0, 0.1, …, 1} |
| \(q\) | probability \(i\)’s network link is from M-i-N(i) | 0 | {0, 0.05, …, 1} |
| \(1 – q\) | probability\(i\)’s network link is from N(i) | 1 | {1, 0.95, …, 0} |
| \(l\) | mean network size | 20 | 20 |
| \(p^r\) | proportion of stigmatized agents revealed at t = 0 | 0.15 | {0.15, 0.25} |
| \(p^a\) | proportion of normal agents accepting at t = 0 | 0 | {0, 0.025, 0.05, 0.1} |
| \(τ^{CNF}\) | acceptance threshold for conformists | 0.3 | {0.3, 0.35, 0.4} |
| \(τ^{CMP}\) | acceptance threshold for compassionists | 0.05 | {0.05, 0.075} |
Endogenous variables to track
Given the initial conditions and the set of parameter values, we perform 64 independent replications using a fresh set of random numbers for each run; specifically, the type and the network of each agent are re-randomized each time.[13] In each replication, the acceptance/disclosure status of all agents is tracked as they respond to the changing state of their social networks. This is done for the first 300 periods as that time horizon proved more than sufficient for the social system to reach a steady state where the mean values of the endogenous variables remain constant over time.[14]
The two primary endogenous variables whose movements we follow for each replication \(k\in \{1,\dots, 64\}\) are the rate of acceptance by the normals, \(\{ RA_k^t \}_{t=0}^{300}\), and the rate of disclosure of the stigmatized, \(\{ RD_k^t \}_{t=0}^{300}\):
| $$RA_k^t=\frac{\text{number of all normal agents with }\alpha_i^t=A}{\text{number of all normal agents}}$$ | (6) |
| $$RD_k^t=\frac{\text{number of all stigmatized agents with }\beta_i^t=R}{\text{number of all stigmatized agents}}$$ | (7) |
For much of the analysis, we report their average values over the 64 replications:
| $$\overline{RA}^t=\frac{1}{64}\sum_{k=1}^{64}RA_k^t$$ | (8) |
| $$\overline{RD}^t=\frac{1}{64}\sum_{k=1}^{64}RD_k^t$$ | (9) |
Both endogenous variables reach their steady-states well before the terminal period. As such, we report their values at t = 300 as the steady state.
The Triadic Social Dynamic
We start with the baseline set of parameters as specified in Table 1. Recall that 10% of the population (\(=1,000\)) are endowed with the stigmatizing trait. The initial seed population is specified at \((p^r,p^a) = (0.15, 0)\) so, at the outset of the process, 150 stigmatized agents have revealed themselves (and are accepting), 850 stigmatized agents are hidden (and are not accepting), and all 9,000 normal agents are not accepting.
The thresholds for the three types of agents are set at:
| $$\tau^S=0.4\text{;}\quad\tau^{CNF}=0.3\text{;}\quad\tau^{CMP}=0.05\text{.}$$ | (10) |
When an agent's network has 20 links, a stigmatized agent discloses the attribute when at least 8 (\(=20\ast 0.4\)) agents in his network have expressed themselves to be accepting of the stigma. A conformist is accepting of the stigma if 6 (\(=20\ast 0.3\)) or more agents in his network are accepting of the stigma. Finally, a compassionist is accepting when one or more agents in her network have revealed themselves to have the stigmatizing trait.[15]
The thresholds have been chosen according to two criteria. First, we want thresholds which make the obtaining of social acceptance sensitive to the model's parameters so that insight can be acquired into the factors that promote or discourage acceptance of those who are distinctive. Having explored a range of thresholds, these particular values meet that criterion. Second, we want thresholds that are sensible. Our starting point is that people intrinsically care about those in their social networks, but pressure to conform can create a tension. A conformist is someone who is highly sensitive to those pressures. If he did not care at all about the person then one might imagine a conformist doing whatever the majority of those in his network are doing. But we suppose he does care about the stigmatized in his network and so we set the threshold for acceptance below 0.5. \(\tau^{CNF}=0.3\) seems a reasonable value to capture that trade-off. In contrast, a compassionist is viewed as being highly independent and is largely driven by caring for others. With around 20 links in one's network, \(\tau^{CMP}=0.05\) means that a compassionist just needs to know someone (or two) stigmatized people for them to support tolerance. It is difficult to determine a compelling value for a stigmatized person to reveal but requiring 40% of one's network to be accepting seems plausible. In any case, simulations have been conducted with other thresholds and, while the output does change, the qualitative insight is largely unaffected.[16]
The mix of the conformists and compassionists is specified at \(w=0.3\) for the baseline analysis presented in this section. Hence, there are 2,700 conformists and 6,300 compassionists in the population of normal agents. Finally, the social networks for the individuals are highly insular in that \(q=0\), so all network connections are from an agent's neighborhood.
The two endogenous variables, \(RA_k^t\) and \(RD_k^t\), capture the aggregate behavior of the population at time \(t\) in replication \(k\). The mean behavior of the population can then be summarized by the time series of the simulation outputs when they are averaged over the 64 replications. Figure 3 captures the time paths of the rates of acceptance and disclosure for: 1) a single randomly chosen replication (left plots); and 2) the average of the 64 replications (right plots). Figure 3a shows the rate of acceptance among all normal agents, \(\overline{RA}^t\), over the horizon of 300 periods. The rate starts out at zero but rises quickly to approach the steady-state rate of over 60% by \(t=70\). Figure 3b reports the rate of disclosure by the stigmatized agents, which starts out at the seed rate of 15%, but quickly rises to stabilize at the rate of almost 75% by t=70. For the two figures on the right showing the averages, the dashed curves above and below the solid curve (mean) capture the upper and lower limits of the 95% confidence interval around the mean.
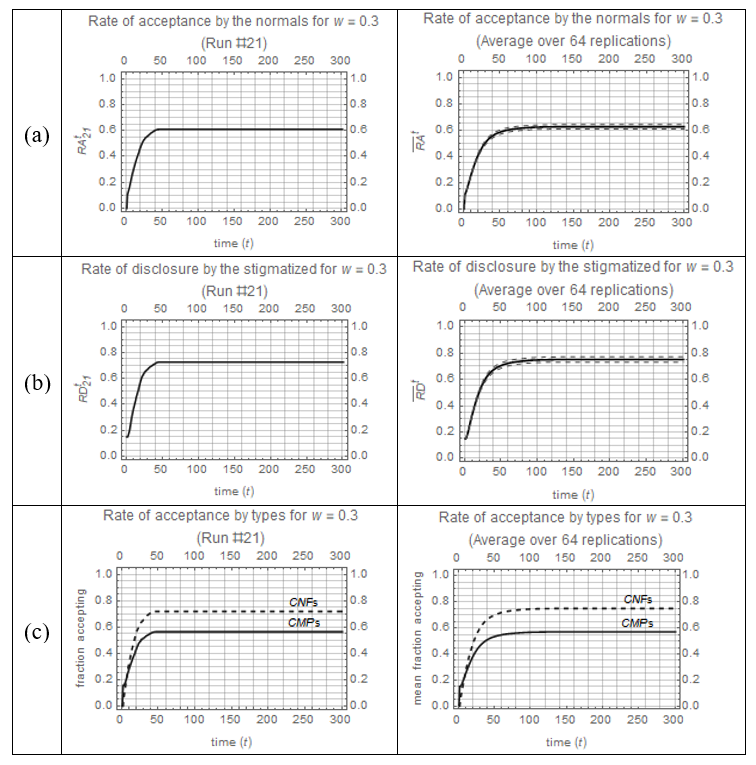
To better understand the population dynamics, we decompose the rate of acceptance into acceptance by the conformists and by the compassionists. In Figure 3c, the dashed curve is the fraction of the conformists who accept (= number of conformists who accept/number of all conformists), and the solid curve is the fraction of the compassionists who accept (= number of compassionists who accept/number of all compassionists). With both fractions starting at zero, one can see that compassionists are initially accepting at a higher rate than conformists. However, the rate of increase in acceptance is soon higher for conformists and, eventually, conformists are more accepting than compassionists. In the steady state, the conformists achieve an acceptance rate of about 70%, while the compassionists achieve an acceptance rate of about 55%.
The triadic dynamic between the three types can be seen by tracing the number of agents of each type who accept/reveal over time, especially during the transient stage prior to reaching the steady state. For a randomly chosen replication (run #21), Table 2 reports: 1) the number of stigmatized agents who have revealed; 2) the number of compassionists who are accepting; and 3) the number of conformists who are accepting. The associated proportion of each agent type who have revealed or accepted (i.e., the numbers are divided by the total number of agents of each type) are provided inside the parentheses.
| time (t) | disclosure by S 1,000 agents | acceptance by CMP 6,300 agents | acceptance by CNF 2,700 agents |
| 0 | 150 (0.15) | 0 (0) | 0 (0) |
| 1 | 150 (0.15) | 978 (0.16) | 0 (0) |
| 2 | 165 (0.17) | 978 (0.16) | 169 (0.06) |
| 3 | 185 (0.19) | 1,042 (0.17) | 273 (0.10) |
| 4 | 209 (0.21) | 1,118 (0.18) | 375 (0.14) |
| 5 | 241 (0.24) | 1,229 (0.20) | 491 (0.18) |
| 6 | 277 (0.28) | 1,366 (0.22) | 585 (0.22) |
| 7 | 309 (0.31) | 1,512 (0.24) | 673 (0.25) |
| 8 | 337 (0.34) | 1,623 (0.26) | 790 (0.29) |
| 9 | 365 (0.37) | 1,746 (0.28) | 859 (0.32) |
| 10 | 385 (0.39) | 1,863 (0.30) | 931 (0.34) |
| 11 | 408 (0.41) | 1,963 (0.31) | 1,016 (0.38) |
| 12 | 429 (0.43) | 2,062 (0.33) | 1,092 (0.40) |
| 13 | 457 (0.46) | 2,151 (0.34) | 1,157 (0.43) |
| 14 | 473 (0.47) | 2,273 (0.36) | 1,213 (0.45) |
| 15 | 495 (0.50) | 2,336 (0.37) | 1,275 (0.47) |
| - | - | - | - |
| - | - | - | - |
| - | - | - | - |
| 43 | 724 (0.72) | 3,525 (0.56) | 1,933 (0.72) |
| 44 | 725 (0.73) | 3,538 (0.56) | 1,937 (0.72) |
| 45 | 726 (0.73) | 3,540 (0.56) | 1,937 (0.72) |
| 46 | 726 (0.73) | 3,545 (0.56) | 1,937 (0.72) |
| - | - | - | - |
| - | - | - | - |
| - | - | - | - |
| 300 | 726 (0.73) | 3,545 (0.56) | 1,937 (0.72) |
At \(t=0\), the dynamic is initiated by the 150 stigmatized agents who start out in the revealed state. While none of the normals are initially accepting of the stigma, those compassionists who are connected to at least one (or two) of the revealed stigmatized agents are accepting as of \(t=1\) since their acceptance decisions are based on observing disclosures by the stigmatized in their networks. For this particular run, 978 compassionists switched to accepting in \(t=1\) because of the 150 revealed stigmatized agents. None of the conformists are accepting in \(t=1\). Their acceptance decisions are based on the observed acceptances in their networks and the only acceptances are from the 150 stigmatized agents in \(t=0\), which evidently is not enough to cause any of the conformists to switch from opposition to acceptance. That changes come \(t=2\), for 169 conformists are now accepting. This conversion is due to those 978 compassionists who switched to acceptance in \(t=1\), which resulted in 169 conformists finding enough agents in their networks accepting so that they now are accepting. The acceptances by the 978 compassionists also induced fifteen more stigmatized agents to reveal in \(t=2\). These additional disclosures induce 64 more compassionists to accept in \(t=3\), which raises the number of accepting compassionists from 978 to 1,042. More significant is the increase in the number of conformists who are now accepting, which has risen from 169 to 273. This is partly due to the additional 15 stigmatized and compassionists who are accepting but is primarily due to the 169 conformists who became accepting in \(t=2\). Recall that their acceptance decisions are based solely on acceptances by others in their networks. These conformity-based acceptances then, come \(t=4\), induce more stigmatized agents to reveal, which then causes more compassionists to accept, and significantly more conformists to accept. At that point, the triadic reinforcement process takes off. By \(t=45\), there are 726 stigmatized agents who have revealed their attribute and 1,937 conformists who are accepting, which are their respective steady-state values. Given the steady-state number of disclosures by the stigmatized population, the compassionists achieve their steady-state in \(t=46\). Note that the steady state has 3,545 compassionists who are accepting, which means there are still 2,755 compassionists who are not accepting. These compassionists are not accepting because there are not enough revealed stigmatized agents in their networks. That could be due to there being no stigmatized agents or those that are in their networks remain hidden.
As each agent in our model is assigned a specific location on the torus with a neighborhood-based social network, the triadic dynamic driving the diffusion process has a spatial component. In Figure 4, we offer a series of snapshots taken from a single replication at various points in time over the horizon. At each time period \(t\in \{1,2,6,12,24,48\}\), the surface of the torus over which the agents are distributed is visualized as a 100×100 grid.[17] The black dots in the plots in the left column are the positions of the conformists who are accepting, the plots in the middle column are the positions of the compassionists who are accepting, and the plots in the right column are for the agents with the stigmatizing trait where dots are black if they have revealed themselves and gray if they are hidden.
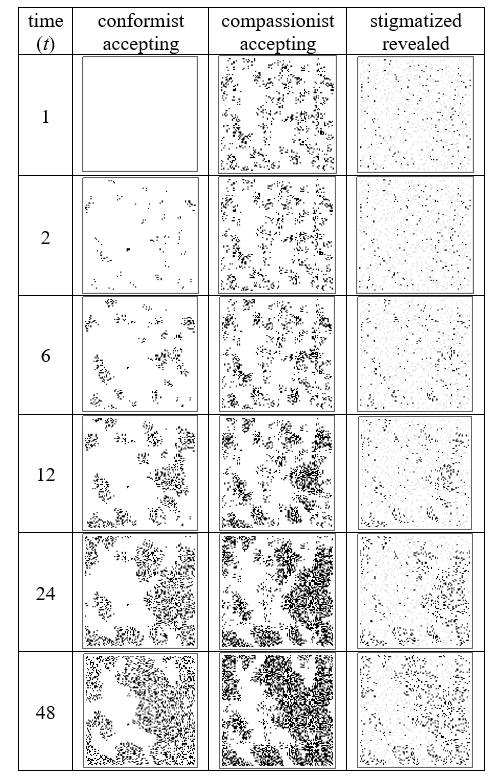
The triadic dynamic can now be made more concrete by visualizing the evolving attitudes toward stigma at the individual agent level. Starting from the top row (\(t=1\)), there are 150 agents whose stigmatizing traits are initially revealed; these are the seed agents who are shown as the black dots in the right plot in the first row. Note that none of the conformists are accepting of the stigma at this point. The seed agents who are initially revealed initiate the social dynamic by inducing some compassionists (though no conformists) to react to their disclosure. In \(t=1\), those compassionists who are connected to one or more revealed agents (or two or more when there are more than 20 links) switch to accepting as indicated by the black dots in the middle plot in the first row. Moving on to \(t=2\), the acceptances by the compassionists now induce some of the connected conformists to accept, while simultaneously motivating some of the stigmatized agents to reveal themselves. These additional disclosures further invite acceptances by both conformists and compassionists, which in turn induce disclosure by more stigmatized agents, and the triadic feedback mechanism continues from there. The rest of Figure 4 shows the mutually reinforcing nature of the interactions among the three types as time goes on. For this particular run, we observe gradual diffusion of disclosure by the stigmatized agents and acceptance by the normal agents. By \(t=48\) the population has already reached its steady state.
The Effect of the Mix of Compassion and Conformity on Social Acceptance
In deciding how to treat those with distinctive attributes, a person can turn externally to others for guidance or internally to what she thinks is proper. Societies may differ in terms of the strength of orthodoxy and how much emphasis its members give to conforming, even when it may mean harming those who ones care about. In our model, this social heterogeneity is captured by the parameter \(w\) which is the proportion of normal agents who accept the stigmatized when such acceptance is sufficiently common within their networks, and 1-w is the proportion of normal agents who accept the stigmatized when there are at least a few in their networks. In this section, we investigate how the mix of compassion and conformity in the population affects whether the society ends up tolerant of those who are distinct or instead ostracizes them.
The initial exercise involved performing 64 replications for each \(w\in \{0,0.1,0.2,\dots,1\}\), holding all other parameters at the baseline values including the network structure (at \(q=0\)).Figure 5a shows the mean rates averaged over the 64 replications. Figure 5b reports the distribution of the rates from all 64 replications using a box-and-whisker chart, where the box represents the range of rates that are between 25% and 75% quantiles.[18] The numerical values for the quantiles are provided in Table 3.
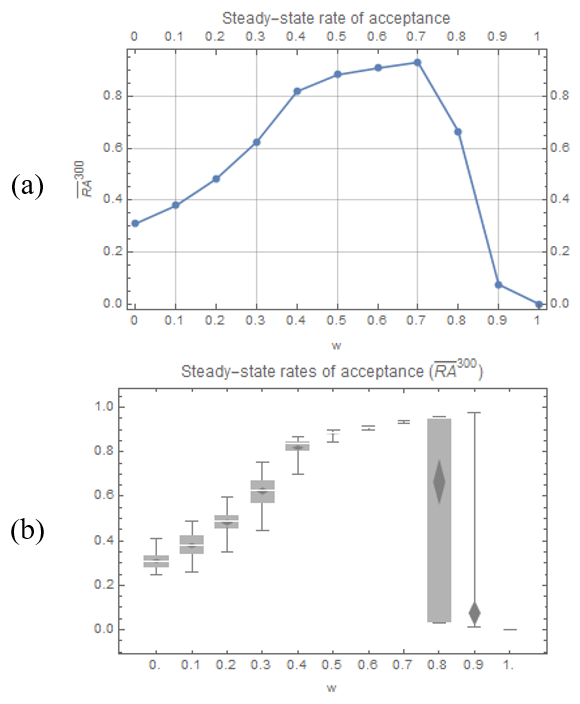
| w | max | 75% | median | 25% | min |
| 0 | 0.408 | 0.335 | 0.306 | 0.280 | 0.245 |
| 0.1 | 0.486 | 0.423 | 0.378 | 0.341 | 0.262 |
| 0.2 | 0.595 | 0.515 | 0.488 | 0.457 | 0.348 |
| 0.3 | 0.751 | 0.675 | 0.627 | 0.568 | 0.444 |
| 0.4 | 0.871 | 0.849 | 0.837 | 0.806 | 0.701 |
| 0.5 | 0.897 | 0.888 | 0.885 | 0.881 | 0.841 |
| 0.6 | 0.915 | 0.911 | 0.909 | 0.907 | 0.899 |
| 0.7 | 0.939 | 0.933 | 0.931 | 0.929 | 0.925 |
| 0.8 | 0.958 | 0.955 | 0.953 | 0.033 | 0.029 |
| 0.9 | 0.976 | 0.016 | 0.015 | 0.014 | 0.013 |
| 1 | 0 | 0 | 0 | 0 | 0 |
Given the baseline parameter configuration, Figure 5a shows that the mean rate of social acceptance of the stigmatized is maximized at w=0.7, which means there are 6,300 conformists and 2,700 compassionists. Though not reported here, the rate of disclosure closely follows the rate of acceptance so that it also attains its maximum at w=0.7.[19] That it is a mixture of conformists and compassionists which maximizes acceptance was found for a wide range of parameterizations.[20]
Property 1: The rate of social acceptance is generally maximized when the population consists of both compassionists and conformists.
Towards explaining Property 1, let us begin by considering the rate of acceptance at the two extreme values, \(w=0\) and \(w=1\). When \(w=1\), the population consists only of conformists. Recall from the previous section that, once there are enough agents who are accepting in the population, conformists convert to acceptance at a faster rate than compassionists. The problem when all normals are conformists is that, unless the initial population has many agents accepting, the absence of compassionists prevents the creation of a critical mass of acceptance to start inducing conformists to convert from opposition to acceptance. In contrast to conformists, who need many in their networks to accept before they will accept, compassionists will accept in response to only one or two stigmatized agents having revealed themselves. Hence, without compassionists, social acceptance fails to spread altogether because there is no initial acceptance by the compassionists that can subsequently induce acceptances by conformists. Replacing some of the conformists with compassionists (i.e., reducing \(w\) below 1) can raise the acceptance level early on, which can then induce conformists to accept and eventually lead to the population-wide diffusion of acceptance. For this reason, social acceptance is higher with a mix of compassionists and conformists than when all normal agents are conformists.
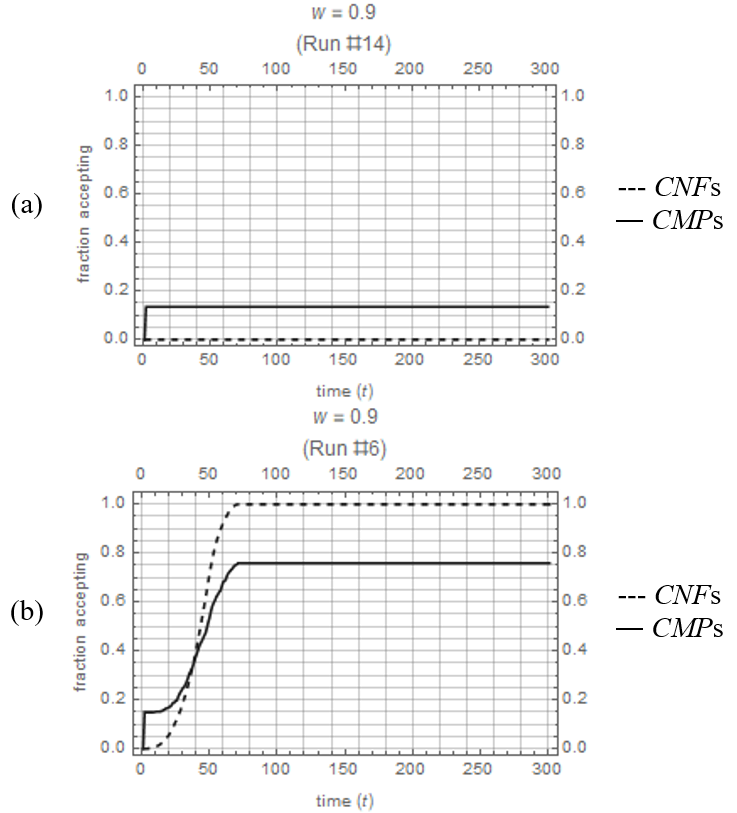
This intuition is verified by separately inspecting the acceptance behavior of the two types, which is reported in Figures 6 and 7. In Figure 6, the time paths of the acceptance rate for conformists and for compassionists are plotted for two replications for \(w=0.9\). For run #14 in Figure 6a, almost 15% of the compassionists immediately accept in response to the stigmatized agents who are revealed in \(t=0\), but their acceptance rate stays at that level for the remainder of the horizon. These initial acceptances were insufficient to create the critical mass required to induce conformists to start accepting. In contrast, Figure 6b reports a case where the early acceptance by compassionists is sufficient to induce some of the conformists to start accepting which then induces the stigmatized agents to reveal, and then there is a sequence of triadic reinforcements. Eventually, the rate of acceptance by the conformists surpasses that by the compassionists, reaching acceptance by all conformists at the steady state. Out of the 64 replications for \(w=0.9\), 60 replications failed to take off (as in Figure 6a) and only 4 replications achieved successful takeoff (as in Figure 6b).
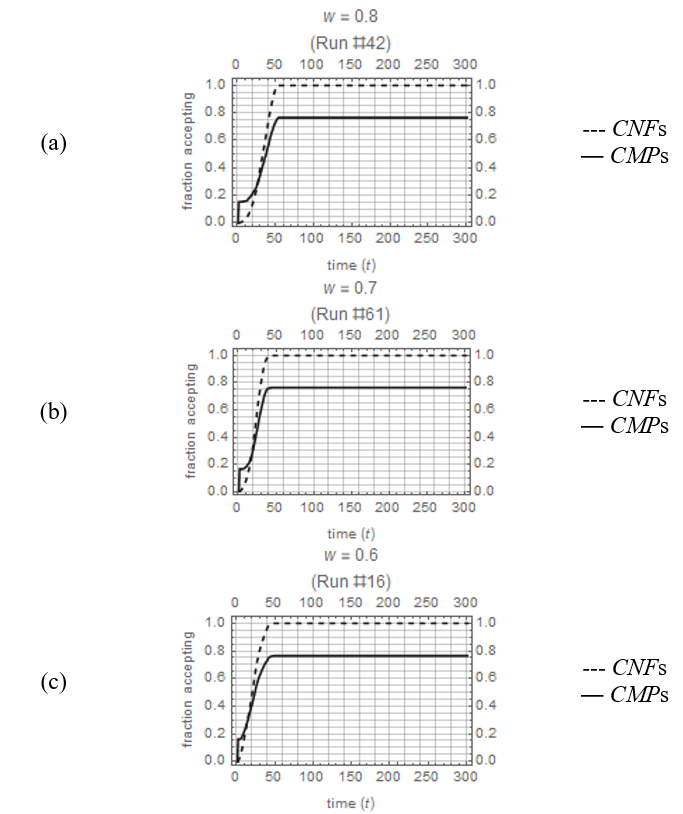
Figure 7 shows the time paths for the two types in replications with successful takeoff for: (a) \(w=0.8\); (b) \(w=0.7\); and (c) \(w=0.6\). It should be noted that successful takeoffs were observed in 45 out of 64 replications when \(w=0.8\), and in 64 out of 64 replications when \(w=0.7\) or \(w=0.6\). The property to highlight in Figures 6 and 7 is that the acceptance rate among compassionists exceeds that of conformists early on in the diffusion process, which substantiates the claim that acceptance by compassionists is a prerequisite for acceptances by conformists.
| x: proportion of type-S in the networks of CMPs | |||||||
| w | 0 ≤ x < 0.05 | 0.05 ≤ x < 0.1 | 0.1 ≤ x < 0.15 | 0.15 ≤ x < 0.2 | 0.2 ≤ x < 0.25 | 0.25 ≤ x < 0.3 | 0.3 ≤ x< 0.35 |
| 0 | 0 | 0.272 | 0.414 | 0.513 | 0.584 | 0.647 | 0.688 |
| 0.1 | 0 | 0.355 | 0.493 | 0.588 | 0.655 | 0.707 | 0.754 |
| 0.2 | 0 | 0.475 | 0.609 | 0.689 | 0.738 | 0.788 | 0.831 |
| 0.3 | 0 | 0.657 | 0.755 | 0.810 | 0.843 | 0.871 | 0.891 |
| 0.4 | 0 | 0.918 | 0.952 | 0.965 | 0.973 | 0.981 | 0.987 |
| 0.5 | 0 | 0.995 | 0.997 | 0.998 | 0.999 | 0.999 | 0.999 |
| 0.6 | 0 | 1 | 1 | 1 | 1 | 1 | 1 |
| 0.7 | 0 | 1 | 1 | 1 | 1 | 1 | 1 |
| 0.8 | 0 | 0.717 | 0.748 | 0.775 | 0.802 | 0.819 | 0.828 |
| 0.9 | 0 | 0.153 | 0.245 | 0.324 | 0.396 | 0.483 | - |
| 1 | - | - | - | - | - | - | - |
| x: proportion of type-S in the networks of CNFs | |||||||
| w | 0 ≤ x < 0.05 | 0.05 ≤ x < 0.1 | 0.1 ≤ x < 0.15 | 0.15 ≤ x < 0.2 | 0.2 ≤ x < 0.25 | 0.25 ≤ x < 0.3 | 0.3 ≤ x< 0.35 |
| 0 | - | - | - | - | - | - | - |
| 0.1 | 0.365 | 0.434 | 0.489 | 0.536 | 0.571 | 0.601 | 0.611 |
| 0.2 | 0.511 | 0.568 | 0.617 | 0.648 | 0.671 | 0.692 | 0.735 |
| 0.3 | 0.701 | 0.734 | 0.765 | 0.790 | 0.812 | 0.825 | 0.846 |
| 0.4 | 0.938 | 0.950 | 0.959 | 0.967 | 0.970 | 0.978 | 0.975 |
| 0.5 | 0.997 | 0.998 | 0.998 | 0.998 | 0.999 | 0.999 | 0.999 |
| 0.6 | 1 | 1 | 1 | 1 | 1 | 1 | 1 |
| 0.7 | 1 | 1 | 1 | 1 | 1 | 1 | 1 |
| 0.8 | 0.688 | 0.688 | 0.688 | 0.688 | 0.689 | 0.689 | 0.690 |
| 0.9 | 0.063 | 0.063 | 0.063 | 0.063 | 0.063 | 0.063 | 0.065 |
| 1 | 0 | 0 | 0 | 0 | 0 | 0 | 0 |
While it has been shown and explained why acceptance is higher when there are at least some compassionists, more intriguing is why social acceptance is not maximized when all normal agents are compassionists. Note from Table 3 that for \(w = 0\) the median of the steady-state rates of acceptance is only 0.306 (with the maximum value attained at 0.408); hence, only about 31% of the normals are accepting of the stigma, even though all of them are compassionists. This lack of acceptance is partly due to the small number of stigmatized individuals (only 10% of the population), which means that some compassionists will have no agents with the stigma in their social networks which, by itself, will prevent them from accepting. However, that rather mechanical reason for the lack of acceptance does not fully explain why many compassionists are not accepting. In Tables 4 and 5, we report the rate of acceptance for compassionists (Table 4) and conformists (Table 5) depending on the proportion of stigmatized agents (whether revealed or hidden) in their social networks. For example, when \(w\) = 0, 27.2% of the compassionists had networks comprised of 5 to 10% of stigmatized agents. Note that the acceptance criterion for the compassionists is to accept if the proportion of revealed stigmatized types is at least 5%. The takeaway from Tables 4 and 5 is that many compassionists have ample stigmatized agents in their social networks but are still not accepting. For example, even when their social networks have 30-35% of their links with stigmatized agents, only 68.8% of compassionists are accepting. That some compassionists with multiple stigmatized agents in their social networks are not accepting means that those stigmatized agents are remaining hidden. The reason that the acceptance rate for compassionists is not as high as it could be is then a “coordination failure”: Some compassionists are not accepting because the stigmatized agents in their social networks are remaining hidden, and those stigmatized agents are remaining hidden because there are not enough agents in their social networks who are accepting.
By replacing some of those compassionists with conformists, some of these coordination failures can be corrected. Consider raising \(w\) from 0 to 0.1; thereby replacing 900 compassionists with an equal number of conformists. Some of those conformists will accept even when there are no stigmatized agents revealed, as long as enough agents are accepting. Those additional acceptances can induce the stigmatized agents to reveal and that can cause some compassionists to accept; in that way, conformists are disrupting the coordination failure between the stigmatized and the compassionate. To see that conformists can accept where compassionists would not, consider the acceptance rate for those normal agents with social networks for which 5-10% of the links are with stigmatized agents (Tabels 4 and 5). When there are no conformists (\(w=0\)), compassionists accept at the rate of 27.2%. When 10% of normal agents are conformists (\(w = 0.1\)), conformists are accepting at a higher rate of 43.4%. More relevant, compassionists are now accepting at a higher rate; compare 35.5% with 27.2% when there are no conformists. While it is not universally the case that the optimal mix entails at least some conformists, it is very commonly true.
In sum, both those who conform - which may mean promoting tolerance or intolerance - and those who intrinsically care about people irrespective of social norms have a role to play in promoting tolerance. Without those who intrinsically care, it is difficult to break away from a norm of not accepting those who are distinct. How far acceptance (and also disclosure by the stigmatized) goes is limited however when society lacks conformists. Those who seek to conform help push acceptance further and, in particular, help break coordination failure in some networks with the stigmatized hiding their traits and compassionists not expressing support because there is no one in their networks who have revealed themselves to have the stigma.[21]
While some conformists are needed for maximal acceptance, it is noteworthy that the rate of social acceptance can drop precipitously in response to adding conformists. Examining Figure 5(a) and Table 3, note the sudden drop in the rate of acceptance when the fraction of conformists is increased from 70% to 80% to 90%. While \(w = 0.7\) leads to maximal acceptance, \(w = 0.9\) results in a rate of acceptance close to zero for 75% of the replications. In comparison, the acceptance rate only gradually declines as the fraction of conformists is lowered from 70% to 60% to 50%. The sensitivity of social acceptance to having too many conformists is a general (though not universal) property. It is then better for society to err on being overly compassionate than being overly conformist.
Property 2: While both types are generally needed to achieve a high level of social acceptance, there can be a critical value of \(w\) such that the rate of acceptance drops sharply when the fraction of conformists exceeds that critical value.
That the rate of social acceptance is highly sensitive to reducing the fraction of compassionists is due to the role they play. As previously explained, a critical mass of compassionists is crucial to induce conformists to start accepting. Short of that critical mass will prevent the triadic reinforcement dynamic from taking off. In contrast, the role of conformists is in spreading acceptance and breaking coordination failures between compassionists and stigmatized agents. That effect is more linear so we observe that the rate of social acceptance is smoothly declining as the fraction of conformists is reduced below the value that maximizes tolerance.
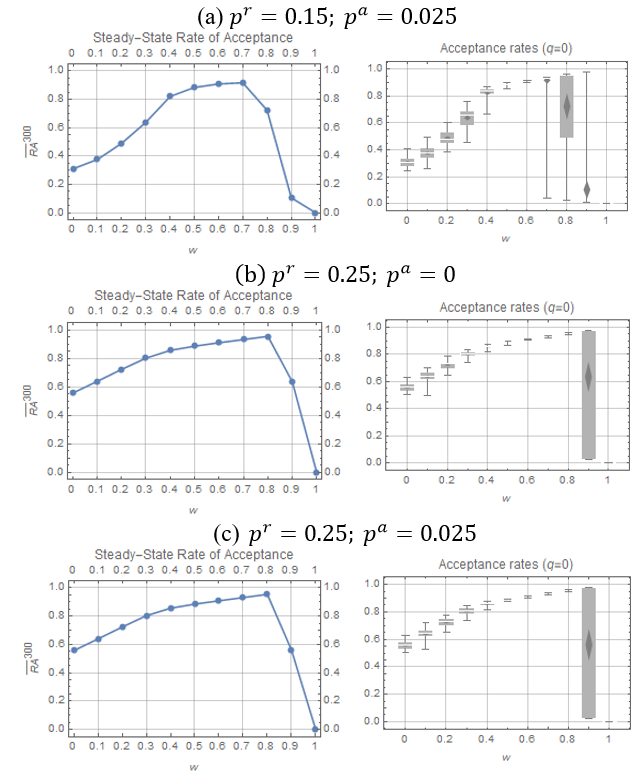
In concluding, Figure 8 shows that both Properties 1 and 2 are robust to changes in the initial conditions: (a) \((p^r, p^a)=(0.15,0.025)\); (b) \((p^r, p^a)=(0.25,0)\); and (c) \((p^r, p^a)=(0.25,0.025)\).
The Effect of the Network Structure on Social Acceptance
The next task is to investigate how social acceptance of the stigmatized is influenced by the structure of agents' social networks. To lay the groundwork, we begin by reviewing some previous findings on network effects and diffusion, and then relate our model to past models.
It is well-accepted that network structure is a key determinant of diffusion patterns. Granovetter (1973) identified the strength of weak links whereby agents may benefit from the paucity of mutual friends in their job search as otherwise distant nodes in the network can provide new information that improves the rate of diffusion: "[W]hatever is to be diffused can reach a larger number of people, and traverse greater social distance (i.e., path length), when passed through weak ties rather than strong." (Granovetter 1973, p. 1366) The "strength of weak ties" notion was given further support when Watts & Strogatz (1998) — WS1998 from here on — discovered the "small-world" networks in which the rate of diffusion of information significantly increased with a small number of long random ties. However, Centola & Macy (2007), hereafter CM2007, provided an important qualification to that finding. Previous work, including WS1998, considered settings in which an agent's exposure to one other agent exhibiting some conduct was sufficient for that conduct to then be adopted. Referred to as a "simple contagion," CM2007 re-examined the model of WS1998 with a "complex contagion," which means that adoption of some conduct requires exposure to two or more agents exhibiting that conduct. Of particular note, CM2007 found that the proportion of random (non-local) ties has a non-monotonic effect when the contagion is complex. While a few randomized ties can improve propagation, more than that can significantly harm diffusion. (This result is explained below.)
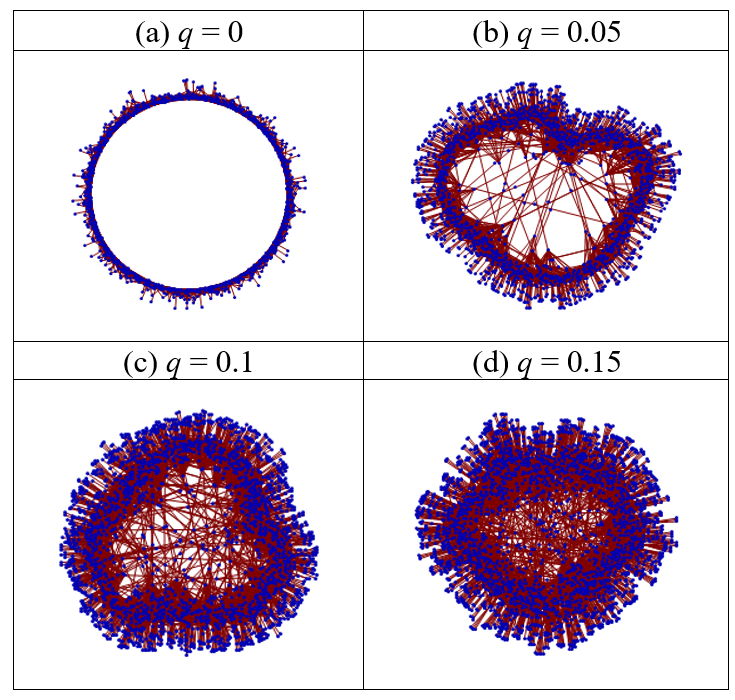
Our model belongs to this class of social diffusion models. The structural parameter for the social networks, \(q\), is equivalent to the proportion of random ties in WS1998 and CM2007. When \(q=0\), all the connections in an individual's network come from her own neighborhood \(N(i)\) (though within the neighborhood they are randomly chosen). More generally, a proportion \(q\) of an agent's network connections is drawn (randomly) from the population-at-large outside of the agent's immediate neighborhood. This is equivalent to the method of "random re-wiring of links" as implemented in WS1998 and CM2007. Figure 9 offers a visualization of the global social network in our model for randomly constructed networks for \(q\in \{0,0.05,0.1,0.15\}\), where nodes are placed on the basis of their network position. When \(q=0\), the network is a long circular chain connecting the individual members of the population through their strictly local networks. As \(q\) rises, some of the links to one's own neighbors are replaced with random links to those external to the neighborhood. As a result, the tight circular property of the chained network gradually weakens and we observe an increasing number of direct links between agents positioned far apart from one another.
In line with WS1998, there are two distinct channels through which the randomness parameter \(q\) influences diffusion via social networks in our model. First, the extent of random ties in the social networks affects the average length of the shortest paths between any two agents in the population. Let \(d_{ij}\) denote the length of the shortest path between agent \(i\) and another agent \(j\), where the "length of a path" is defined as the number of edges that the path contains. [22] By taking an average of the path lengths between all pairs of agents \(i\), \(j\in M\), \(i\neq j\), we compute the mean path length, \(PL(q)\):
| $$PL(q) = \frac{1}{m}\sum_{i\in M} \Biggl( \frac{1}{m-1}\sum_{j\in M-\{i\}}d_{ij} \Biggr)\text{.}$$ | (11) |
Second, the random ties affect the local clustering coefficient, which is a measure of the extent to which one's friends are also friends of each other. More specifically, for a given agent i, the local clustering coefficient is:
| $$LCC_i(q) = \frac{\text{number of pairs of } i\text{'s friends, (} j,k)\text{, such that}\quad j\in L(k)\, \text{and}\, k\in L(j)}{\text{number of pairs of } i\text{'s friends}} $$ | (12) |
Averaging over the population, we obtain the mean local clustering coefficient:
| $$LCC(q)=\frac{1}{m}\sum_{i\in M}LCC_i(q)$$ | (13) |
Based on the networks generated from the 64 replications, \(PL(q)\) and \(LCC(q)\) were computed for all \(q\in \{ 0,0.05,0.1,0.15,0.2,0.3,\dots,1 \}\). Consistent with the results reported in WS1998, \(PL(q)\) and \(LCC(q)\) are monotonically decreasing in \(q\). In Figure 10, \(PL(q)/PL(0)\) and \(LCC(q)/LCC(0)\) are plotted with respect to \(q\), where, for purposes of comparison, the measures are normalized by their values at \(q=0\). The intuition behind the declining shape of the two curves is as follows. First, when \(q=0\), an individual's network consists of connections drawn strictly from within her local neighborhood. While any two agents in the population can typically be connected through a chain of local networks, the path length tends to be high on average. As \(q\) is raised, the social networks become more cross-cutting due to the random links; agents positioned spatially far apart from each another can be connected without going through a long chain of intermediate agents. Hence, mean path length is reduced. Second, the rise in distant links from an increase in \(q\) makes it less likely that an agent's direct links are also directly connected; that is, it becomes less likely that members of an agent's network are also members of each other's networks. With strictly local networks (\(q=0\)), an agent is likely to share many links with her neighbors as their neighborhoods will extensively overlap; in other words, their friends are likely to know each other. As the network becomes increasingly random and global, the mutual ties become weaker and this is reflected in \(LCC(q)\) declining in \(q\).
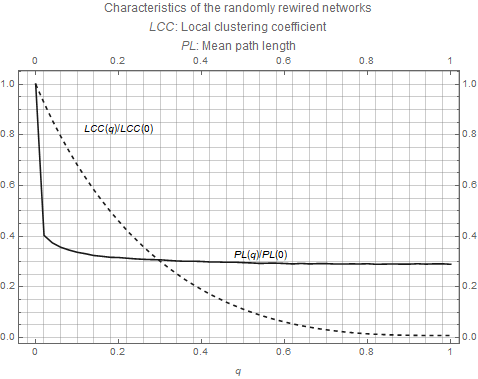
Watts and Strogatz (1998) used the rapidly declining average path length as an explanation for their ''small-world'' network result: It only takes a few randomly connected (weak) links to substantially reduce the path length, and that speeds up the diffusion process. Note that \(PL(q)/PL(0)\) drops sharply with respect to \(q\) in Figure 10. However, CM2007 showed that this result only holds for simple contagions. When the contagion is complex, an agent needs to have multiple exposures to the conduct before it is adopted. If there is a high degree of local clustering, it becomes more likely that when an agent's link has the conduct then so does another link for that agent because those two links are likely to be connected and thereby influence each other. An increase in \(q\) then has two countervailing effects on the diffusion process when the contagion is complex: 1) it reduces the mean path length, which speeds up the diffusion ("small-world" effect) required for adoption; and 2) it reduces the local clustering coefficient, which weakens the extent of exposure necessary to exceed the threshold for adoption ("shared-friends" effect).
Figure 10 shows that the two countervailing forces have a differential impact on the diffusion process as \(q\) is raised. Note that the path length declines steeply in the beginning and then very slowly after that. In contrast, the local clustering coefficient declines much more gradually. The result of CM2007 on complex contagions may be understood as the result of the small-world effect dominating when \(q\) is low, and the shared-friends effect dominating when \(q\) is sufficiently high.[23] When \(q\) is low, the steep drop in \(PL(q)\) (which promotes diffusion) dominates the mild decline in \(LCC(q)\) (which hinders diffusion); the marginal gain from the strengthened small-world effect exceeds the marginal loss from the weakened shared-friends effect. However, the steep drop in \(PL(q)\) is restricted to low values of \(q\). When \(q\) rises further, the additional decline in \(PL(q)\) is very small, almost becoming negligible for high values of \(q\). In that case, the shared-friends effect is increasingly dominant.
Our model enriches the preceding models by allowing for heterogeneous contagions. CM2007 assumed all agents have the same threshold, while the agents in our model have different thresholds depending on their types. The compassionists make their acceptance decisions purely on the observation of stigmatized agents in their networks. For the average network size of 20, exposure to a single revealed stigmatized agent is sufficient for a compassionist to accept; hence, the contagion for compassionists is simple. Conformists, on the other hand, base their acceptance on observing multiple acceptances by others in their networks. For an average network of 20 links, a conformist will adopt acceptance only when exposed to at least six agents who are accepting of the stigmatized; hence, the contagion is complex. As w is increased, the fraction of conformists rises which means diffusion is more dependent on the complex contagion.[24] Also note that the contagion for stigmatized agents is complex as they require at least eight agents (for a network with 20 links) to have adopted acceptance before they reveal.
To see the impact of \(q\) on the rate of acceptance of the stigmatized, Table 6 and Figure 11 report the mean rate of acceptance for a range of values for \(q\) and \(w\), given the initial conditions of \((p^r,p^a)=(0.25,0.025)\). All other parameters are at their baseline values. The next property can be inferred from these results.[25]
| w | |||||||||||
| q | 0 | 0.1 | 0.2 | 0.3 | 0.4 | 0.5 | 0.6 | 0.7 | 0.8 | 0.9 | 1 |
| 0 | 0.55652 | 0.63946 | 0.72370 | 0.80371 | 0.85660 | 0.88532 | 0.90850 | 0.93136 | 0.95434 | 0.56099 | 0 |
| 0.05 | 0.65004 | 0.73233 | 0.79887 | 0.83637 | 0.86231 | 0.88564 | 0.90900 | 0.93185 | 0.95481 | 0.26363 | 0 |
| 0.1 | 0.72811 | 0.78072 | 0.81328 | 0.83909 | 0.86365 | 0.88570 | 0.90786 | 0.93163 | 0.91239 | 0.17434 | 0 |
| 0.15 | 0.75956 | 0.78935 | 0.81549 | 0.83959 | 0.86236 | 0.88490 | 0.90830 | 0.93173 | 0.78507 | 0.07009 | 0 |
| 0.2 | 0.76588 | 0.79279 | 0.81610 | 0.83991 | 0.86346 | 0.88570 | 0.90859 | 0.93109 | 0.47603 | 0.02525 | 0 |
| 0.3 | 0.76916 | 0.79380 | 0.81713 | 0.84042 | 0.86274 | 0.88570 | 0.84668 | 0.29969 | 0.05198 | 0.02522 | 0 |
| 0.4 | 0.76989 | 0.79397 | 0.81697 | 0.83927 | 0.85289 | 0.63815 | 0.11568 | 0.08006 | 0.05128 | 0.02515 | 0 |
| 0.5 | 0.76273 | 0.79437 | 0.81680 | 0.84003 | 0.56909 | 0.14822 | 0.10854 | 0.07790 | 0.05109 | 0.02509 | 0 |
| 0.6 | 0.74844 | 0.79387 | 0.77090 | 0.71478 | 0.19507 | 0.14206 | 0.10724 | 0.07755 | 0.05045 | 0.02494 | 0 |
| 0.7 | 0.66365 | 0.76087 | 0.78133 | 0.57864 | 0.19197 | 0.13989 | 0.10511 | 0.07730 | 0.05067 | 0.02497 | 0 |
| 0.8 | 0.67934 | 0.71929 | 0.76431 | 0.55145 | 0.18944 | 0.13990 | 0.10517 | 0.07715 | 0.05027 | 0.02498 | 0 |
| 0.9 | 0.68884 | 0.72859 | 0.71039 | 0.44858 | 0.17570 | 0.13838 | 0.10613 | 0.07704 | 0.05062 | 0.02491 | 0 |
| 1 | 0.67126 | 0.73641 | 0.75468 | 0.42420 | 0.17524 | 0.13957 | 0.10619 | 0.07664 | 0.05050 | 0.02482 | 0 |
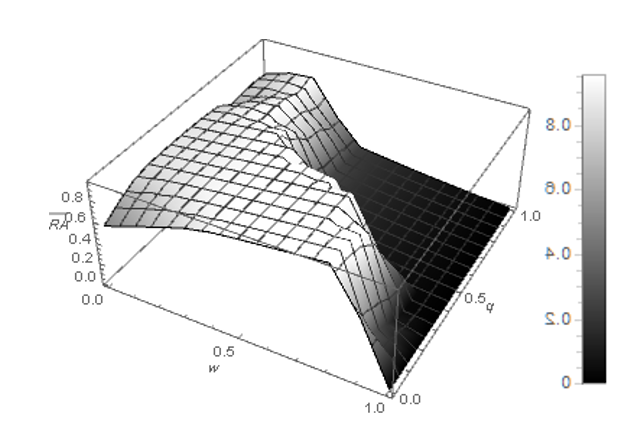
Property 3: Suppose the initial fraction of random ties, q, is low. Given enough number of compassionists in the population (i.e., w is low), a rise in the fraction of random ties in social networks tends to increase the rate of social acceptance. Alternatively, when there are few compassionists (i.e., w is high), a rise in the fraction of random ties lowers the rate of social acceptance.
As an example to illustrate the property, compare w=0 (all compassionists) and w=0.9 (almost all conformists) as q is raised from 0 to 0.1 so that some weak ties are introduced into networks. The rate of acceptance rises from 0.557 to 0.728 for w=0, but falls from 0.561 to 0.174 for w=0.9. When there are mostly conformists, the diffusion in our model is largely driven by a complex contagion, for which the shared-friends effect is dominant. In that case, moving to a network structure with weak ties reduces the extent of multiple exposure to acceptance and thereby leads to less acceptance by conformists. When w is instead low, the diffusion mechanism is dominated by the simple contagion of compassionists. Now, the small-world effect is crucial and, as a result, some weak ties (q is positive but low) promotes more exposure to revealed stigmatized agents throughout the population and thus encourages acceptance among compassionists.
It is also worth highlighting Property 2 in Figure 11. Note the steep drop in acceptance in response to a small increase in the fraction of conformists.
Summing up, the insularity of social networks tends to promote tolerance in a society that is dominated by orthodoxy. It is more likely that the insularity will generate pockets of conformists who switch to acceptance because there are many common connections among them who are accepting. (Though it is important to remember from Section 5 that having some people motivated by compassion, rather than orthodoxy, is crucial for initiating that process.) If instead society is full of people who are more driven by caring for those in their networks then tolerance is more widespread when there is less insularity of networks.
Conclusion
The first contribution of this paper is providing a model that formalizes the conceptual framework of Goffman (1963) within a larger social structure in which different actors interact through their social networks. This approach allows one to explore the micro-to-macro link that has been lacking in the stigma literature and do so in an explicit and systematic way. The second contribution is using this model to develop new insight into the determinants of a norm of tolerance with regards to those who possess an attribute that may be a source of stigma.
The model offered two innovations to previous models of diffusion, both of which are motivated by the object of diffusion being acceptance of a person as opposed to believing an idea or adopting a practice. As the object is a person, we allowed the adoption decision of some agents (compassionists) to be driven by sympathy for the stigmatized; they are accepting of them when their social networks include them. However, that acceptance requires knowing that the stigmatized are in their social networks. That leads us to the second innovation which is to allow those with the attribute to decide whether to reveal it or keep it hidden. Adding in the conforming type of agent typically present in diffusion models - who are accepting of the stigmatized when enough others in their social networks are accepting - the model embodies a triadic dynamic among the stigmatized agents, the compassionists, and the conformists.
Exploring this framework, the paper offers two new findings regarding when a norm of tolerance prevails. One finding is that the maximal rate of acceptance is achieved when the population includes both those driven by sympathy for the stigmatized and those driven by the desire to conform. Some compassionists are needed to achieve a critical mass of acceptance that can then induce conformists to begin to accept. At the same time, some conformists are needed to break the coordination failure that can occur between compassionists - who are not accepting because the stigmatized agents in their social networks are hidden - and stigmatized agents - who are remaining hidden because compassionists (as well as conformists) are not accepting.
A second finding is that the relationship between the insularity of social networks and a norm for tolerance depends on the disposition of agents in society. If compassion for the stigmatized is dominant then less insular networks contributes to the promotion of a norm of acceptance. That result is driven by the "small-worlds" effect of Watts & Strogatz (1998). However, if conformity is dominant then more insularity is desirable. That result comes from the complexity of the contagion for conformists, as defined in Centola & Macy (2007), and the importance of the "shared-friends" effect in diffusion.
The framework presented and explored here was rather sparse in its structure. That was intentional in order to identify some basic insight into the triadic dynamic. It is to be emphasized that the framework is highly flexible and can encompass richer social networks and more diverse agent types. Consider, for example, the stigma of homosexuality. As is well documented, religion is strongly correlated with attitudes to gays, including on issues such as same-sex marriage. One could then build social networks by first locating churches and places of employment on the torus. With those in place, the social networks would be constructed by attaching people to churches and employers and making links more likely with those who attend the same church and work for the same employer. There could be differential rates of church attendance in the space so as to capture, for example, regional differences in the United States. While we had some agents driven solely by sympathy and others by conformity, richer forms of heterogeneity could be encompassed. An agent could adopt acceptance when a weighted average of the fraction of revealed stigmatized agents and the fraction of accepting agents in her social network exceeds some threshold. With such a rich structure, one could make predictive statements about the change in acceptance of gays over time and space. What can we say about the geographic spread of tolerance? How will it be correlated with agents' traits? What would happen in a world without churches? What types of events will tend to disrupt a norm of intolerance? Can we explain the recent rapid acceptance of same-sex marriage in the United States? The framework is flexible enough to take on many relevant questions related to the social dynamics of stigma.
Notes
- For more evidence on the growing acceptance of gays, see Smith et al. (2014).
- Survey data was downloaded from http://www.pewforum.org/2016/05/12/changing-attitudes-on-gay-marriage/ on May 28, 2017.
- Goffman (1963), in considering individuals whose stigmatizing attributes are not immediately evident, specifies two levels of stigma — discreditable and discredited. In the first, the individual’s stigma has not yet been revealed, but may be revealed intentionally by him (and, hence, he is in control of his status). The main issue for the stigmatized individual is managing his concealed identity. In the second case, the individual’s stigma has already been revealed, in which case it directly affects the behavior of those around him.
- The compassionist-conformist dichotomy is well grounded in the classic work of the sociologist, Gordon W. Allport, The Nature of Prejudice, 1954. It should be noted, however, that in Allport (1954) the interactions between the two tendencies are described more as “internal” conflicts of an individual rather than “external” conflicts between the individuals with the distinct traits as modelled here — e.g., see Chapters 17 and 20 of Allport (1954).
- Without the spatial continuity offered by the torus, the agents located near the four edges of the grid would end up with neighborhoods that are truncated.
- On a two-dimensional grid, the Moore neighborhood of range \(n\) surrounding a given node, (\(x_0\), \(y_0\)), is defined by: \({(x, y):|x-x_0|\leq n,|y-y_0|\leq n}\). The number of nodes in the Moore neighborhood of range \(n\) is \((2n+1)^2\). When the center node, \((x_0, y_0)\), is excluded, it is \((2n+1)^2-1\).
- In the computational experiment, the initial conditions are implemented by randomly selecting \(p^r \cdot s\cdot m\) agents from the stigmatized population and \(p^a \cdot (1-s)\cdot m\) agents from the normal population to be the seed agents at \(t=0\).
- The intuition is that everyone in his network knows about his stigmatizing trait and this cannot be reversed, since the population remains fixed over time.
- The source code is in Appendix C.
- Note that the existence of links to those in other regions leads to networks that overlap with one another. The idea of such overlapping social networks and how their structure can impact the individuals has its origin in the work of the German sociologist and philosopher, Georg Simmel; most notably his essay The Web of Group Affiliations, (1955).
- It would be a regular lattice if each individual is connected to everyone in his neighborhood. Our network, even with \(q=0\), is not strictly a regular lattice network, as an individual has fewer links then the number of agents in her neighborhood, with those links randomly selected.
- The size distributions in certain social networks (e.g., the Internet) are observed to be right-skewed so that there exists a small number of individuals with exceptionally large connections, while most of the population tends to have a rather moderate to small sized networks. The stochastic block model we use generates a distribution which diverges from this type of distribution. Nevertheless, it does display a fairly wide variation in the network sizes of individuals.
- For each parameter configuration considered in this paper, we performed sixty-four independent replications in parallel using 64 cores at the Wharton HPCC (High Performance Computing Cluster). In this paper, we report only those 64 runs for the sake of computational efficiency and analytical consistency. However, a much larger number of runs were carried out for a representative subset of parameter configurations. All the results reported in this paper are found to be robust to increasing the number of runs.
- That 300 periods were sufficient is confirmed by running many replications for longer horizons.
- Recall that the mean number of links is 20. So, these thresholds in terms of the number of agents can be slightly higher or lower than as described. Of particular note, for those compassionists who have more than 20 links (but no more than 40 links, which is always the case), it will take at least two revealed stigmatized agents in their networks to induce them to accept.
- See Appendix B.
- The grid lines are removed from these figures to improve the visual representation of the agents' states as they evolve within this space. As noted earlier, a torus is formed by extending the left edge to the right edge and the top edge to the bottom edge.
- The horizontal line in the box represents the median, while the diamond represents the 95% confidence interval about the mean. The lines at the top and bottom are, respectively, the maximum and the minimum.
- In Appendix A, it is reported that there is a very high positive correlation between the rate of acceptance and the rate of disclosure.
- Appendix B presents the results on the mean rate of acceptance for all \(w\in \{0,\dots,1\}\) and \(q\in \{0,\dots,1\}\) for sixteen different parameterizations based on the following values for each of the five main parameters, (\(p^r\), \(p^a\), \(\tau^S\), \(\tau^{CNF}\), \(\tau^{CMP}\)): \(p^r\in \{0.15,0.25\}\); \(p^a\in \{o, 0.025,0.05,0.1\}\); \(\tau^S\in \{0.4,0.5\}\); \(\tau^{CNF}\in \{0.3,0.35,0.4\}\); \(\tau^{CMP}\in \{0.05,0.075\}\). Those additional runs support Property 1.
- Note that compassionists with a low threshold of acceptance are needed to initiate the cascade of acceptance, while conformists with a high threshold (but with the potential for strong positive feedback) are needed to sustain the cascade. This is reminiscent of and consistent with the theory of collective action as presented in Oliver & Marwell (1988): "The problem of collective action [...] is whether there is an organization or social network that has a subset of individuals who are interested and resourceful enough to provide the good when they act in concert [...]. What matters for successful mobilization is that there be enough people who are willing to participate and who are also reachable through social-influence networks. [...] the theory of collective action explains why most action comes from a relatively small number of participants who make such big contributions to the cause that they know (or think they know) they can 'make a difference.' (pp. 6-7) This insight was also anticipated in the earlier works by Olson (1965) and Hardin (1982) in the context of asymmetries in collective action.
- The path may entail going through several individuals. For instance, if \(i\) and \(j\) know each other (i.e., they are in each other's network), then \(d_{ij}=1\). If \(i\) and \(j\) do not know each other but they both know another agent \(k\), then \(d_{ij}=2\), so \(i\) knows \(k\) and \(k\) knows \(j\). Typically, there are many different paths that can be taken to connect \(i\) and \(j\). The "path length" is the shortest of all feasible paths.
- It should be noted that the analysis carried out in CM2007 (as well as WS1998) is restricted to those cases where the entire population reaches full adoption over the relevant horizon. Their interest is in measuring the "time to saturation" of the population. In contrast, we focus on the rate of acceptance (or adoption), allowing for the possibility that the steady-state may not involve saturation.
- When a compassionist has more than 20 links then she requires exposure to at least two revealed stigmatized agents. Though that is then a complex contagion, the more general point is that the contagion associated with conformists is more complex than that associated with compassionists.
- That the results are robust to initial conditions is shown in the Appendix for other values of \(p^r\) and \(p^a\). (See Appendix B.)
Acknowledgements
We thank the two referees for their comments. The first author would also like to thank Phil Manning for many stimulating lunch conversations on Goffman and sociological theorizing in general. Jim Chriss has provided valuable insights into the literature on social interaction and influence. We thank the discussants and the participants for their comments at the 7th Northeast Ohio Economics Workshop (Cleveland State University), International Congress on Agent Computing (George Mason University), and 43rd Eastern Economic Association Meetings (New York). The comments of Marcos Fernandes were particularly helpful. Finally, we owe a special thanks to Hugh MacMullan of Wharton Computing for his technical support during the simulation stage of the project.Appendix
Online appendices A, B and C are available here.
References
ABBE, E. (2017). Community detection and stochastic block models: Recent developments. Journal of Machine Learning Research, 18(1), 1–86.
ADAMCZYK, A. (2017). Cross-National Public Opinion about Homosexuality: Examining Attitudes across the Globe. Berkeley, CA: University of California Press. [doi:10.1525/california/9780520288751.001.0001]
ALLPORT, G. W., Clark, K. & Pettigrew, T. (1954). The Nature of Prejudice. Reading, MA: Addison-Wesley.
BENTHAM, J. & Crompton, L. (1978). Offences against one’s self: Paederasty (part 1). Journal of Homosexuality, 3(4), 389–406. [doi:10.1300/j082v03n04_07]
BICCHIERI, C. (2005). The Grammar of Society: The Nature and Dynamics of Social Norms. NewYork, NY: Cambridge University Press.
BOHSTEDT, J. & Williams, D. E. (1988). The diffusion of riots: The patterns of 1766, 1795, and 1801 in Devonshire. The Journal of Interdisciplinary History, 19(1), 1–24. [doi:10.2307/204221]
CENTOLA, D.&Macy, M. (2007). Complex contagions and the weakness of long ties. American Journal of Sociology, 113(3), 702–734. [doi:10.1086/521848]
CENTOLA, D., Willer, R. & Macy, M. (2005). The emperor’s dilemma: A computational model of self-enforcing norms. American Journal of Sociology, 110(4), 1009–1040. [doi:10.1086/427321]
CONELL, C. & Cohn, S. (1995). Learning from other people’s actions: Environmental variation and diffusion in French coal mining strikes, 1890-1935. American Journal of Sociology, 101(2), 366–403. [doi:10.1086/230728]
CRANE, D. (1999). Diffusion models and fashion: A reassessment. The Annals of the American Academy of Political and Social Science, 566(1), 13–24. [doi:10.1177/0002716299566001002]
GOFFMAN, E. (1963). Stigma: Notes on the Management of Spoiled Identity. New York. NY: Simon and Schuster.
GRANOVETTER, M. S. (1973). The strength of weak ties. American Journal of Sociology, 78(6), 1360–1380. [doi:10.1086/225469]
GROW, A., Flache, A. & Wittek, R. P. M. (2017). Global diversity and local consensus in status beliefs: The role of network clustering and resistance to belief change. Sociological Science, 4, 611–640. [doi:10.15195/v4.a25]
HARDIN, R. (1982). Collective Action. Baltimore, MD: John Hopkins University Press.
KURAN, T. (1995). Private Truths, Public Lies: The Social Consequences of Preference Falsification. Cambridge, MA: Harvard University Press.
MARK, N. P., Smith-Lovin, L. & Ridgeway, C. L. (2009). Why do nominal characteristics acquire status value? A minimal explanation for status construction. American Journal of Sociology, 115(3), 832–862. [doi:10.1086/606142]
NOELLE-NEUMANN, E. (1974). The spiral of silence a theory of public opinion. Journal of Communication, 24(2), 43–51. [doi:10.1111/j.1460-2466.1974.tb00367.x]
OLIVER, P. E. & Marwell, G. (1988). The paradox of group size in collective action: A theory of the critical mass. II. American Sociological Review, 53(1), 1–8. [doi:10.2307/2095728]
OLSON, M. (1965). The Logic of Collective Action: Public Goods and the Theory of Groups. Cambridge, MA: Harvard University Press.
PARK, A. & Rhead, R. (2013). Personal Relationship: Changing Attitudes towards Sex, Marriage, and Parenthood. London: NatCen Social Research
PESCOSOLIDO, B. A. & Martin, J. K. (2015). The stigma complex. Annual Review of Sociology, 41, 87–116. [doi:10.1146/annurev-soc-071312-145702]
PRENTICE, D. A. & Miller, D. T. (1993). Pluralistic ignorance and alcohol use on campus: Some consequences of misperceiving the social norm. Journal of Personality and Social Psychology, 64(2), 243. [doi:10.1037/0022-3514.64.2.243]
RIDGEWAY, C. (1991). The social construction of status value: Gender and other nominal characteristics. Social Forces, 70(2), 367–386. [doi:10.2307/2580244]
RIDGEWAY, C. L. & Balkwell, J. W. (1997). Group processes and the dffusion of status beliefs. Social Psychology Quarterly, (pp. 14–31). [doi:10.2307/2787009]
ROGERS, E. M. (2003). Diffusion of Innovations. New York, NY: Free Press.
RYAN, B. & Gross, N. C. (1943). The diffusion of hybrid seed corn in two Iowa communities. Rural Sociology, 8(1), 15.
SCHELLING, T. C. (1971). Dynamic models of segregation. Journal of Mathematical Sociology, 1(1), 143–186.
SIMMEL, G. (1955). Conflict and the Web of Group Affiliations. New York, NY: Free Press.
SMITH, T. W., Son, J. & Kim, J. (2014). Public attitudes towards homosexuality and gay rights across time and countries. Institute on Sexual Orientation and Gender Identity Law and Public Policy. NORC, University of Chicago.
STRANG, D. & Soule, S. A. (1998). Diffusion in organizations and social movements: From hybrid corn to poison pills. Annual Review of Sociology, 24(1), 265–290. [doi:10.1146/annurev.soc.24.1.265]
VALENTE, T. W. (1995). Network Models of the Diffusion of Innovations. Cresskill, NJ: Hampton Press.
WATTS, D. J. & Strogatz, S. H. (1998). Collective dynamics of ‘small-world’ networks. Nature, 393(6684), 440. [doi:10.1038/30918]
WILLER, R., Kuwabara, K. & Macy, M. W. (2009). The false enforcement of unpopular norms. American Journal of Sociology, 115(2), 451–490. [doi:10.1086/599250]