
Introduction
Despite its economic interest in France (Dedieu et al. 2017; Sainte-Beuve et al. 2011) and the increasing consumer demand for organic food, organic farming is still a residual choice for farmers. Conversion to organic farming is thus a rather poorly understood change in farming behaviour. One of the major issues in understanding this change consists in distinguishing between the role of farm characteristics and that of social dynamics in the process of adopting organic farming. The position varies with the chosen disciplinary approach. Agronomists argue that farm characteristics play the dominant role (Neumeister et al. 2011; Pavie et al. 2002; De Buck et al. 2001), economists argue that prices and funding are responsible (Kaufmann et al. 2009; Kerselaers et al. 2007; Latruffe et al. 2013), and social psychologists claim that subjective norms and professional identities are the determining factors (Lamine & Bellon 2009; Padel 2001; Burton & Wilson 2006; Mzoughi 2011; Stock 2007).
We recently tried to address this issue by implementing a recent view of the social dynamics of this adoption in an agent-based model (Xu et al. 2018). Indeed, conversion to organic farming has been qualified, not only as an innovation adoption, but also as a major change (Sutherland et al. 2012 ) or a transformational adaptation (Rickards & Howden 2012; Dowd et al. 2014), as well as a social movement (Sutherland & Darnhofer 2012; Fairweather et al. 2009; Darnhofer et al. 2005; Rigby et al. 2001; Pavie et al. 2002). It often implies that farmers change their worldview and social networks and generally begins with a powerful need for change (Barbier et al. 2015; Sutherland et al. 2012). This change, which involves a number of social processes relating to farms, farmers, their peers and their environment, has rarely been studied (Burton et al. 2003). This is why, in Xu et al. (2018), we proposed a model that includes both major and minor changes as possible causes for the evolution of farmers and their farms. A minor change consists in copying the practices of similar credible farms. This imitation heuristic represents the dynamics of changing practices with a view to adopting the relevant practice that is perceived as offering the highest performance (based on the copying of more credible — i.e. more productive— neighbours, who are relevant information sources since they have similar farms). A major change is based on satisfaction with the current strategy (conventional or organic). When this level of satisfaction is too low, it may be compared with the level which the farmer would have if the alternative strategy were adopted. Satisfaction levels are computed based on the evolution of farm productions (positive or negative) and a process in which the farmer’s current productions are compared with those of other farmers. The farmer changes strategy when his/her satisfaction with the alternative strategy is sufficiently greater than his/her satisfaction with the current strategy. This satisfaction involves two important aspects of the farmer’s identity: the desire for security and/or the desire to improve results by exploiting changes in production levels, on the one hand, and the desire to be a “good farmer” in comparison with credible others, on the other. A strategy change implies changing the nature of the farm’s production, and thus changing one’s view of the credibility of other farmers with reference to these productions. Therefore, minor and major changes modify the social networks associated with similarity and credibility among farmers. This model is described in detail in Section 2.1-2.52, in which the results of the first study are also presented.
This first study, performed on highly simplified models of farms, suggests a variety of possible trajectories for farmers (and their farms) explaining why they do not adopt organic farming. However, the implemented populations are very simple and it is our intention to extend the approach to embrace more elaborate and data-driven models of farmers and farms.
More precisely, our model includes minor changes of practice resulting from the imitation of similar peers (i.e. having similar farms) who are credible — credibility being assessed by comparing one’s own with other farmers’ productions. It also includes major changes of strategy (i.e. conventional or organic farming) that are driven by the satisfaction with each strategy. Farmers’ satisfaction levels are based on the development of their own productions as well as on a comparison of one’s own productions with those of other credible farmers. Thus, the credibility that farmers attribute to each other can be seen as an influence network which is related to the similarity between farms (despite the fact this network is not modelled as a network). This influence network and its evolution have a significant impact on the adoption rate in the model. The farms in Xu et al. (2018) are divided into three categories (small, medium and large potential milk production) and the farms in the different categories do not interact much since the interactions rely strongly on similarity between farms. More elaborate farm models are expected to extend the scope of similarity, affecting related farmer credibility and, potentially, the organic farming adoption rate.
In this context, the present paper attempts to achieve two aims:
- To extend the model proposed in Xu et al. (2018) to more highly elaborated and data-driven farm representations;
- To analyse the simulations in the model by focusing on the role of social dynamics, as compared to the role of the farm characteristics, in the adoption of organic farming.
We use data on French dairy farmers. The level of organic farming remains surprisingly low in this type of farm: France is a major milk producer, but only 2.4% (in 2016) of produced milk is organic. This adoption level justifies placing the focus on social dynamics and farm characteristics in the model. Indeed, the numerous dairy crises and increasing knowledge about how to farm organically have made the conversion financially profitable, as shown in France by Dedieu et al. (2017) and Sainte-Beuve et al. (2011). At the same time, Latruffe et al. (2013) have shown that, unlike vegetable farmers, who mainly consider the economic impact of the conversion to organic farming, dairy farmers focus on the technical and identity-related aspects. This is why, considering that the costs and benefits balance one another out and therefore make organic farming equally interesting economically as conventional farming (Dedieu et al. 2017), we ignore the economic dimension and focus on social dynamics, and in particular on the social identities of “good farmers” in the sense of “large-scale producers”.
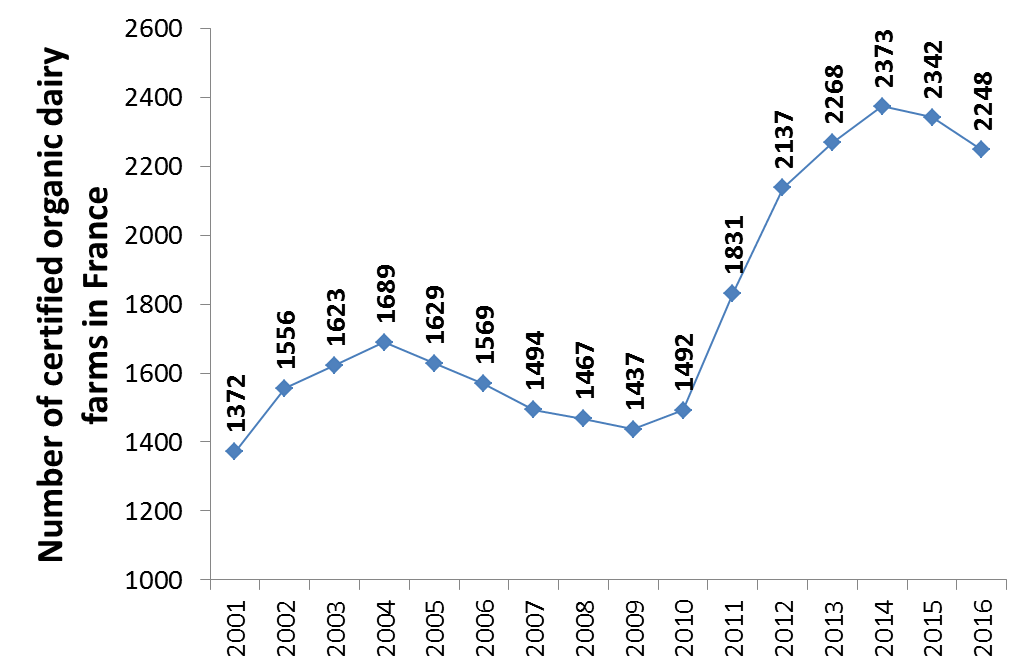
France is the second largest European cow's milk producer after Germany. In 2016, there were 58,000 dairy farms in France, 2248 of which were organic farms (3.88%). The change in the number of organic dairy farms since 2001 is presented in Figure 1.
The implementation of our model for dairy farming in France is presented in detail in Section 2.53-2.65. Our virtual population represents dairy farmers at the “canton” level (French administrative area as defined until the end of March 2015). This choice was made since a “canton” is a sufficiently small French geographical area for us to be able to assume that all the farmers in a canton know each other. It is also small enough for us to assume that all the farms in one and the same canton are exposed to the same agronomical constraints, for example in terms of soils, altitude, etc. Finally, it is described by the French Agricultural General Censuses (FAGC) in terms of farming activities.
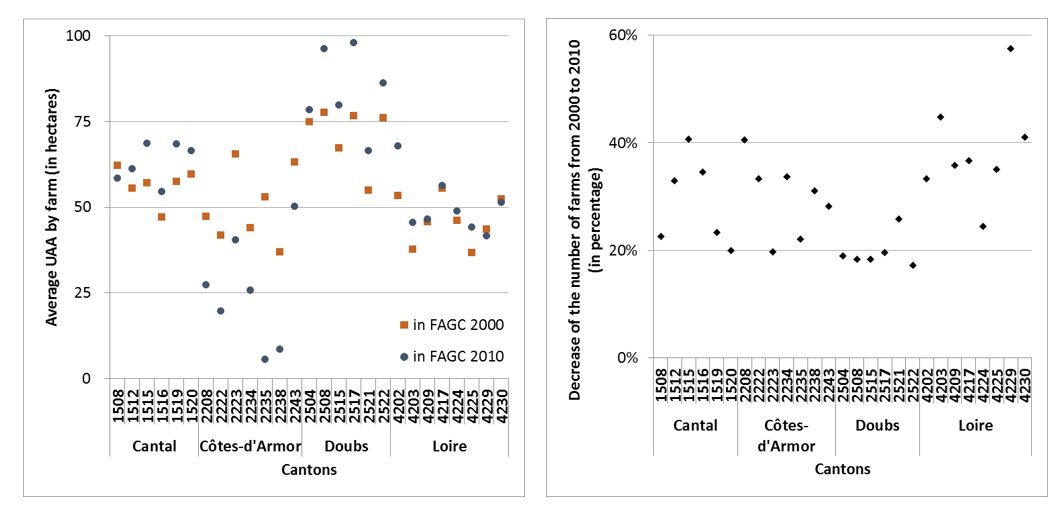
We therefore chose 27 French “cantons” which had at least 60 dairy farmers in 2000 and which varied in their average farm characteristics (see Figure 1 in Appendix A for details). These variations correspond to differences in practices in terms of intensiveness (measured in this paper in terms of the number of hectares required by a farm in order to produce one litre of milk). The larger the farm is as measured in hectares, and the lower the quantity of milk it is authorized[1] to produce per hectare, the less intensive it is. Low-intensity farms are considered to have practices similar to those of organic farms and are possibly easier to convert to organic farming. This is why we vary the average “intensity” of the selected “cantons” when implementing the model. Our 27 French “cantons” are located in four different French “départements”: Cantal (identified by the number 15) in the Auvergne region; Côtes d’Armor (identified by the number 22) in the Brittany region; Doubs (identified by 25) in the Franche-Comté region; Loire (identified by 42) in the Rhône-Alpes region. Details about the average farm characteristics of our cantons are given in Appendix. The way their dairy farming populations are implemented in the model is described in Sections 2.53-2.65. Concepts of the model have been adapted and slightly redefined in order to match the concept for farm description in the FAGC.
These 27 virtual canton populations form the basis for defining the impact of farm characteristics and social dynamics on the proportion of organic farmers. At this point, it is important to keep in mind that all our virtual cantons started with no organic farmers at the beginning of the simulation. These farmers emerge from the dynamics of the model. Our study confirms that farm characteristics are the main driver of the conversion to organic farming. However, it also suggests the importance of social dynamics. Section 3 presents our results and provides details about the impact of each type of social dynamic (imitation of a minor change and/or the computation of satisfaction with a major change). It also shows that changes in the distribution of farm characteristics should be taken into account. Indeed, when these distributions change (because of farmers’ decisions, as well as due to institutional actions or market economics), the relationships of credibility and similarity between farmers change. This change affects the dynamics of conversion to organic farming.
The next section is dedicated to the materials and methods. It presents in detail the model (including the results from the previous study), the design of the farm populations based on census data and, finally, the experimental design of the simulations. Section 3 describes our results together with explanations for the observable evolutions in our populations, on the one hand, and a discussion about the simulated number of organic farmers compared to the available data, on the other. The last section concludes and outlines the limitations of our work.
Materials and Methods
The model
General principles
Agent-based modelling (Goldstone & Janssen 2005) or individual-based modelling (Grimm 1999) appear to be relevant and appropriate ways of testing the consequences and relevance of different hypotheses on farmers’ decision processes. As pointed out in Huet et al. (2018) and Xu et al. (2018), none of the current agent models is well-equipped to represent the conversion to organic farming as a decision process relating to a major change, involving deep modifications in the agent’s world view and social interactions. This is the reason why the model, described with detailed reference to the literature in Xu et al. (2018), explicitly includes a difference between minor and major changes, which involve different decision process. The main original features of the model are the following:
- Like Kaufmann et al. (2009), we propose a dynamic model of the Theory of Reasoned Action (TRA) (Fishbein & Ajzen 1977) in order to compute a farmer’s satisfaction. In the model, an agent’s decision regarding conversion is based on a comparison of satisfaction with the current strategy with potential satisfaction with an alternative one. These levels of satisfaction are computed based on the attitude and the subjective norm related to the current or alternative strategy. Both attitude and subjective norm are dynamic and based on the difference in productions. In line with the TRA (Fishbein & Ajzen 1977), our model uses decomposed variables: attitude and subjective norm — instead of global variables as in Kaufmann et al. (2009). Our work thus assumes that a farmer agent’s satisfaction is based on the farmer’s concrete strategy and practice instead of an abstract general opinion. Satisfaction relates to the farmer’s own experiences and the peers’ strategies and practices.
- A farmer agent's attitude about its current strategy is modelled as the difference between its past productions with its current strategy and its current productions. This choice is grounded in Mintzberg et al. (1976); Öhlmér et al. (1998), who argue that farmers' earlier practices have a great influence on their decisions about future practices. In the model, the agent's attitude regarding an alternative strategy results from the difference between past productions of using the current strategy and the productions of resulting from the alternative strategy on a similar farm or as described in the media.
- The subjective norm involves a comparison with peers, weighted by their credibility. This credibility is based on the difference between production levels.
- As Darré (1985) showed that farmers co-construct their practices, the farmers in the model update their practices by copying the performances of credible peers who have similar farms (Centola 2015). In line with Sutherland (2013) and Sutherland & Darnhofer (2012), farmers’ activities are identified by two dimensions: producing, on the one hand, and managing nature, on the other.
- Finally, one important feature of our model is linked to the decision process regarding “major changes” (Sutherland et al. 2012; Rickards & Howden 2012; Dowd et al. 2014). It is assumed that a major change is only considered in critical situations where the agent faces high costs (economic, cognitive, emotional, etc.). Otherwise, agents do not even consider changing their major options. In a stable period, if a farmer agent is sufficiently satisfied with its current farming strategy, it does not envisage an alternative one. Only a certain level of frustration or critical events (inheritance, major change in the farm, etc.) will prompt the farmer to consider an alternative to the current strategy. The search for an alternative begins with observing peers with farms that have similar characteristics (Centola 2015).>li>
Basic elements
Farmer
The model studies the evolution of a population with \(N\) farmer agents. Each agent is characterized by its farm, its farming strategy, its geographical position (which can be used to build a spatial network linking farmers if required by a particular implementation of the conceptual model), its performance defined on several dimensions \(i\) for the evaluation of a practice, the importance \(W_i\) given to each dimension of practice, the credibility (\(C(f,v\))) it attributes to each of the other agents, its memory of applied strategies and performances during the last M periods, its levels of satisfaction with the current farming strategy (\(I_C\)) and an alternative one (\(I_A\)), and the period during which it has retained a strategy (\(DC\)) and been dissatisfied with a strategy (\(DD\)).
\(DC\) and \(DD\) capture the duration between two events related to the decision process. \(DD\) counts an agent’s duration of dissatisfaction with its current strategy. In the model, an agent has to be dissatisfied with its current strategy for long enough in order to change it. \(DC\) counts the duration since the last strategy change. An agent cannot consider changing strategy again even if it becomes dissatisfied with it during the confirmation period. This is consistent with the theory of innovation diffusion (Rogers 1983), in which an agent has a confirmation period just after adopting a new strategy. Both durations are necessary in order to account for an agent’s stability and consistency. The delayed action of both can only occur when the corresponding duration is longer than the parameter \(TD\).
With the exception of \(W_i\), all these attributes of a farmer agent are dynamic during the simulation, and the rules governing the way they change are described in detail below.
Credibility. Each agent \(f\) attributes a credibility \(C(f, v)\) to another agent \(v\) by comparing their respective productions. Thus, any two agents are connected by a credibility. Credibility has a value between 0 (not credible at all) and 1 (very credible).
Satisfaction. Each agent has a satisfaction with its current farming strategy (\(I_C\)) that corresponds to an evaluation of the strategy. It may also evaluate an alternative strategy in certain cases and have a satisfaction with it (\(I_A\)). Satisfaction with a farming strategy lies between 0 (not satisfied at all) and 1 (very satisfied).
If an agent is satisfied with its current farming strategy, it does not consider an alternative. Otherwise, its satisfaction levels with its current farming strategy (\(I_C\)) and with an alternative one (\(I_A\)) are computed and compared. If (\(I_A\)) is higher than (\(I_C\)) by a sufficient amount, the agent will change its farming strategy. \(IC\) is thus computed at every iteration, whereas (\(I_A\)) is only computed when a stable agent is dissatisfied with its current farming strategy.
In accordance with the TRA, the satisfaction \(I_S\) with a farming strategy \(S\) depends on two elements: attitude (\(A_S\)) and subjective norm(\(SN_S\)) toward \(S\). In the original theory, the interaction between these two elements varies, with different agents facing different situations. In order to keep the model simple, satisfaction is assumed to be the average value of these two elements.
| $$l_S=\frac{A_S+SN_S}{2}$$ | (1) |
Both attitude and subjective norm lie between -1 (very negative attitude/subjective norm concerning the farming strategy to be evaluated) and 1 (very positive attitude/subjective norm concerning the farming strategy to be evaluated). They are computed on the basis of the farms' productions, the farmers' strategies, and credibility. See the section ``Farmers' dynamics'' for the details regarding computation.
Considering the range of values for attitudes and subjective norms concerning a farming strategy, satisfaction should also lie between -1 and 1. However, to facilitate other calculations, satisfaction is normalized between 0 and 1.
Performance. Performance is evaluated over two dimensions: the level of output production (i.e., the productivity impact, in our case milk production), and the level of environmental amenities production (i.e., the environmental impact), respectively called productivity performance (\(P_0\)) and environmental performance (\(P_1\)) in the paper. We assume \(P_0\) and \(P_1\) lie between 0 (very bad on a given performance dimension) and 1 (very good on a given performance dimension).
Importance place on each dimension. The importance placed on the productivity dimension is termed \(W_0\), and that placed on the environmental dimension is termed \(W_1\). \(W_0\) and \(W_1\) lie between 0 (not important at all) and 1 (most important). They sum to 1.
| $$W_0+ W_1=1$$ | (2) |
Importance defines an agent’s personal values. An agent uses its own perspective to judge the information it receives and the other agents it meets. In this model, both (W_0\) and \(W_1\) are kept constant if an agent does not change its farming strategy.
Farming strategy. This is defined by the importance that a farmer attributes to each dimension of practice. Two farming strategies are considered: organic and conventional. The organic strategy places more importance on the environmental dimension and less on the productivity dimension, whereas the conventional strategy places greater importance on the productivity dimension than on the environmental dimension. It is assumed that when a farmer agent changes its strategy, it changes the importance attributed to the different dimensions accordingly.
Farm
A farm has three attributes: its farming production (productivity outcome) \(T_0\), its environmental amenities production (for example, volume of chemical inputs, energy consumption, etc.) \(T_1\), and its reference \(R\). \(R\) is the maximum possible productivity performance in the light of a farm's characteristics and evolution. Interviews and expert opinion show that the references of conventional farms are grounded in the negotiations with dairy enterprises (often expressed in terms of the ``quota'' in Europe in the past). Organic farms have more constraints in terms of reference due to stricter regulations. Consequently, a conventional farm \(f\)'s reference is considered as its farmer \(f\)'s initial productivity performance \(P_0^f\) (\(t=0\)) and that for an organic farm is a function \(l\) of \(P_0^f\) (\(t=0\)).p>
| $$R^f= \begin{cases} P_0^f (t=0)\quad\text{if}\, f\, \text{is a conventional farm/farmer}\\ l \bigl( P_0^f (t=0)\bigr) \quad\text{otherwise}\\ \end{cases}$$ | (3) |
The implementation of a farm may need more attributes for different use cases. The detailed computation of \(T_0\) and \(T_1\) are defined in the model's implementation (see Sections 2.54-2.65).
Media
When an agent is dissatisfied with its current farming strategy and looks for an alternative, it first searches in the population for other agents having similar characteristics but using an alternative farming strategy. If it cannot find one, it can access the media to find an alternative farming strategy model. These models result from certain functions that depend on the farm's current productions.
Dynamics
One time-step (iteration) \(t \rightarrow t+1\) represents one year, i.e. once a year, farmers decide on their farming strategies, their performance and so on. During any iteration, the order in which the farmers are updated is randomly selected by a uniform distribution.
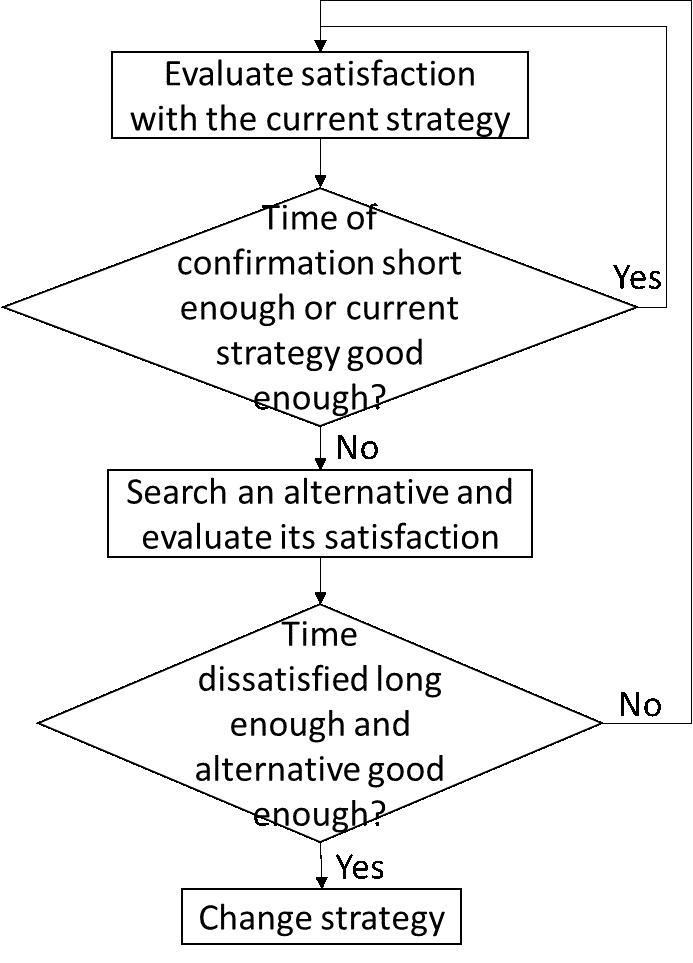
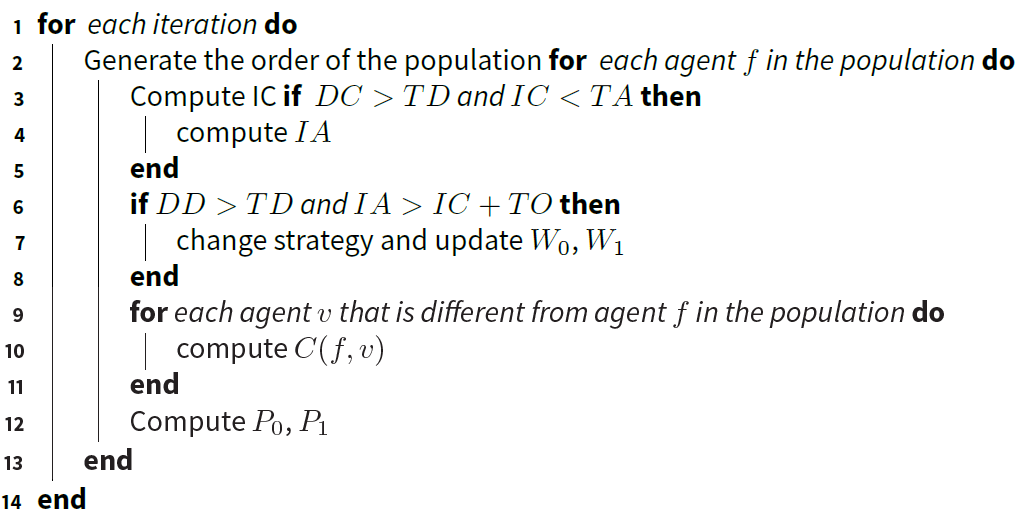
As shown in Figure 2 and the pseudocode of Algorithm 1, during each iteration, an agent evaluates its satisfaction with its current farming strategy. If the agent is in a stable period and is satisfied with its current strategy, it does not consider a change. Otherwise, the agent looks for an alternative and evaluates it. If the agent has been dissatisfied for long enough and the alternative is good enough, it will change. Otherwise, the agent stays with its current farming strategy. It will then update the credibility it attributes to other agents and its performance. The details can be seen below.
Credibility update
Every relationship between two agents is characterized by the credibility one attributes to the other and depends on an agent’s personal view of its difference to another in terms of productions. For agent \(f\), its difference to agent \(v\) is the sum of the differences on each production dimension weighted by the importance given to each dimension.
| $$D_v^f=\sum_{i=1}^2 \Biggl( W_i^f (T_i^v - T_i^f) \Biggr)$$ | (4) |
The credibility that agent \(f\) attributes to agent \(v\) is calculated on the basis of \(f\)’s difference to \(v\):
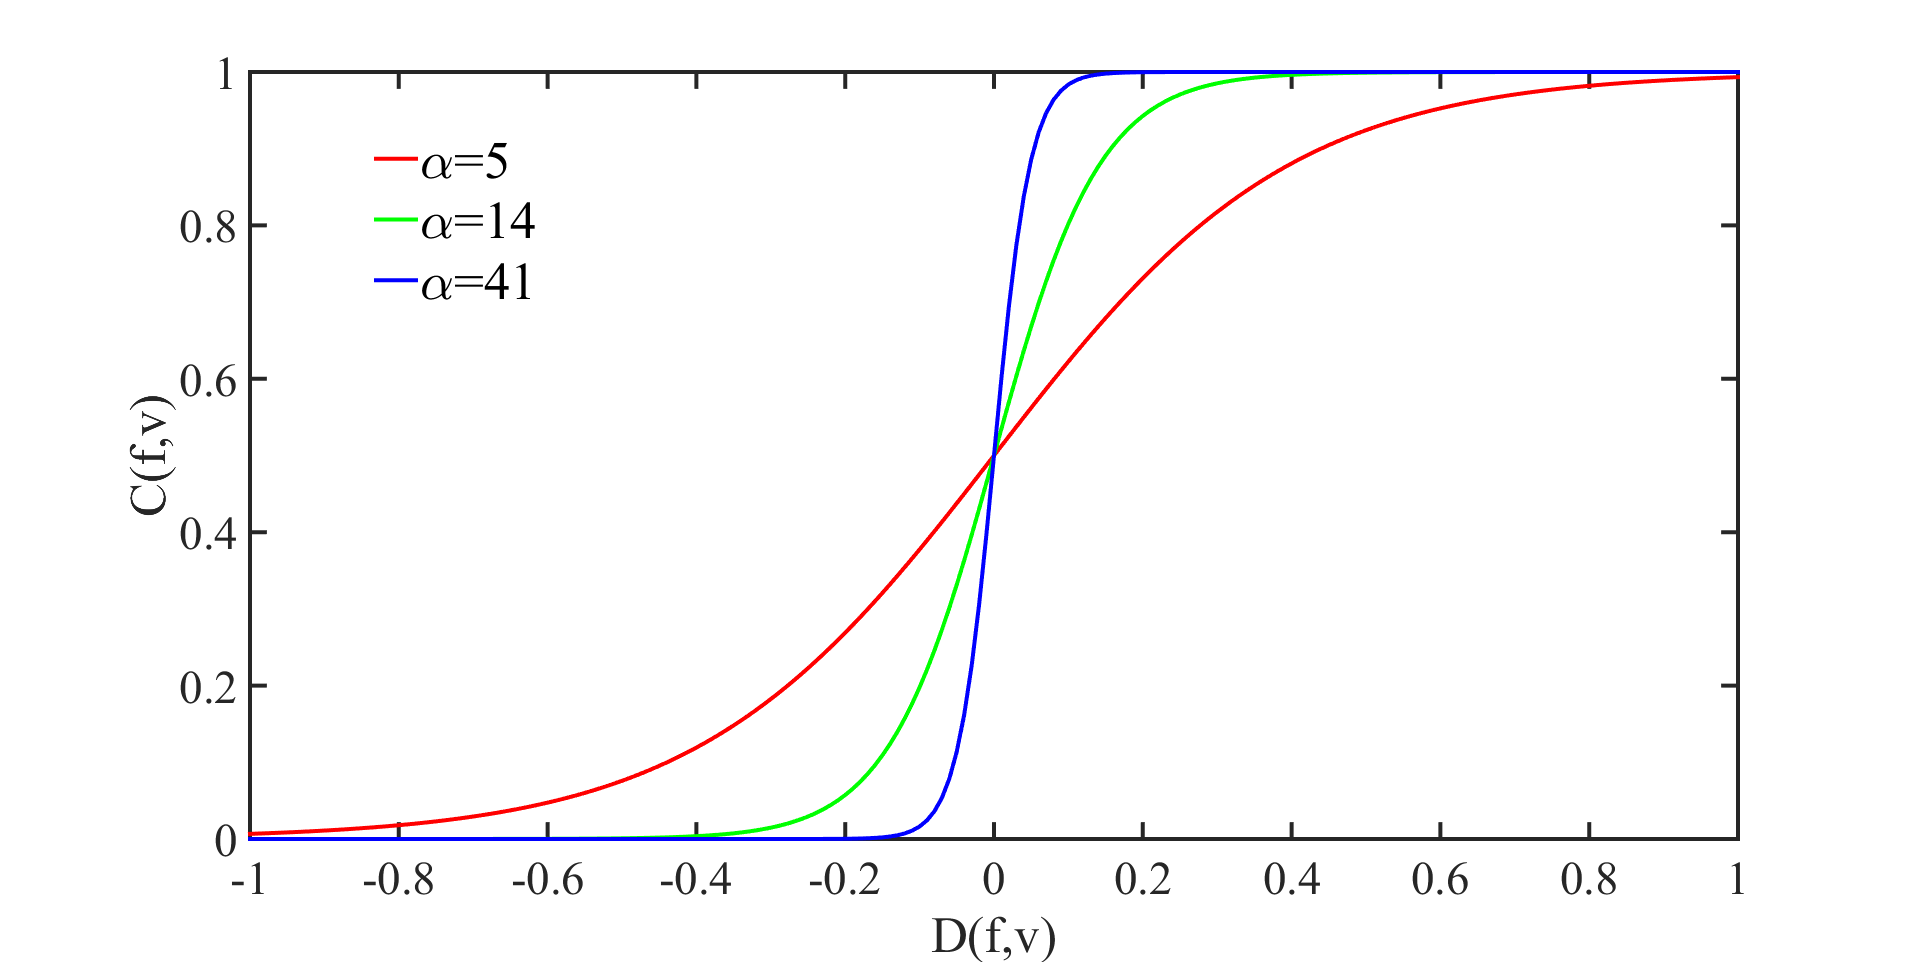
| $$C_v^f=\frac{1}{1+e^{-\alpha D_v^f}}$$ | (5) |
In Figure 3, agent \(f\)’s difference and credibility vis-à-vis \(v\) are respectively plotted on the x-axis and y-axis, respectively. When the difference is negative, this means that \(v\) has worse productions than \(f\), and \(f\) therefore attributes little credibility to \(v\). When the difference is positive, \(v\) has better productions than \(f\) and \(f\) therefore attributes considerable credibility to v.
The lines with different colours represent \(\alpha\) variations that characterize the degree of bias that an agent has for others with better productions. When \(\alpha\) is small, the bias is small. An agent tends to attribute the same credibility to others irrespective of whether they achieve better productions. If \(\alpha\) is large, the bias is strong. Only others with better productions are credible.
In the model, any two agents are ``potentially connected'' by a credibility indicating the respective influence they have on each other. Credibility depends on an agent's perceived difference in productions compared to another and it is then used to update the agent's productions, thus potentially changing the perceived difference. If credibility is too small (lower than a threshold cred), it is considered totally incredible. The two agents are then not connected. For example, if the calculated credibility that agent \(f\) attributes to agent \(v\) is less than cred, the real credibility in the model will be 0. This means that agent \(v\) has no influence on agent \(f\). Thus, the relationship associated with credibility is dynamic, oriented and not complete.
Change of farming strategy
An agent changes its farming strategy in the light of the evaluation of its satisfaction with its current farming strategy (\(I_C\)) and with the alternative one (\(I_A\)). If an agent is in a stable state (its confirmation duration \(DC\) > threshold \(TD\)) and it is still dissatisfied with its current farming strategy (\(I_C\) < threshold \(TA\)), it will consider an alternative one. If the agent is dissatisfied for long enough (its dissatisfaction duration since being stable \(DD > TD\)) and its evaluation of the satisfaction of the alternative is sufficiently greater than its satisfaction with its current one (\(I_A > I_C\) (1 + threshold \(TO\))), it will change farming strategy. As stated in Equation 1, satisfaction \(I\) with a strategy is the average sum of the related attitude \(A\) and subjective norm \(SN\).
In Equation 1, attitude (\(A_S\)) represents an agent's personal view of the difference between its experience and the (potential) productions resulting from evaluated strategy \(S\).
Agent \(f\)'s experience (\(T_{C,i}^{\overline{f}}\), \(i\) can be 0 or 1 to represent each dimension) is its memory (\(M\)) of the average production on the farm with its current farming strategy (\(S^f\)). It is calculated as follows:
| $$T_{C,i}^{\overline{f}}=\frac{\sum_{t\,\text{and}\,S^t=S^f}^M T_i^{f,t}}{Nb(S^t=S^f)}$$ | (6) |
\(T^{f,t}_i\) is agent \(f\)'s memory \(M\) of production at time \(t\). \(S^t\) is agent \(f\)'s strategy at time \(t\). \(S^f\) is agent \(f\)'s current strategy. \(Nb(S^t= S^f)\) is the number of experiences for which agent \(f\) has had the same strategy as the current strategy in memory.
The evaluated production depends on the strategy to be evaluated. For the evaluation of agent \(f\)'s current farming strategy, the evaluated production is \(f\)'s current production (\(T^f_i\)).
Agent \(f\)'s attitude toward the current farming strategy (\(A_C\)) is as follows:
| $$A_C^f = \sum_{i=1}^2 \Biggl( W_i^f (T_i^f-T_{C,i}^{\overline{f}}) \Biggr)$$ | (7) |
If an agent's productions on its farm changes and this change is considered better than its experience, \(A_C\) will be positive and strengthen the agent's decision to keep its current strategy. Otherwise, \(A_C\) will be negative and may influence \(I_C\). In this case, the agent may be dissatisfied and evaluate \(I_A\).
For agent \(f\)'s evaluation of an alternative farming strategy, the evaluated production is the average production (\(T_{A,i}^{\overline{f}}\), \(i\) can be 0 or 1 to represent each dimension) of other agents having similar farm characteristics as \(f\) but applying the alternative. The level of similarity between two farms is computed with a function \(Y_v^f\) defined as the difference in farm characteristics between \(f\)'s farm and \(v\)'s farm. It is then compared with a distance threshold simi. If \(Y_v^f\) is less than simi, the two farms are considered as similar. \(Y_v^f\) is defined in the implementation of the model (see Sections 2.53-2.65). The evaluated production is computed as follows:
| $$T_{A,i}^{\overline{f}} = \frac{\sum^N_{Y_v^f< simi \text{ and }S^v\neq S^f}T_i^v}{Nb(Y_v^f< simi \text{ and }S^v\neq S^f)}$$ | (8) |
\(N\) represents all agents in the population. \(T_i^v\) is the production of agent \(v\). \(S^v\) is agent \(v\)'s current strategy. \(S^f\) is agent \(f\)'s current strategy. \(Nb(Y_v^f < simi\) and \(S^t\neq S^f\)) is the number of peers having similar farm characteristics to and different farming strategies from agent \(f\).
If agent \(f\) has no corresponding peer (no other agents having similar farm characteristics and different farming strategies), it will search the media to find stereotypical farm production in order to evaluate the alternative.
| $$T_{A,i}^{\overline{f}}=T_{\text{model},i}^f$$ | (9) |
Therefore, agent \(f\)’s attitude toward an alternative is:
| $$A_A^f= \begin{cases} 0\quad\text{if}\quad (I_C^f>TA)\\ \sum_{i=1}^2 \Biggl( W_i^f (T_{A,i}^{\overline{f}}- T_{C,i}^{\overline{f}}) \Biggr)\quad\text{otherwise} \end{cases}$$ | (10) |
Another component of satisfaction is the subjective norm, which represents how an agent considers others' opinions concerning the evaluated farming strategy on the basis of productions, i.e. the results of implementing the strategy. It is thus the difference perceived by an agent between the production to be evaluated and the average of other agents' productions.
For agent \(f\)'s evaluation of its current farming strategy, the subjective norm is:
| $$SN_C^f=\sum_{i=1}^2 \Biggl( W_i^f \Bigl( T_i^f - \frac{\sum_{v\neq f}^N (C_v^fT_i^v)}{\sum_{v\neq f}^N C_v^f} \Bigr) \Biggr)$$ | (11) |
An agent will be socially satisfied if it perceives that other agents, especially those to whom it attributes a high level of credibility (''important others''), consider it to be a ‘good farmer'. The agent may be so satisfied at having a good social image that it will never consider a major change. Otherwise, if the agent feels that it has a poor social image, it may try to become more similar to others in the group or to change group. This can be done with a change of strategy.
For the evaluation of an alternative farming strategy, the subjective norm is:
| $$SN_A^f = \begin{cases} 0\quad\text{if}\quad (I_C^f>TA)\\ \sum_{i=1}^2 \Biggl( W_i^f \Bigl( T_{A,i}^{\overline{f}} - \frac{\sum_{v\neq f}^N (C_v^fT_i^v)}{\sum_{v\neq f}^N C_v^f} \Bigr) \Biggr)\quad\text{otherwise} \end{cases}$$ | (12) |
If in other agents' opinions, especially those to whom agent \(f\) attributes great credibility (''important others''), the alternative is not better, then it is judged to be not good enough to improve the situation. Agent \(f\) will tend to keep its current strategy. Otherwise, the agent's subjective norm strengthens its intention to change its strategy.
If an agent changes its strategy, it also changes the importance placed on each dimension of practice. The parameter \(W\) is the initial importance placed on the productivity dimension by conventional farmers.
| $$\text{For conventional agents: }W_0 = W\text{; }W_1 = 1-W$$ | (13) |
| $$\text{For organic agents: }W_0 = 1-W\text{; }W_1 = W$$ | (14) |
Performance update
As farmers co-construct their practices (Huet et al. 2018), a farmer agent updates its performance at each time \(t\) by copying the practices of its credible peers with a similar farm.
| $$\Delta P_i^f = \frac{\sum^N_{v\neq f\,\text{and}\,Y_v^f<\textit{simi}} C_v^f(P_i^v-P_i^f)}{\sum^N_{v\neq f\,\text{and}\,Y_v^f<\textit{simi}} C_v^f}$$ | (15) |
Both performance dimensions are between 0 and 1. A farmer's productivity performance is also limited by its farm's reference.
| $$P_0^{f,t+1}= \begin{cases} 0\quad\text{if}\quad(P_0^{f,t}+\Delta P_0^f< 0)\\ R^f\quad\text{if}\quad(P_0^{f,t}+\Delta P_0^f>R^f)\\ P_0^{f,t}+\Delta P_0^f\quad\text{otherwise} \end{cases}$$ | (16) |
We therefore see that, in addition to the credibility relationship between farmers, they are also connected to each other by an information network based on their similarity in terms of farm characteristics. Performance is therefore updated on the basis of an underlying inter-farmer network which is defined by links indicating the similarity between their farms and weighted by the credibility they attribute to each other. This network governs the influence they have on each other's practices (i.e. performance). A subnetwork of this network corresponding, for a farmer, to the farmer's similar credible neighbours having a different farming strategy, is the implicit network informing this farmer about the interest of the alternative strategy in order to define his or her attitude concerning this strategy (see Equation 8). As credibility is not symmetric and since strategies can change during the simulation, we once again point out that the relations between farmers are oriented and dynamic and that the underlying network is not complete.
Previous study using the model
Our model was introduced in an initial study conducted by Xu et al. 2018 (). We started our study with prototypical farm populations. Our virtual theoretical populations correspond to small populations of 100 farmers each, living in sufficiently small agricultural areas to easily meet each other if they want. Each population includes only three types of farms: small, medium and large. The type (also called the size) is characterized by the maximum volume of milk production on the farm. There is also another indicator, namely environmental production, which is inversely proportional to milk production. As can be observed in real farms, conversion to organic farming is accompanied by reduced milk production and increased environmental production. The reduction and increase are proportional and parameterized in the model. The similarity between farms/farmers is implicitly defined by the fact that farms have only three possible different sizes. In this simple case, a given size is equal to a given milk production level. Moreover, this production level is also the proxy for the farmer's performance. Consequently, the credibility a farmer attributes to another farmer depends on the relative difference in their production levels. We will see that these concepts have evolved slightly due to the adaptation of the model to the data from the French Agricultural General Census.
These parameters, as well as the parameters governing an agent's dynamics (slope of the credibility function, duration of decision and confirmation period, decision threshold, loss of production during the conversion, importance placed on each dimension when evaluating practice, production levels for small, medium and large farms), constitute a package of 9 examined parameters in the first work. The most significant parameters were determined by means of a sensitivity analysis of the results from a large experimental design.
This work also identified farmers' typical change-of-practice trajectories. The change of practice is associated with the production level and changes in credibility and satisfaction (based on comparisons of production dimensions). In our model, these factors are all highly interrelated. These relations explain both adoption and non-adoption. From these trajectories, we have identified the reasons for the non-adoption of organic farming and the relative frequency of each reason. These reasons vary with the size (i.e. the type) of farm.
The results show that the most frequent reason for non-adoption is satisfaction with the current situation. Due to this satisfaction, farmers are not interested in alternatives to their current production mode. They will not evaluate the alternatives for their own farms to any great degree. This reason is common to all farmers, and especially those having large farms and high subjective norms as they are the reference for other farmers.
The second most frequent reason is a negative subjective norm for organic farming. This is a reason for farmers having small and medium farms, as they feel they suffer from a poor evaluation on the part of farmers having much larger farms. Farmers having relatively small farms are not satisfied with their current situation. Due to the negative subjective norm of the alternative, they are dissatisfied with it as well.
The third and fourth most frequent reasons are related to the dissatisfaction duration with the current situation, which lasts not long enough compared to the decision period. This is usually a reason found for farmers having small and large farms, although the explanations are totally different in each case. Although farmers with small farms are dissatisfied with the subjective norm at first, their subjective norm can be improved as practices become homogeneous throughout the population. It is also a reason for farmers with large farms who are dissatisfied with their personal evaluations at first, before this satisfaction subsequently improves as their memories are updated.
Overall, the adoption rate in the model is low. Generally, farmers having small farms are the ones who adopt. In most cases, farmers having relatively large farms do not change their farming strategy due to their satisfaction with the current situation.
Despite the interest of these initial results for an understanding of the conversion dynamics, the fact that we studied very simple populations represents one of the limitations of this first study, as outlined in our introduction. In particular, the notion of types, the fact that practice is defined solely in terms of production level, as well as the very simple way of computing the losses and gains resulting from conversion appear inappropriate for more data-driven farm models, as described in Sections 2.53-2.65.
The design of use cases based on agricultural data
The model was designed with data from the FAGC 2000. In each of the three main French dairy production regions, we selected one or two “départements” and their related ``cantons'' having at least 60 dairy farmers. On average, there were 113 farms per canton, with a standard deviation of 34.6. In total, four “départements” were studied and their INSEE (The National Institute of Statistics and Economic Studies) code is indicated in parentheses: Cantal (15), Côtes d’Armor (22), Doubs (25) and Loire (42). In these “départements”, we simulated 27 "cantons" in which dairy farming is the main activity. We decided to conduct the study at "canton" level to be sure that all the farmers in each canton's population would know each other and that the farms in one and the same canton would be exposed to the same agronomical constraints. Given that, in each of our use cases, all the farmers live in the same "canton", the attribute "geographical position" is the same for all the farmers in each location. To permit comparisons, each of our virtual cantons has 100 farmers.[2] These "cantons" exhibit large variations in terms of the intensity of practice and the homogeneity of farm types. In line with established knowledge and reports in the literature (Pavie et al. 2012; Chambaut et al. 2011), we defined three variables for farms: the utilized agricultural area UAA, the number of dairy cows NC and the quota Q, which is a synthetic indicator of the farm's maximum milk production (the average farm characteristics of each studied canton are shown in Appendix A. A farm's intensity can be measured by calculating UAA/Q. The implementations of the farms, farmers and the media based on real data and the literature are presented in the following.
Farmer
In the model described here, farmer agents are designed on the basis of their practice in the light of their productivity performance \(P_0\) and environmental performance \(P_1\) data. \(P_0\) is directly deduced from the farm's initial characteristics and corresponds to the normalized average milk volume produced by one cow in one year. For farmer agent \(f\) with its farm, at the initial time \(t=0\), \(P_0^f=Q^f/NC^f\). At each time \(t\), \(P_1^f=T_1^f / UAA^f\), Equation 15 is only used to update \(P_0^f\).
The \(Y\) function indicating the extent to which two farmers are judged similar or different is based on the difference between their farms' characteristics regarding UAA and NC. For agent \(f\), agent \(v\) is a peer having similar farm characteristics if \(\frac{|UAA^f-UAA^v|}{UAA^f} < simi\) and \(\frac{|NC^f-NC^v|}{NC^f} < simi\). The value of the threshold simi is fixed at 0.1 in the model.
Thus, in this implementation, the update of farmer \(f\)'s performance \(P_0^f\) at time \(t\) is, in fact, an imitation of credible similar performances --- i.e. the average quantity of milk produced by one cow. Once \(P_0^f\) at time \(t\) is updated, it is possible to compute \(T_0^f\) (farmer \(f\)'s milk production) at time \(t\) based on the farmer's number of cows. Given \(T_0^f\) at time \(t\), we will see in Sections 2.57-2.62 how to compute \(T_1^f\) (environmental amenities production) at time \(t\) (Equations 20 and 21). As soon as we know \(T_1^f\) at time \(t\), \(P_1^f\) (environmental performance) at time \(t\) can be computed based on the UAA of farmer \(f\)'s farm.
Farm
As described above, in the model, each farm is initialized using the crossed distribution of the discretized utilized agricultural areas (UAA) and quotas (Q) of its ``canton'' from FAGC 2000. These values remain constant throughout the simulation. The number of dairy cows (NC) is computed using a law derived from the FAGC data (with a regression \(r^2 =0.9563\)):
| $$NC = 0.2463 UAA + 0.0001106 Q$$ | (17) |
As shown in Figure 4, we derived a linear regression from databases regarding farmers’ production and various other sources [3], in order to estimate the potential maximum milk production of an organic farm starting with the conventional strategy. Knowing the initial productivity performance \(P_0\) after normalization and \(P'_0\) before normalization, a farm \(f\)'s normalized reference \(R\) and reference before normalization \(R'\) are computed as follows:
| $$\text{For a conventional farm: }R = P_0 (t = 0)$$ | (18) |
| $$\text{For an organic farm: }R' = 0.6046 P0'(t = 0) + 1913 NC$$ | (19) |
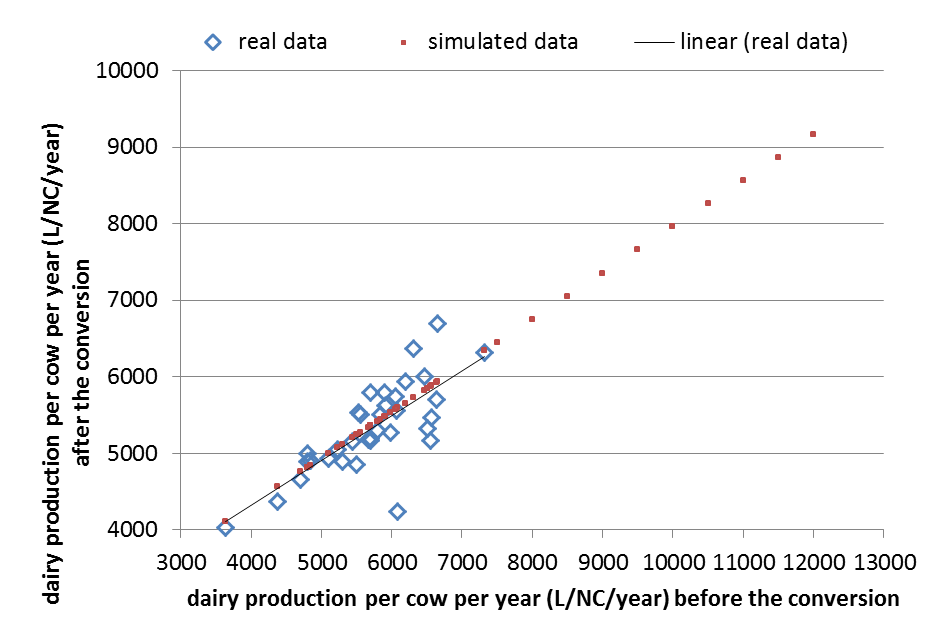
Using the unit litres/cow, the values of \(R'\) and \(P'_0\) are much larger than that of NC. Consequently, the coefficient of NC is much larger than that of \(P'_0\).
Environmental production \(T_1\) is computed at each time-point using an aggregated function reported in the literature (Pavie et al. 2012; Chambaut et al. 2011). It considers mineral impacts and energy consumption related to total milk production and the farm's agricultural surface:
| $$\text{For a conventional farm: }T_1 = (53 UAA + 2.918 T_0)/2$$ | (20) |
| $$\text{For an organic farm: }T_1 = (-10 UAA + 2.588 T_0)/2$$ | (21) |
In line with the database of French dairy farms in FAGC 2000, \(R'\) has to be normalized between 0 (very low production) and 1 (very high production). 53 UAA, 2.918 \(T_0\), -10 UAA and 2.588 \(T_0\) are normalized values between 0 and 1. The normalization is:
| $$x = (x' - min) / (max - min)$$ | (22) |
With: min = minimum real value in the database; max = maximum real value in the database; \(x\) is the normalized value of real value \(x'\).
The media
Farmers' alternative models are designed in the light of the changes of productions in the data. When a conventional farmer \(f\) wants to evaluate the organic strategy at time \(t+1\), it computes \(T_0'(t+1)\) as follows and also calculates the related \(T_1'(t+1)\) with Equation 20. It should be noted that \(T'_0\) is the farmer's real milk production on the farm (before normalization).
| $$T_0'(t+1) = 0.6046 T_0'(t) + 1913 NC$$ | (23) |
When an organic farmer \(f\) wants to evaluate the conventional strategy at time \(t+1\), he or she computes \(T'_0(t+1)\) as follows and its related \(T'_1(t+1)\) with the Equation 21.
| $$T_0'(t+1) = (T_0'(t) – 1913 NC) / 0.6046$$ | (24) |
Each “canton” is initialized with 100 conventional farmers (no organic farming at the beginning). The evolution of each “canton” is simulated over 30 years and replicated 100 times.
| Notation | Definition | Tested value(s) |
| TD | Threshold for the duration of confirmation and dissatisfaction before changing farming strategy | 5 |
| cred | Threshold of credibility to see if a peer can have influence on an agent | 1 |
| M | Size of memory of agent’s farming strategies and practices | 10 |
| simi | Threshold of difference between two farms to see if they are similar | 0.1 |
| \(\alpha\) | Slope of the logistic function in the computation of credibility | {5, 23, 41} |
| TA | Threshold to consider an alternative farming strategy | {0.41, 0.45, 0.49} |
| TO | Threshold to change farming strategy | {0.01, 0.05, 0.09} |
| W | Importance given to the dimension of practice corresponding to an agent’s farming strategy | {0.6, 0.8, 1} |
Analysing the Drivers for Conversion to Organic Farming in the Model
To define the impact on the adoption of organic farming of our various psychological and social dynamics, compared to the role of the farm characteristics, we distinguish in the following between:
- Potential adoption rates explained by initial farm characteristics (at time 0) or after the first 5 years (value of the “waiting” period TD), during which only minor changes can occur due to the dynamics of the model: the influence on the differential performances of farmers having similar farms.
- Real adoption rates, which can be explained by farm characteristics as well as by the social dynamics of interacting farms. These real adoption rates are measured at time 6, i.e. the first date at which a farm can adopt an alternative strategy, and at time 29, i.e. at the end of the simulation. The measure at the end of the simulation indicates the impact of all the dynamics, and particularly the impact of the interactions between organic and non-organic farmers (based on the difference between time 6 and time 29).
The measures presented below are averages over the 81 parameter sets and 100 replications for each set. The details corresponding to the variations due to a particular parameter set are not investigated here since they have already been presented in more detail in Xu et al. (2018. These averages are used as global indicators of the coupled dynamics instead of particular indicators of a particular dynamic. This approach is relevant for comparing what is explained by farm characteristics with what is explained by social dynamics.
Adoption rate evolution in 27 “cantons”
In Figure 5, different colours represent “cantons” in different “départements”. In the first three figures, the x-axis represents the adoption rates at time 0 (initial farm characteristics), the y-axis represents the adoption rates at time 5 (a. initial practice evolution effect), 6 (b. decision effect) and 29 (c. complete effect), respectively, based on the average values over 100 replications of each parameter set. The fourth (d) shows the adoption rates at times 0 and 29 based on the average values over all the 81 parameter sets and the 100 replications of each of them.
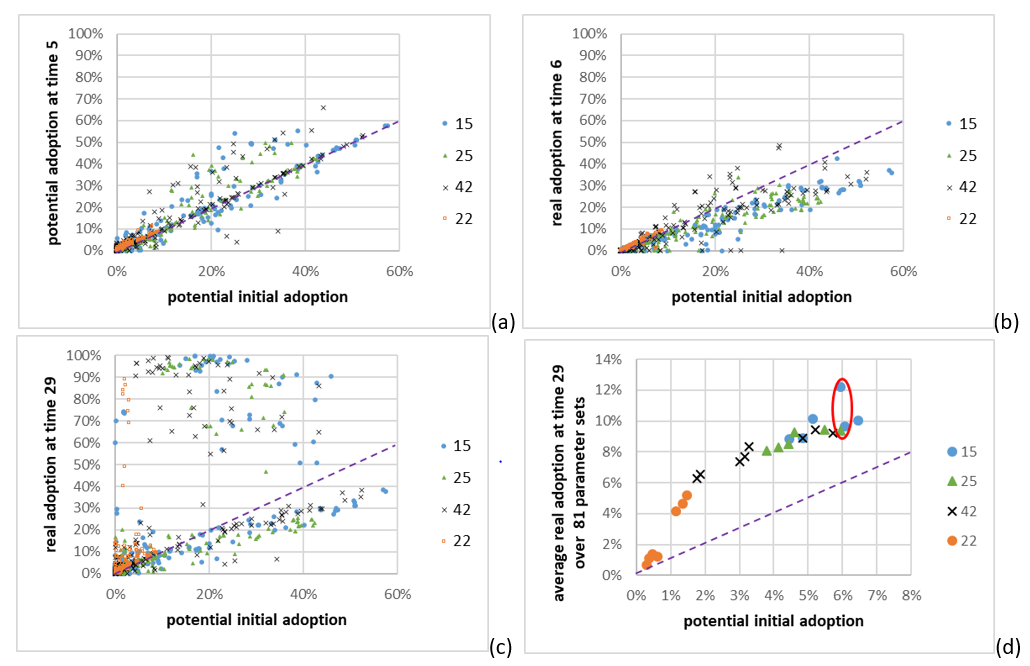
As shown in Figure 5, all the conversion rates at these times retain the same tendency as the virtual adoption rate at time 0 and depend only on the farm characteristics. The Côtes d’Armor “département” has the lowest conversion rate, Doubs and Loire have nearly the same adoption rates, and Cantal has the highest conversion rate. This indicates that the principal determinant of conversion to organic farming is probably the initial farm characteristics.
The average level of adoption in Figure 4 is reduced by nearly a factor of 10 compared to the first 3 figures. This indicates the high frequency of ''0 adoption'', which lowers the average aggregated adoption rates. Overall, our simulation revealed the following non-adoption rates: 63%, 53%, 68%, 52% at times 0, 5, 6 and 29, respectively, for all ''cantons'' over the experimental design (impact of social dynamics: +5% non-adoption at time 6, but -11% non-adoption at time 29). The details corresponding to the variations due to a particular parameter set are not investigated here since they have already been presented in greater detail in Xu et al. (2018).
In some cases, social dynamics can favour adoption up to a 100% adoption rate; in other cases, social dynamics can impede adoption and result in an adoption rate that is lower than the potential one at time 0. Indeed, at time 5, the virtual adoption rates are slightly higher than the initial rates in most ``cantons''. The adoption rates measured at time 6 are lower than at time 5. However, the adoption rates at time 29 are, finally, higher than at other times. This indicates that the adoption rate also depends on social dynamics.
During the first 5 time periods, an agent cannot change its farming strategy. The variation in the adoption rate is due solely to changes in performance. Less productive farms cannot substantially improve their performances due to the maximum production \(R\), while the performances of more productive farms may fall. As a result, more productive farms will have lower total productions and more negative personal evaluations compared to their experiences, and eventually a lower level of satisfaction with the current situation. Thus, the virtual adoption rate at time 5 is higher than at time 0, especially for more productive farms.
At time 6, less productive farms convert immediately since they can increase their milk production (Equations 18 - 19). This can make the alternative less interesting for other agents searching for an alternative. For first adopters, who refer to the media, the evaluation of the alternative depends directly on their own farm characteristics. They can therefore act as references for other ''similar'' farms (in terms of farm characteristics) which are looking for an alternative. Since these first adopters are rather less productive farms, they lead to a worse evaluation of the alternative than that given by the media. Therefore, the adoption rate at time 6 is lower than at time 5.
Later, as adoption becomes more widespread, there are more and more adopters. At time 29, the adoption rates are higher than the initial virtual rates due to social dynamics. This effect is mainly due to the dynamics of the implicit credibility network. Indeed, credibility is based on global productions. These productions are updated on the basis of performance updates and changes in strategy (i.e. conversion to or from organic farming). Thus, when farmers' productions change, the implicit credibility networks also change and this may, in turn, bring about new changes. Figure 6 illustrates how organic farming adoption rates can be sensitive to the initial distribution of milk production (i.e. the quota) in the population.
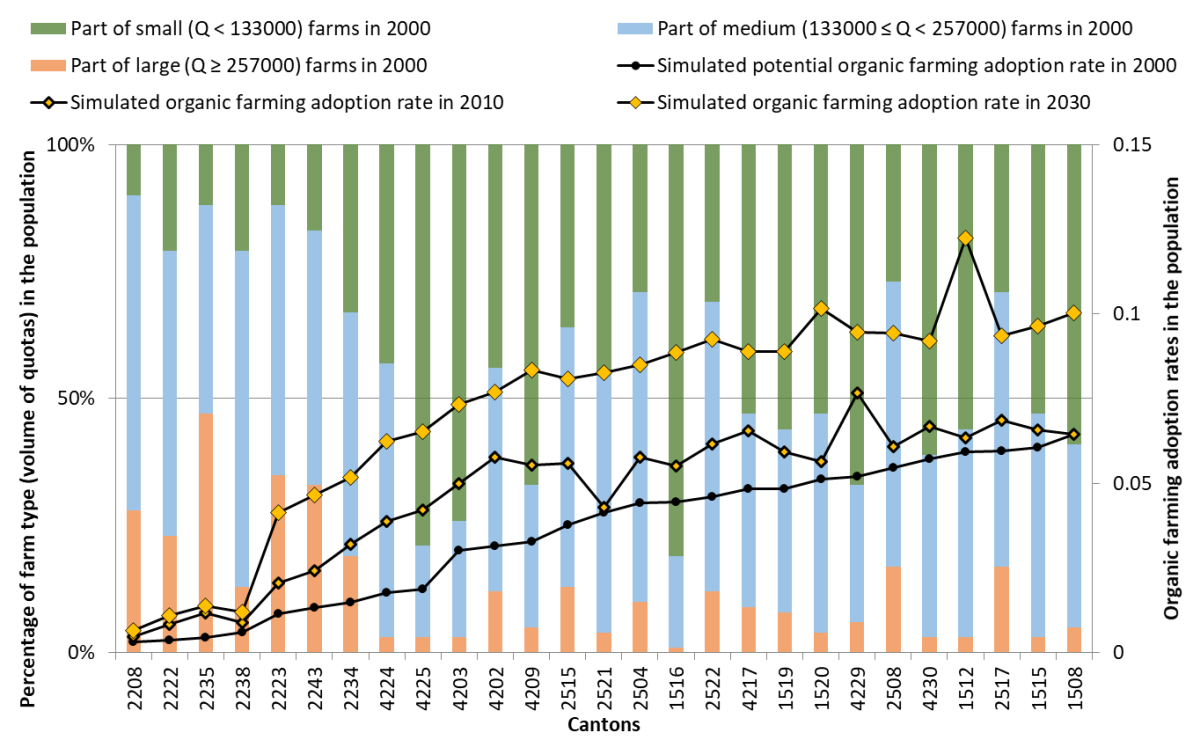
Figure 6 again shows that the organic farming adoption rate is sensitive to the distribution of farms in terms of quota (i.e. the maximum and the initial milk production). In particular, we observe low rates in “département” 22 (Côtes d’Armor), which has the highest proportion of large farms in 2000 and which is quite intensive. However, the results in 2010 and 2030 also reveal the effects of social dynamics, which increase the proportion of organic farmers and are particularly sensitive to the distribution of the farm characteristics. To understand this increase, it is necessary to remember that the quota is the initial level of milk production for conventional farms, as well as the maximum possible milk production for a farm. The productions of two farms define the credibility their farmers attribute to each other. Consequently, different distributions of quotas in a region, even if implying the same level of conversion computed on the basis of each farm's characteristics independently, can lead to different adoption rates due simply to different relationships in terms of credibility.
Regarding the three types of quotas presented in Figure 6, we can note in particular that:
- Although the adoption rate of canton 2521 is different from that of canton 2515 and canton 2504 at time 2010, their adoption rates are similar at time 0 (deduced only from the farm characteristics).
- Similarly, the adoption rate of canton 4229 is different from that of canton 1520 and canton 2508 at time 2010.
- Also, as in Figure 5d, we see that the adoption rate of canton 1512 is different from those of canton 4230 and canton 2517 at time 2030.
To illustrate the complexity of our model in more detail, and more particularly that of the social dynamics in the model which lead to such sensitivity to local distributions of farm characteristics, we investigate in Appendix B why the cantons with codes 1512 (Murat in Cantal), 1515 (Riom-ès-Montagnes in Cantal) and 2517 (Mouthe in Doubs) vary in their organic farming adoption rates.
Comparison to “real” adoption rates
The first subsection compares our average results with the adoption rates given by the FAGC in 2010 (this is the last available Census). They are different, but not by very much. However, such a comparison is irrelevant given the fact that farm characteristics (which are dynamic over time) are the main drivers of conversion, as we discuss in the second section.
Comparison of the adoption rates between the simulated results and the real data
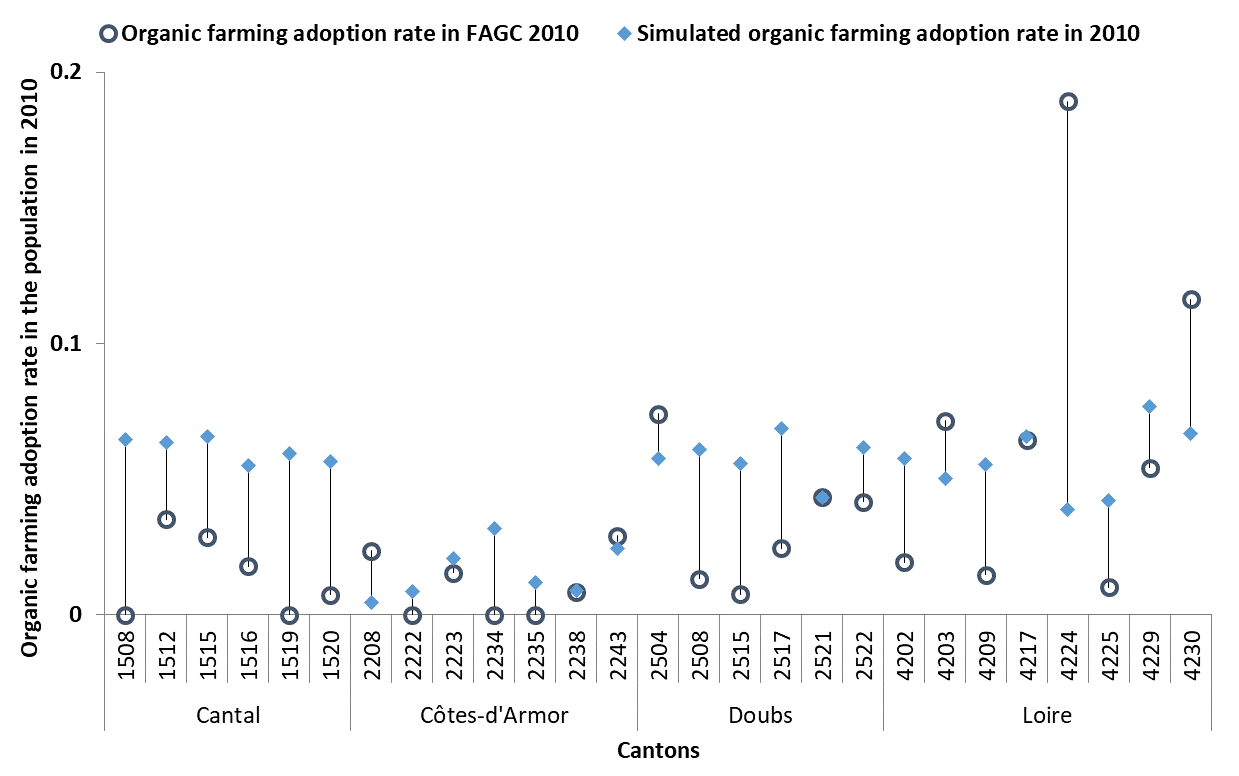
Figure 7 shows that the simulated adoption rates are relatively similar to the adoption rates from the FAGC. The proportion of organic farmers is small in the real and the simulated populations. The “département” of Côtes-d’Armor (cantons with a code beginning with 22) has fewer organic farmers than the other "départements” in both the simulations and the FAGC. Canton 4224 has the largest prediction error. However, we know from a use case survey and various interviews conducted in this canton that an unusual and forceful joint institutional action by the local Agricultural Office and the Dairy cooperative was launched in 2000 in order to support conversions to organic farming. Such an action has not been modelled in our approach. Its high impact on the adoption rate cannot therefore be reproduced by our model. Globally, this comparison tends to confirm the interest of our model as a tool for understanding the importance of social dynamics in the change process. However, it should be noted that we choose not to calibrate the model but simply to look at the average results over the 81 studied parameter sets and their replicated simulations for each canton. It is to be expected that selecting the best parameter sets would provide much better results. However, as suggested in the next section, the practical interest of this exercise is limited unless we also take account of the decrease in the number of farms during the last years.
Evolution of farm characteristics
Our model lacks important elements such as institutional actions or milk price crises. However, probably the most serious omission is the absence of farm and farmer demographics. Indeed, the total number of dairy farms in France has fallen considerably: from 156,222 in 1996, to 109,822 in 2005, 83,700 in 2010, and 58,000 in 2016. For the “départements” we are interested in this paper, it should be noted that, from 2000 to 2010, the number of dairy farms decreased by 27% in Cantal (15), 31% in Côtes-d’Armor (22), 19\% in Doubs (25) and 38% in Loire (42). Regarding our 27 cantons, Figure \ref{fig:8} shows the decrease in average UAA by farm between 2000 and 2010 (on the left), and the relative decrease in the number of farms (on the right). Data on the evolution of quotas are not available at the local level but, due to changes in European regulations, quotas have increased everywhere in France (Depeyrot 2017; Perrot & Cébron 2013; Ennifar & Allain 2016): from about 180,000 litres of milk per farm on average in 2000 to about 300,000 litres of milk per farm on average in 2010.
This increase has greatly changed farm characteristics as it is mainly small farms which have disappeared. The agricultural surface areas and the quotas of farms that have disappeared have been redistributed over the other farms, which are now larger and have larger quotas. Consequently, given that it is generally agreed that farm characteristics have a great impact on the adoption rate, these significant changes make the adoption rate data quite difficult to compare with our results (which consider farm characteristics to be constant over time).
Since UAA, and probably the number of cows, have changed in farms, the similarity network, which we consider as constant in our work, is in fact significantly evolving. As a consequence, the credibility network also probably evolves in a more complex way than it does in the model.
Conclusions
In Xu et al. (2018), we proposed an agent-based model that implements hypotheses concerning the social and psychological processes that are involved in the conversion of conventional farmers to organic farming. This model assumes that farmers introduce minor changes by imitating the processes of similar credible others, and make major changes as a result of a deeper social and psychological process. The first study using the model was conducted on simple theoretical populations consisting of three types of farms: small, medium and large. The excessive simplicity of such populations is a considerable limitation which affects the social dynamics taking place during the conversion process. Therefore, to overcome these limitations, we now present a second study using more highly elaborated models of dairy farms from 27 French “cantons”, derived from the data of the French Agricultural General Censuses (FAGC) 2000. Our work was intended to achieve two aims:
- Adapt the agent-based model to these more highly elaborated farm models;
- Analyse the respective roles of farm characteristics and social processes in the simulated conversions to organic farming.
Minor changes in the agent-based model for integrating more highly elaborated dairy farm models
A few changes were necessary to the agent-based model. In particular, compared to the first model, we had to introduce a difference between the farmer and his/her farm. A farmer has a performance which is dependent on his/her strategy (conventional or organic) and the farm characteristics (surface area and number of cows). This performance represents the practices that the farmer has chosen and, in particular, farming intensity. Farmers try to copy the performances (implicitly the practices) of credible farmers having similar farms.
A farm has a level of milk production which depends on the farm characteristics UAA, utilized agricultural area, the number of dairy cows and the quota) and the farming strategy. This milk production, as well as the environmental production, are criteria that make it possible to define the credibility that farmers attribute to one another, while also taking account of the relative importance a farmer places on each type of production. This credibility has a daily influence on performances, as well as on farmers' satisfaction with the various strategies. We have also added the notion of similarity between farms, based on their characteristics, so that farmers can choose an appropriate source of information in order to define performances (i.e. the practices) and the strategy they want.
Thus, a farmer's performance and the production on his/her farm are different, but are both linked to the characteristics of the farm.
Moreover, the farm models are based on simple and original models built from the data and literature relating to the calculation of: (1) the difference in milk production between conventional and organic farming; (2) the environmental impact of a level of milk production in organic farming and conventional farming.
Analysis of the simulation results
In general, final adoption rates depend to a great extent on farm characteristics. However, social dynamics and farm characteristics can have a strong interaction effect on adoption rates.
Indeed, small farms with low milk production and high environmental production convert more than others. This result is in line with Bos et al. (2013); Groeneveld et al. (2016) who argue that large farms intensify more than small farms, and are less likely to convert.
However, adoption can be impeded or favoured by the social dynamics of interacting farms. The imitation of minor changes favours adoption since it reduces farming intensity (due to the fact that the quota, or maximum possible milk production, of each farm is constant over the simulation).
The process of searching for information to assess the potential satisfaction of organic farming initially tends to impede adoption. Indeed, compared to the institutional information obtained from the media when there is no similar farm as a source of information, the information delivered by similar farmers who have already converted is generally less favourable. These first adopters are often the least intensive and therefore exhibit low milk production in organic farming. There is therefore a large negative difference in satisfaction between them (who place considerable importance on environmental production) and farmers who place greater importance on milk production than environmental production.
In cases where it increases, conversion to organic farming is generally accompanied by an increase in the importance attributed to environmental production compared to milk production in the definition of credibility. This increases the credibility and influence of organic farmers. It is thus possible to observe highly positive local effects of social dynamics on conversion.
In the model, the quota — i.e. the right to produce milk — represents the initial milk production level for conventional farms and also the maximum possible production for the farm. The actual milk production level defines credibility and determines the different quotas applied in a region and this can lead to different organic farming adoption rates. Similarly, the similarity network is sensitive to the local distribution of farm characteristics and can affect adoption. Indeed, the “cantons” with larger farms, which are generally more intensive, tend to convert less. This is the case, in the simulations and in the FAGC, of Côtes-d’Armor compared to less intensive "départements" located in more mountainous areas, such as Cantal or Loire.
Overall, we conclude that farmers can change their practices in ways that reflect their interest in adopting organic farming. However, they can also change their practices without adopting. These two possible avenues of development are consistent with (Sutherland et al. 2012; Sutherland 2011) and depend on the distribution of farm types within the population. They are also due to constraints in terms of production level, as the agronomic characteristics of the soil and/or regions, the size of the farm and the quota all limit the possible production.
Limitations and avenues for further studies
The greatest limitation in our work is the lack of demographic information about farmers and their farms in the model. Indeed French dairy farming has undergone many transformations in recent decades. Farm numbers as well as their characteristics in terms of surface area and possible maximum milk production have changed greatly due to economic crises and regulatory changes. In line with the academic literature, we have found that farm characteristics are the main drivers of the conversion to organic farming. We have also shown that the social dynamics of farmers, which are not independent of these characteristics, are also important for conversion. These social dynamics, based on relations of similarity and credibility among farmers, are very sensitive to local distributions of farm characteristics which impact these relations. Temporal evolutions in farm characteristics modify the similarity and credibility networks and can therefore significantly affect the dynamics of conversion. Furthermore, other factors which are more subjective than those we took into account can greatly influence the way individuals develop. These are mainly psychological characteristics such as "fellowship", "sympathy" or "familiarity".
This work shows that farm characteristics are very important in the social interactions between farmers at a local level. Therefore, changes in farm characteristics in a region have to be taken into account and better understood if we are to clarify the social aspects of farmers' decision-making processes. The irrational subjective psychological characteristics of agents should also be considered in future studies.
Acknowledgements
We acknowledge funding from the Scientific Research Foundation of Jiangxi University of Science and Technology (Grant No.JXXJBS19012).Notes
- Until 2015, the quantity of milk that a farm was authorized to produce was regulated at European level. This quantity was called the quota. Since 2015, even if the quota no longer exists, there is still a quantity of milk to be produced and this is generally set out in a contract between the farmer and the dairy cooperative collecting the milk.
- According to the data found in the FAGC, the studied cantons had an average of 113 farmers. In the model, each population is initialized at 100 farmers. This makes it possible to compare the results for all cantons without considering the differences in population size. We can concentrate directly on the social dynamics and farm characteristics. If all cantons are not initialized with the same number of farmers, there may be some differences in results due to the differing population sizes.
Appendix
A. Average farm characteristics of each studied canton in 2000 (Source: FAGC 2000)
| Dépar tement | Name of the dépar tement | Canton (INSEE code) | Average UAA by farm (in hect ares) | Average quota Q by dairy farm (in liters) | Average number of Cows by dairy farm (NC) | Cow dairy farmers in 2000 | Part of small (Q < 133000) farms in 2000 | Part of medium (133000 ≤ Q < 257000) farms in 2000 | Part of large (Q ≥ 257000) farms in 2000 | Cow dairy farmers in 2010 | Percentage of organic dairy farmers in 2000 | Percentage of organic dairy farmers in 2010 | Decrease of the number of farms from 2000 to 2010 (in %) |
| 15 | Cantal | 1508 | 62 | 132789 | 32 | 124 | 0,59 | 0,36 | 0,05 | 96 | 0,0% | 0,0% | 23% |
| 1512 | 56 | 149445 | 32 | 85 | 0,56 | 0,41 | 0,03 | 57 | 0,0% | 3,5% | 33% | ||
| 1515 | 57 | 143776 | 33 | 59 | 0,53 | 0,44 | 0,03 | 35 | 1,7% | 2,9% | 41% | ||
| 1516 | 47 | 94603 | 27 | 171 | 0,81 | 0,18 | 0,01 | 112 | 0,6% | 1,8% | 35% | ||
| 1519 | 58 | 138832 | 32 | 172 | 0,56 | 0,36 | 0,08 | 132 | 0,0% | 0,0% | 23% | ||
| 1520 | 60 | 137221 | 33 | 171 | 0,53 | 0,43 | 0,04 | 137 | 0,0% | 0,7% | 20% | ||
| 22 | Côtes-d'Armor | 2208 | 47 | 229484 | 37 | 143 | 0,1 | 0,62 | 0,28 | 85 | 0,7% | 2,4% | 41% |
| 2222 | 42 | 205401 | 34 | 120 | 0,21 | 0,56 | 0,23 | 80 | 0,0% | 0,0% | 33% | ||
| 2223 | 66 | 251267 | 41 | 81 | 0,12 | 0,53 | 0,35 | 65 | 0,0% | 1,5% | 20% | ||
| 2234 | 44 | 184056 | 32 | 86 | 0,33 | 0,48 | 0,19 | 57 | 0,0% | 0,0% | 34% | ||
| 2235 | 53 | 269536 | 41 | 68 | 0,12 | 0,41 | 0,47 | 53 | 0,0% | 0,0% | 22% | ||
| 2238 | 37 | 192258 | 33 | 171 | 0,21 | 0,66 | 0,13 | 118 | 0,0% | 0,8% | 31% | ||
| 2243 | 63 | 233919 | 40 | 96 | 0,17 | 0,5 | 0,33 | 69 | 0,0% | 2,9% | 28% | ||
| 25 | Doubs | 2504 | 75 | 177262 | 36 | 100 | 0,29 | 0,61 | 0,1 | 81 | 2,0% | 7,4% | 19% |
| 2508 | 78 | 186737 | 38 | 93 | 0,27 | 0,56 | 0,17 | 76 | 1,1% | 1,3% | 18% | ||
| 2515 | 67 | 168056 | 34 | 164 | 0,36 | 0,51 | 0,13 | 134 | 3,7% | 0,7% | 18% | ||
| 2517 | 77 | 184060 | 39 | 102 | 0,29 | 0,54 | 0,17 | 82 | 2,0% | 2,4% | 20% | ||
| 2521 | 55 | 137083 | 30 | 62 | 0,45 | 0,51 | 0,04 | 46 | 0,0% | 4,3% | 26% | ||
| 2522 | 76 | 179341 | 35 | 87 | 0,31 | 0,57 | 0,12 | 72 | 2,3% | 4,2% | 17% | ||
| 42 | Loire | 4202 | 53 | 154661 | 29 | 78 | 0,44 | 0,44 | 0,12 | 52 | 0,0% | 1,9% | 33% |
| 4203 | 38 | 99173 | 22 | 76 | 0,74 | 0,23 | 0,03 | 42 | 0,0% | 7,1% | 45% | ||
| 4209 | 46 | 121498 | 26 | 106 | 0,67 | 0,28 | 0,05 | 68 | 0,0% | 1,5% | 36% | ||
| 4217 | 56 | 140738 | 31 | 98 | 0,53 | 0,38 | 0,09 | 62 | 0,0% | 6,5% | 37% | ||
| 4224 | 46 | 145923 | 30 | 98 | 0,43 | 0,54 | 0,03 | 74 | 9,2% | 18,9% | 24% | ||
| 4225 | 37 | 102176 | 21 | 154 | 0,79 | 0,18 | 0,03 | 100 | 0,0% | 1,0% | 35% | ||
| 4229 | 44 | 105128 | 24 | 87 | 0,67 | 0,27 | 0,06 | 37 | 0,0% | 5,4% | 57% | ||
| 4230 | 53 | 117857 | 27 | 73 | 0,61 | 0,36 | 0,03 | 43 | 0,0% | 11,6% | 41% |
B. Illustration of the complexity of social dynamics
To illustrate the complexity of our model, and more particularly that of its social dynamics, which results in so great a level of sensitivity to the local distribution of farm characteristics, we investigate in this Appendix why the cantons with codes 1512 (Murat in Cantal), 1515 (Riom-ès-Montagnes in Cantal) and 2517 (Mouthe in Doubs) vary in their proportion of organic farmers. They have a similar virtual adoption rate at time 0. At time 29, Riom-ès-Montagnes and Mouthe still have a similar final adoption rate, while the adoption rate in Murat is much higher than in the other “cantons”.
The three “cantons” are initially described on the basis of various aspects: (1) farm characteristics of each “canton”; (2) temporal adoption rates of different farm types in each “canton”; (3) distribution of individual trajectories towards alternative practice in each “canton”. The following three sections explain why these three cantons evolve in different ways.
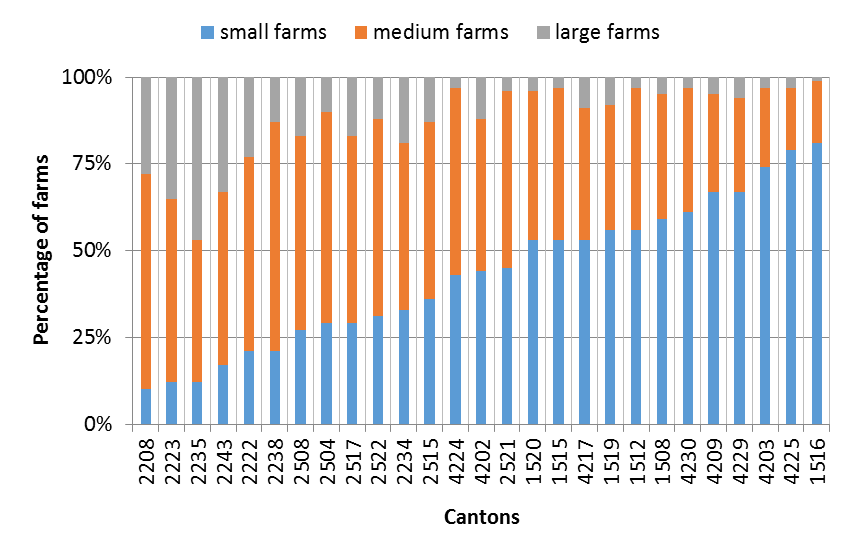
Farm characteristics of each “canton” from RGA
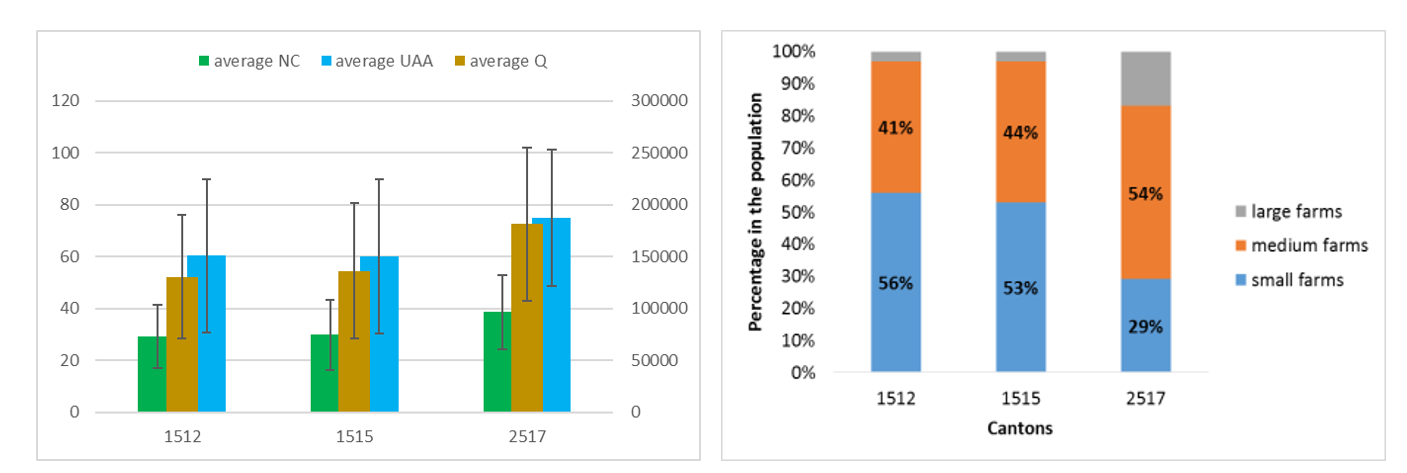
As shown in Xu et al. (2018), farms that differ in terms of their quotas have quite different behaviours. Three farm types are classified for the following behavioural analysis depending on each farm’s quota (Q). Farms with a Q less than 133,000 litres are considered as small farms, farms with a Q between 133,000 and 257,000 litres are categorized as medium farms, and those with more than 257,000 litres are considered to be large farms. As shown in Figure 10, “cantons” 1512 (Murat) and 1515 (Riom-ès-Montagnes) are similar in terms of their farm characteristics and type distributions, while 2517 (Mouthe) is quite different from the others.
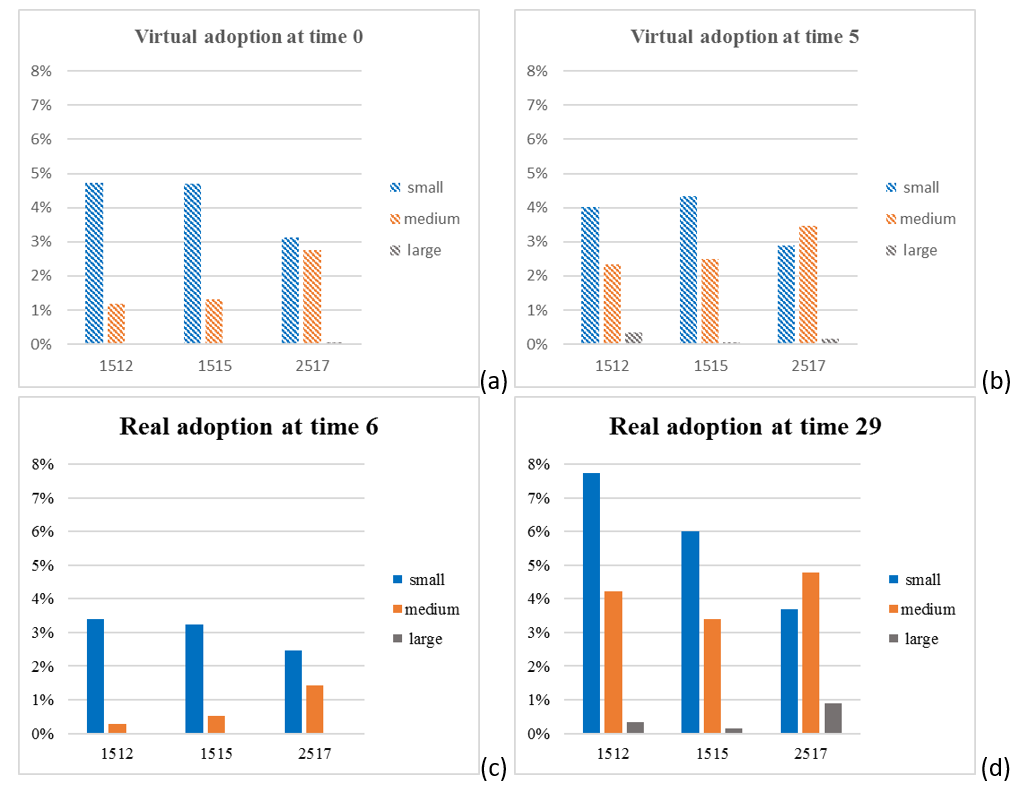
Temporal adoption rates for each farm type in each “canton”
Figure 10 shows the average virtual/real adoption rates for each farm type in each ``canton'' at times 0, 5, 6 and 29 (averaged over the 81 parameter sets and their replications). In general, small farms tend to convert the most (even if this is not true for Mouthe (2517), where they are a minority). Large farms convert the least in all cases.
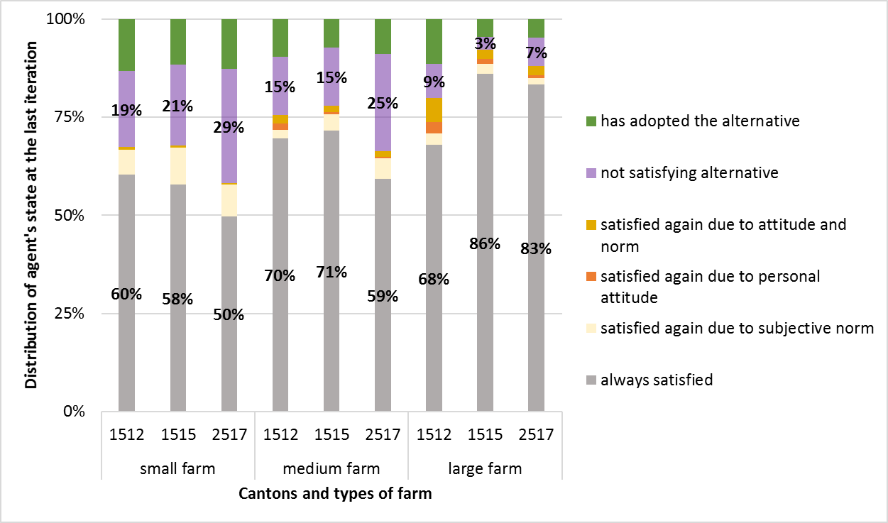
Distribution of agents’ typical trajectories regarding the decision states
Figure 12 shows the average distribution over the 81 parameter sets of agents' states for each farm type in each ``canton''. It indicates how agents reach their decisions. All bars, except the green bars representing ``has adopted the alternative'', lead to the non-adoption of organic farming. The reasons for their decisions are presented in Sections 2.45-2.52, and are discussed in more detail in Xu et al. (2018).
To better understand the various evolutions of our three “cantons”, the following sections compare them in more detail.
Comparison between Murat and Riom-ès-Montagnes.
The “cantons” Murat and Riom-ès-Montagnes have similar characteristics and they also have a similar initial adoption rate (times 0, 5 and 6), whereas the rates differ at the end of the simulation (time 29). We also compare them at the level of the following detailed characteristics:
- Similar average basic characteristics (Figure 10a), slightly more small farms (56%) in Murat compared to Riom-ès-Montagnes (53%) (Figure 10b);
- Similar initial virtual adoption rate (Figure 11a), higher final adoption rate in Murat than Riom-ès-Montagnes, in particular in the case of small farms (Figure 11d);
- Small farms in Murat have fewer “dissatisfied alternative” and “satisfied again” outcomes for whatever reason than in Riom-ès-Montagnes; Murat’s medium and large farms are less frequently “always satisfied” than those in Riom-ès-Montagnes (Figure 12).
Compared with Riom-ès-Montagnes, Murat has more small farms that cannot increase their total productions due to their maximum possible productions (i.e. their quota). Consequently, the performances of Murat’s other farms are more influenced through the imitation process (Equation 15). As performance evolves, the difference in total production between small farms and large ones decreases. Small farms can be attributed greater credibility by larger farms but attribute them reduced credibility in return. As a result, small farms can influence even much larger ones. This process allows small farms to gain an ever increasing social evaluation (subjective norm) from the larger ones.
If the number of small farms is smaller, as in the Riom-ès-Montagnes, small farms are less able to influence large farms’ performances. As a result, small farms may have a poorer social evaluation than in Murat (purple circles in Figure 13).
This poorer social evaluation explains the smaller proportion of small farms that are “always satisfied” with the current situation in Riom-ès-Montagnes (grey bars in Figure 12). It also explains why Murat’s small farms have fewer “dissatisfied alternative” farms (purple bars in Figure 12), since the subjective norm is similar whatever the evaluated strategy. Having lower negative subjective norms, it is easier for satisfaction with the alternative, compared to satisfaction with the current situation, to increase in small farms in Murat by more than TO (threshold above which the farm changes to an alternative). Such an increase before the agent returns to “satisfied again” implies satisfaction and the adoption of an alternative strategy. Small farms in Murat therefore convert more than in Riom-ès-Montagnes.
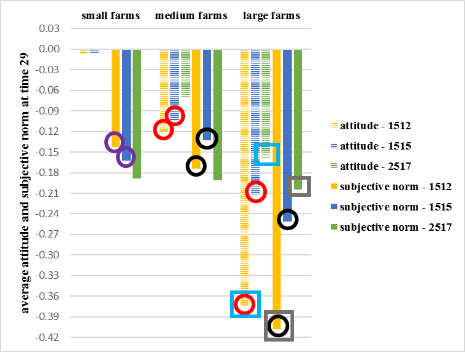
Medium and large farms in Murat also adopt more than in Riom-ès-Montagnes. This is due to the same mechanism. Being more influenced by small farms, Murat’s larger farms reduce their intensive practices. This leads them to a lower subjective norm (black circles in Figure 13) and a lower personal attitude (red circles in Figure 13), thus making them dissatisfied. By contrast, Riom-ès-Montagnes’s medium and large farms, which are less influenced by small ones, evaluate the current situation more positively. This causes them to be satisfied and not to consider an alternative.
Comparison between Riom-ès-Montagnes and Mouthe
Although the “cantons” Riom-ès-Montagnes and Mouthe have different farm characteristics and different initial adoption rates for each farm type, they have similar conversion rates at the end of the simulation. We also compare them at the level of the following detailed characteristics:
- Mouthe has a larger number of dairy cows (NC), more utilized agricultural area (UAA), a higher quota (Q) and is more intensive (UAA/Q) than Riom-ès-Montagnes (Figure 10a). Nearly half of all farms in Mouthe are small, while Riom-ès-Montagnes has many more medium and large farms (Figure 10b).
- The global virtual/real adoption rates are similar in both cantons at times 0 and 29. In fact, there are more small adopters in Riom-ès-Montagnes, while there are more medium and large adopters in Mouthe (Figure 11).
- They have similar conversion rates per farm type (green bars in Figure 12).
Despite having different farm characteristics and different adoption rates for each farm type, these “cantons” have similar total adoption rates due to the differences in farm type distributions (Figure 10b).
According to the farm type distribution shown in Figure 1b, Riom-ès-Montagnes has more small farms, but fewer medium and large farms than Mouthe. With their similar adoption rates in each farm type, they can have different adopters in each type. However, they can also have similar global adoption rates.
Comparison between Murat and Mouthe
Having different characteristics, the “cantons” Murat and Mouthe have similar virtual adoption rates at time 0, but different adoption rates at the end of the simulation. We also perform the following comparisons:
- Mouthe has a larger number of dairy cows (NC), more utilized agricultural area (UAA), a higher quota (Q) and is more intensive (UAA/Q) than Murat (Figure 10a). Nearly half of all farms in Mouthe are small, while Murat has many more medium and large farms (Figure 10b).
- The global virtual adoption rates are similar in both cantons at time 0, while Murat has a much higher conversion level than Mouthe at time 29. Regarding each farm type, Mouthe has fewer small farm adopters, and more medium and large adopters (Figure 11).
- In each farm type, small and medium farms have similar adoption rates, while large farms in Murat have a higher adoption rate and are less frequently “always satisfied” than those in Mouthe (green and grey bars in Figure 12).
The dynamics of Murat when compared to Mouthe are similar to those of Riom-ès-Montagnes when compared to Mouthe. The differences between the adoption rates are mainly explained by the influence of small farms, which are even more numerous in Riom-ès-Montagnes than in Murat (Figure 10b, 56 % in Riom-ès-Montagnes versus 53 % in Murat and only 29 % in Mouthe).
Another difference, which does not appear in the comparison between Riom-ès-Montagnes and Mouthe, relates to the dynamics involved in the decisions made by large farms (Figure 12). Much more influenced by smaller farms, the performance of large farms in Murat is reduced for longer and their farmers have a less positive personal attitude than those in Mouthe (blue squares in Figure 13). In addition, compared to large farms in Mouthe, those in Murat have a poorer subjective norm due to the loss of total production superiority (grey squares in Figure 13). As a result, large farms in Murat are more frequently dissatisfied with the current situation and have a higher adoption rate than those in Mouthe.
References
BARBIER, C., Cerf, M. & Lusson, J.-M. (2015). Cours de vie d’agriculteurs allant vers l’économie en intrants: les plaisirs associés aux changements de pratiques. Activités, 12(2), 2.
BOS, J. F., Smit, A. B. L. & Schröder, J. J. (2013). Is agricultural intensification in the Netherlands running up to its limits? NJAS - Wageningen Journal of Life Sciences, 66, 65–73.
BURTON, M., Rigby, D. & Young, T. (2003). Modelling the adoption of organic horticultural technology in the UK using duration analysis. Australian Journal of Agricultural and Resource Economics, 47(1), 29–54.
BURTON, R. J. & Wilson, G. A. (2006). Injecting social psychology theory into conceptualisations of agricultural agency: Towards a post-productivist farmer self-identity? Journal of Rural Studies, 22(1), 95–115.
CENTOLA, D. (2015). The social origins of networks and diffusion. American Journal of Sociology, 120(5), 1295–1338.
CHAMBAUT, H., Moussel, E., Pavie, J., Coutard, J. P., Galisson, B., Fiorelli, J.-L. & Leroyer, J. (2011). Profils environ-nementaux des exploitations d’élevage bovins lait et viande en agriculture biologique et conventionnelle: Enseignements du projet CedABio. Rencontres autour des Recherches sur les Ruminants, 8, 53–56.
DARNHOFER, I., Schneeberger, W. & Freyer, B. (2005). Converting or not converting to organic farming in Austria: Farmer types and their rationale. Agriculture and Human Values, 22(1), 39–52.
DARRÉ, J.-P. (1985). La parole et la technique: L’univers de pensée des éleveurs du ternois. Vol. 10. Paris: L’Harmattan.
DE BUCK, A. J., Van Rijn, I., Roling, N. G. & Wossink, G. A. A. (2001). Farmers’ reasons for changing or not changing to more sustainable practices: An exploratory study of arable farming in the Netherlands. The Journal of Agricultural Education and Extension, 7(3), 153–166.
DEDIEU, M.-S., Lorge, A., Louveau, O. & Marcus, V. (2017). Les exploitations an agriculture biologique: Quelles performances économiques? Insee Références, édition 2017.
DEPEYROT, J.-N. (2017). Les transformations du paysage laitier français avant la sortie des quotas. Centre d’Études et de Prospective, 108.
DOWD, A.-M., Marshall, N., Fleming, A., Jakku, E., Gaillard, E. & Howden, M. (2014). The role of networks in transforming Australian agriculture. Nature Climate Change, 4(7), 558–563.
ENNIFAR, M. & Allain, E. (2016). Evolution des structures de production laitière en France. United Nations High Commissioner for Refugees. FranceAgriMer.
FAIRWEATHER, J. R., Hunt, L. M., Rosin, C. J. & Campbell, H. R. (2009). Are conventional farmers conventional? Analysis of the environmental orientations of conventional New Zealand farmers. Rural Sociology, 74(3), 430–454.
FISHBEIN, M. & Ajzen, I. (1977). Belief, Attitude, Intention, and Behavior: An Introduction to Theory and Research. Reading, MA: Addison-Wesley.
GOLDSTONE, R. L. & Janssen, M. A. (2005). Computational models of collective behavior. Trends in Cognitive Sciences,9(9), 424-430.
GRIMM, V. (1999). Ten years of individual-based modelling in ecology: What have we learned and what could we learn in the future? Ecological Modelling, 115(2-3), 129-148.
GROENEVELD, A., Peerlings, J., Bakker, M. & Heijman, W. (2016). The effect of milk quota abolishment on farm intensity: Shifts and stability. NJAS - Wageningen Journal of Life Sciences, 77, 25-37.
HUET, S., Rigolot, C., Xu, Q., de Cacqueray-Valmenier, Y. & Boisdon, I. (2018). Toward modelling of transformational change processes in farm decision-making. Agricultural Sciences, 9(3), 340–350.
KAUFMANN, P., Stagl, S. & Franks, D. W. (2009). Simulating the diffusion of organic farming practices in two new EU member states. Ecological Economics, 68(10), 2580-2593.
KERSELAERS, E., De Cock, L., Lauwers, L. & Van Huylenbroeck, G. (2007). Modelling farm-level economic potential for conversion to organic farming. Agricultural Systems, 94(3), 671-682.
LAMINE, C. & Bellon, S. (2009). Conversion to organic farming: A multidimensional research object at the cross-roads of agricultural and social sciences. A review. Agronomy for Sustainable Development, 29(1), 97-112.
LATRUFFE, L., Nauges, C. & Desjeux, Y. (2013). Le rôle des facteurs économiques dans la décision de conversion à l’agriculture biologique. Innovations Agronomiques, 32, 259–269.
MINTZBERG, H., Raisinghani, D. & Theoret, A. (1976). The structure of “unstructured” decision processes. Administrative Science Quarterly, 21(2), 246–275.
MZOUGHI, N. (2011). Farmers adoption of integrated crop protection and organic farming: Do moral and social concerns matter? Ecological Economics, 70(8), 1536-1545.
NEUMEISTER, D., Fourdin, S. & Dockes, A.-C. (2011). Etude des freins et motivations des éleveurs laitiers au passage en agriculture biologique dans les zones de Piémont et de montagne. Rencontres autour des Recherches sur les Ruminants, 18.
ÖHLMÉR, B., Olson, K. & Brehmer, B. (1998). Understanding farmers’ decision making processes and improving managerial assistance. Agricultural Economics, 18(3), 273-290.
PADEL, S. (2001). Conversion to organic farming: A typical example of the diffusion of an innovation? Sociologia Ruralis, 41(1), 40-61.
PAVIE, J., Chambaut, H., Moussel, E., Leroyer, J. & Simonin, V. (2012). Evaluations et comparaisons des per-formances environnementales, économiques et sociales des systèmes bovins biologiques et conventionnels dans le cadre du projet CedABio. Renc. Rech. Ruminants, 19, 37-40.
PAVIE, J., Dockès, A.-C. & Echevarria, L. (2002). Étude des freins à la conversion à l’agriculture biologique des exploitations laitières bovines. Paris Cedex 12: Institut de l’Elevage.
PERROT, C. & Cébron, D. (2013). Les exploitations laitières bovines en France Métropolitaine — Des territoires laitiers contrastés. Agreste Primeur, 308, 7-10.
RICKARDS, L. & Howden, S. M. (2012). Transformational adaptation: Agriculture and climate change. Crop and Pasture Science, 63(3), 240-250.
RIGBY, D., Young, T. & Burton, M. (2001). The development of and prospects for organic farming in the UK. Food Policy, 26(6), 599–613.
ROGERS, E. (1983). Diffusion of Innovations. 3rd Ed.. New York, NY: Free Press.
SAINTE-BEUVE, J., Bougherara, D. & Latruffe, L. (2011). Performance économique des exploitations bi-ologiques et conventionnelles: Levier économique à la conversion. Présentation au Colloque SFER/RMT DévAB/Laboratoire Cultures et sociétés en Europe “Les transversalités de l’agriculture biologique”, Strasbourg (Université Marc Bloch), 23-24 June 2011.
STOCK, P. V. (2007). ‘Good farmers’ as reflexive producers: An examination of family organic farmers in the US Midwest. Sociologia Ruralis, 47(2), 83–102.
SUTHERLAND, L.-A. (2011). “Effectively organic”: Environmental gains on conventional farms through the market? Land Use Policy, 28(4), 815–824.
SUTHERLAND, L.-A. (2013). Can organic farmers be ‘good farmers’? Adding the ‘taste of necessity’ to the conventionalization debate. Agriculture and Human Values, 30(3), 429–441.
SUTHERLAND, L.-A. Burton, R., Ingram, J. Blackstock, K, Slee, B., Gotts, N. (2012). Triggering change: Towards a conceptualisation of major change processes in farm decision-making. Journal of Environmental Management, 104, 142-151.
SUTHERLAND, L.-A. & Darnhofer, I. (2012). Of organic farmers and ‘good farmers’: Changing habitus in rural England. Journal of Rural Studies, 28(3), 232–240.
XU, Q., Huet, S., Poix, C., Boisdon, I. & Deffuant, G. (2018). Why do farmers not convert to organic farming? Modeling conversion to organic farming as a major change. Natural Resource Modeling, 31(3), e12171.