
Introduction
Human colonization processes are a common research topic in disciplines such as archaeology and population genetics that study social human evolution in our past. Studies of colonization processes in past human societies often use a standard population model in which population is represented as a single class of agents that often exhibits highly mobility without strong spatial constraints (Barton et al. 2004; Jochim 2009; Winterhalder et al. 2010). However, real populations during colonization processes are often structured with internal classes or stages based on age or other natural phases (Briggs et al. 2010; Hey & Machado 2003), and classes are sometimes created based on social differentiation (Rockman & Steele 2003; Stein 1999). In this paper we model a colonization process with a socially-differentiated population in order to provide insights about how the sum of individual preferences and the internal diversity of populations shape human colonization processes. This approach could be used to analyze past human colonization events or support long-term conceptual design of future human colonization processes with small social formations into unfamiliar and uninhabited environments (Billingham et al. 1979; Smith & Davies 2012).
In the work herein, a case study of the European colonization of the Americas was used as input data to model how structured human populations colonize a broad range of environments. After the arrival of Columbus, Europeans controlled communities and territories of Amerindian societies but also occupied new and unfamiliar landscapes through processes of exploration, migration, and colonization. These processes were undertaken by hierarchically-organized, slave-based, sedentary, and small populations, that stemmed from demographically larger societies with original settlements located in Old World environments. Europeans and enslaved Africans found in the Americas a landscape full of unfamiliar and heterogeneous environments, in which their social conditions and available communication and transportation technologies inhibited immediate interactions with their origins.
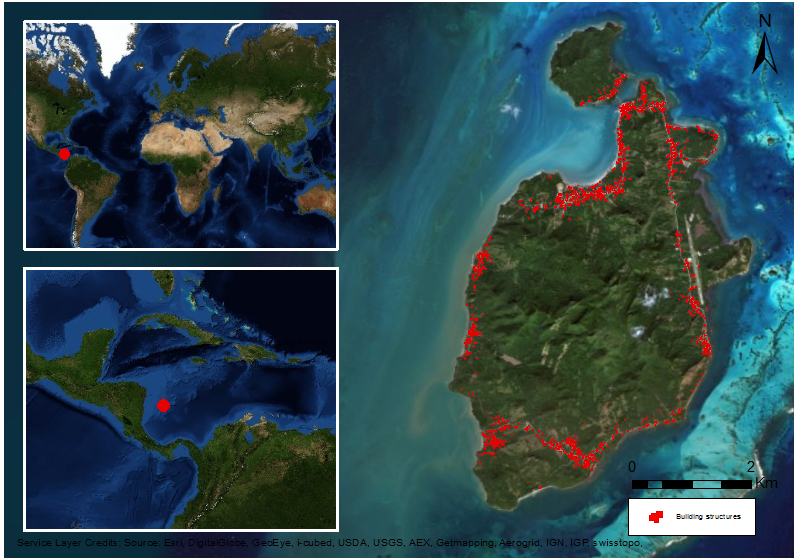
The colonization of Old Providence Island represents one of these cases. Old Providence Island is about 240 km East of the Nicaraguan coast, and 630 km Southwest of Jamaica (Newton 1914; Ordahl 1993; Parsons 1985) (Figure 1). The events that occurred during colonial times in Old Providence Island provide us an opportunity to explore fundamental questions about how humans interact in heterogeneous environments. In this paper, a colonization process was modeled based on information about the colonization of Old Providence Island using agent-based model techniques. Agents were socially differentiated and modeled with dissimilar spatial clustering preferences. The purpose was to evaluate the importance of gregarious behavior when structured human populations with different preferences about group organization colonize a new heterogeneous environment.
The model and simulations were not designed to accurately account for the demographic changes and past land use of Old Providence Island. Instead, we aimed to build what Gilbert calls a middle-range model (Gilbert 2008). We were interested in exploring how the spatial distribution of agents changes with different degrees of independence or interdependence when involved in a colonization endeavor. Independence and interdependence are expected to have an effect on spatial distribution since they often require some degree of face-to-face interaction (Drennan & Peterson 2006). Therefore, minimizing or maximizing spatial distance is the most common strategy that humans use to manage costs and benefits of interaction (Drennan 1988). Agent-based models can provide a digital representation of populations with internal differences in preference for frequent peer interaction.
By means of an agent-based model, we simulated a continuum of scenarios between two extremes: one representing a society with a large proportion of independent agents, and the other a society with agents prone to being more interdependent. Agent gregariousness was taken as proxy for interdependence; agents prone to be interdependent were defined as more gregarious while more independent agents were assumed as less gregarious. Scenarios were run in a digital representation of the island’s environment.
The environmental variability and occupation history of Old Providence Island were used as input data to model colonization dynamics. The digital environment was structured with a land classification of the island that used biotic and abiotic data with the aim of identifying areas that were more suitable for the first settlers (Fajardo & Rodríguez 2017). Social differentiation was included in the model using the behavioral component of the slavery process on the island. The earliest permanent settlements were built in the 17th century when English puritans were expanding in the Caribbean. The absence of Amerindians on the island since the beginning of the colonization process led Europeans to bring Africans as slaves. Regardless of the changes in territory control between Englishmen and Spaniards, the presence of Africans was a constant factor in the social organization of the island (Parsons 1985 pp. 33–35). An important aspect of the behavior of Africans on the island was that they marooned and sometimes even managed to escape from the island (Newton 1914 pp. 149–150). The voluntary preference to become marooned, namely withdrawing or reducing the possibility of interaction with other individuals by physical migration, was considered as a relevant feature of gregariousness and it was included in the model. This preference was also an important part of the historical context of the island. It highlights how dramatically segregated individuals reacted and decided to act based on their social conditions. Cultural studies underscore how African presence is now in every aspect of Caribbean societies and culture (Hall 2000). This characteristic suggests that despite their disadvantageous position, enslaved Africans played an active part in the construction of societies created in the Americas. The colonization process of Old Providence was managed by Europeans, but the resulting communities and patterns of social interaction were also shaped by African behavior. For these reasons, the colonization process is referred here as managed by Europeans although the resultant communities are understood as an Euro-African product.
Agent-based modeling in archaeology
Computer modeling and simulation in archaeology date back to the early 1970s and have explored several aspects of a wide range of societies. Readers can refer to Lake (2014), Barceló et al. (2000) and Grosman (2016) for how computer technologies changed the way archaeologists model, document, visualize, and analyze archaeological data. Recent works also discuss epistemological issues of agent-based computational modeling in archaeology (Saqalli & Van der Linden 2019; Wurzer et al. 2015). Lake (2014) highlights that some agent-based approaches with an archaeological scope can be classified as attempts to analyze long-term socio-ecological change as a complex adaptive system, and this is the approach presented here. This is also a topic actively studied in recent agent-based simulations (Lake 2014; Saqalli & Van der Linden 2019).
Complex adaptive system approaches in archaeology that work with agent-based simulations study different aspects of agent interactions and settlement systems of pre-industrial societies. These simulations usually develop models focused on understanding one particular long-term sequence of social change. For example, Kohler and collaborators have developed their model as a programmatic research about pre-European populations in the Mesa Verde region of Southwest Colorado. They started from a simple model that applied fixed agent decision-making rules to settlement locations (Kohler & Carr 1997). Today, their model has grown in complexity and contains algorithms for a decision-making process that includes cultural preferences, kin relations, and a changing environment (Kohler et al. 2007, 2012). Barton et al. (2016) have been studying agro-pastoralist eco-dynamics in the Mediterranean in order to answer questions about the sustainability of socio-ecological systems. Small bronze age communities from the Middle East have been studied with agent-based models and archaeological datasets that demonstrate resource gains from some household-like agents at the expense of others, producing more economically differentiated communities through time at the onset of urbanization (Wilkinson et al. 2007). Other recent evolutionary topics addressed by agent-based simulations have been the process of fission and fusion of settlements in pre-industrial societies (Crema 2014; Griffin & Stanish 2007), long-term anthropogenic effects on landscapes (Barton et al. 2015), and social cooperation within high risk environments (Clark & Crabtree 2015).
The examples above share an interest in long-term societal change; inclination toward environmental realism as a pivotal part of their model; explicit concern about human-environment interaction; model testing against archaeological and/or historic data; and increasing complexity built over an initial simple model. Although the model presented here shares similar interests in the analysis of long-term human complex systems, it follows a complementary approach. Environmental heterogeneity is included in the model without dynamics. Instead, the model focuses on parameters that represent different preferences of social interaction. Also, the analyses do not aim to explain a particular long-term sequence of social change but to explore how diversity in individual preferences about interaction could affect human clustering in a colonization process.
Aim of the study
The agent-based simulation was focused on modeling the variability between two simple “what if” scenarios. On one hand, a scenario where agents prefer to live in gregariousness near other similar agents. This was taken as a proxy for a population with preference for frequent interaction and dependence on each other (interdependent scenario). On the other hand, a scenario where the majority of agents preferred to live far from similar agents. This scenario represented a population with preference for self-sustainability and low daily interaction (independent scenario). The rationale behind this approach was to simulate the heterogeneity of spatial patterns, based on different preferences that agents in a given society could have in their attitudes towards living in proximity to others.
Input Data
Old Providence Island
Historians and archaeologists suggest that the Old Providence Island was not permanently occupied by human populations before 1629 CE, when The Old Providence Company established an English colony (Newton 1914; Offen 2008; Ordahl 1993; Rowland 1935). A few Dutchmen visited Old Providence before the establishment of the English settlements but they never settled. The English colony on the island was probably the first European-African community to interact with the Miskito population. These first encounters are inferred from toponymy in early European maps, early development of Amerindian-African societies on Miskito cays, and from use of some Miskito terms by puritan colonizers on Old Providence (Offen 2011). Although contact with indigenous communities did occur, it was not based on daily interactions and occurred infrequently on the Island. The Miskito population probably visited the island but never settled (Nietschmann 1995; Offen 2008; Vollmer 1997). Archaeological data indicate that Miskito groups were located around 240 km west of Old Providence Island, along the Caribbean coast of modern Nicaragua and Honduras (Balladares 2013; Clemente-Conte & Gassiot Ballbè 2004, 2015; Tous i Mata 2002). The earliest Miskito occupation in the Nicaraguan coast has been dated to \(1120 \pm 60\) BCE, while hierarchically organized Miskito communities could have existed since at least 1150-1400 cal. CE (Clemente-Conte & Gassiot Ballbè 2004 pp. 112–119). Archaeological evidence of Miskito occupation in Old Providence Island has not been reported in any of the archaeological studies conducted to date (Fajardo & Rodríguez 2017; Londoño 2014; Mayfield 2019; Romero 2013). When Amerindian-European-African dynamics in the Caribbean started, Old Providence Island functioned as an uninhabited territory not only for European-African communities but also for Amerindian populations.
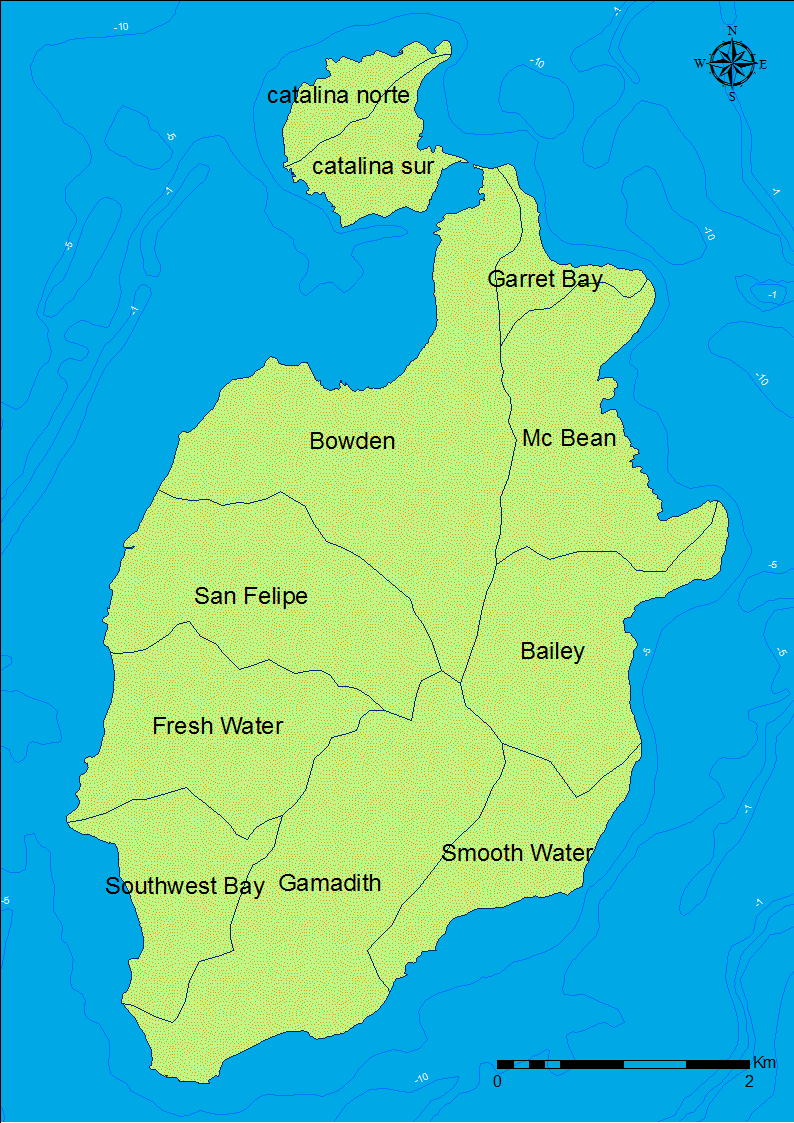
By the year 1635 CE, 500 Englishmen, 40 women with some children, and 90 slaves were living on Old Providence Island. This population was divided in two types of settlements: one small nucleated settlement, and several dispersed farmsteads. The small nucleated settlement was named New Westminster and it was located in the Bowden area (Figure 2, northwest of the island). New Westminster only had 30 houses, a church and the governor’s house (Newton 1914 pp. 87–152), while the rest (most) of the population lived outside of New Westminster in dispersed farmsteads. The enslaved African population was introduced in 1633 CE. Some Africans managed to escape from landlords and established shelters in forest areas, especially in the southeast part of the island. These shelters were burned down by Europeans at least two or three times, which dispersed the African population into the forest (Newton 1914 p. 151). Historical documents indicate that the puritan company hierarchy was divided by status differences in at least three tiers, and each tier had differential access to agricultural land. Around 1636, governor Robert Hunt received 100 acres of land to farm, whereas men with only moderately high status obtained 50 acres, and men with the lowest rank received 30 acres (Newton 1914 pp. 216–223) (Table 1).
The colonial history of Old Providence was always part of the conflict of colonial powers in the Caribbean Sea. The colonization was conducted by English puritans, and the Spanish crown reacted to this endeavor at least twice between 1641 and 1666 CE. During these two episodes, Spaniards brought English settlements and the African population on the island under their control (Parsons 1985; Rowland 1935). Historic records indicate that after 1670 CE Old Providence was uninhabited for almost sixty years. In the year of 1738 CE, there are references of the presence of new Englishmen on the near island of San Andres, but none about permanent occupation on Old Providence (Parsons 1985 p. 48). It is only in the year 1793 CE that a Spanish officer documented occupation on the island again. This was represented by only two families from San Andres Island that were living on Old Providence. No nationality or rank of these families is reported, but based on family names of population on San Andres Island, families in Old Providence probably stemmed from the initial Puritan settlements (Ramery de 1793 sheet 595). After that, in 1809 CE, Oneill reported about 250 people between free people and slaves living on the island (Oneill 1809 sheet 472). Oberto (1834 p. 25) indicated that in 1834 CE, about 500 people lived on Old Providence, of which about two thirds were slaves.
| Social Position | Description | Agricultural Land Received in Hectares |
|---|---|---|
| Highest rank | English governor | 40.5 |
| High rank Englishmen | 20.23 | |
| Low rank Englishmen | 12.14 | |
| Lowest rank | Runaways | 0 |
Suitability classification
Habitat suitability classification of Old Providence Island used biotic and abiotic data (Álvarez et al. 2014; CORALINA-INVEMAR 2012; Posada et al. 2011). Areas were classified according to their suitability for the type of communities that settled on the island in the past. The variables used to create the habitat suitability classification are presented in Table 2. It was assumed that early settlers preferred to locate their dwellings in areas with good agricultural land, abundant terrestrial resources, easy sea access to harbor, and fresh water availability. All variables were weighted as equally important. Each variable was transformed in a four level rank with higher values representing more suitable areas and smaller values representing less suitable areas. Original values of each variable and their assigned values are presented in Table 2. Drainage basin systems (Figure 2) were used to describe patterns observed in the graphic simulation outputs and input data.
Marine and terrestrial resources were included in the suitability classification. It was assumed that the most relevant land resource on the island was cultivable land. Areas located in alluvial fans with slight slopes and an average of 200-250 rainfall days per year were classified as best for agricultural practices. Other geomorphological units with conditions such as low stability or without watersheds were considered as areas with low suitability to establish dwelling structures or agricultural plots. Black crab (Gecarcinus ruricola) was included as the most important wild terrestrial resource. Today, presence of black crab is concentrated in the western forested areas. Based on a regional study of black crab distribution conducted in 2004 (CORALINA-INVEMAR 2012 p. 93), the highest value in the suitability rank was assigned to those basins with more than 200,000 individuals.
| Variable | Description | Variable Value | Assigned value |
|---|---|---|---|
| Geomorphological unit | Alluvial Fan | 4 | |
| Moderately inclined/dissected hills of denudative structural origin | 3 | ||
| Moderately inclined/dissected hills of denudative origin | 2 | ||
| Cliff | 1 | ||
| Colluvial deposit | 1 | ||
| Dejection cone | 1 | ||
| Residual hill | 1 | ||
| landslide | 1 | ||
| Storm deposits | 1 | ||
| Coastal lagoon | 1 | ||
| Playon | 1 | ||
| Mangrove swamp | 1 | ||
| Beach | 1 | ||
| Steep and severely dissected hills of denudative origin | 1 | ||
| Very steep and severely dissected hills of denudative structural origin | 1 | ||
| Slope degree | Slight | 0-6º | 4 |
| Moderate | 6-13º | 3 | |
| Steep | 13-25º | 2 | |
| Very steep | \(\geq\) 25º | 1 | |
| Average rainfall | Days per year | 200-250 | 4 |
| 200-150 | 3 | ||
| 150-100 | 2 | ||
| Total Gecarcinus ruricola individuals recorded in 2004 by drainage basin name | Fresh Water | 817,520 | 4 |
| Southwest Bay | 558,072 | 4 | |
| Gamadith | 405,680 | 4 | |
| San Felipe | 307,708 | 4 | |
| Bowden | 293,384 | 4 | |
| Smooth Water | 180,804 | 3 | |
| Catalina Sur | 178,048 | 3 | |
| Mc Bean | 83,348 | 2 | |
| Catalina Norte | 67,164 | 2 | |
| Bailey | 15,756 | 2 | |
| Garret Bay | 0 | 1 | |
| Drainage basin density (m/ha) | Bailey | 62.6 | 4 |
| Fresh Water | 58.7 | 4 | |
| San Felipe | 57.7 | 4 | |
| Catalina Norte | 56.6 | 4 | |
| Bowden | 52.3 | 3 | |
| Smooth Water | 51.1 | 3 | |
| Mc Bean | 47.9 | 2 | |
| Garret Bay | 47.2 | 2 | |
| Gamadith | 44.3 | 1 | |
| Southwest Bay | 27.5 | 1 | |
| Catalina Sur | 16.1 | 1 |
The reef that protects the island provides a reliable source for fish and species such as Lobatus gigas. Artisanal fishing data and coastal limits (Crawford & Márquez-Pérez 2016; INVEMAR-ANH. 2012; Rueda et al. 2010) suggest that the distribution of fishing practices is homogeneous around the island. Given the small size of the island (\(17 km^2\)), it can be argued that access to marine resources would be determined by access to the sea from the coast. The surface of the island was divided according to the proximity to beach and storm deposits using buffers of 500, 1000, 1500 and 2000 meters wide. These deposits were associated with easy sailing points for small boats, such as those required today to conduct artisanal fishing, and zones closer to these places were classified with higher suitability given the easier access to marine resources they offer.
Fresh water is paramount for any human population. Although fresh water can be provided through exchange networks or a supply line, these options are limited by logistics. Any sedentarization process supported on non-local fresh water resources will be so limited. This means that permanent human populations seeking self-sufficiency require sources of fresh water to ensure their stability; proximity to this resource is therefore an important variable to decide where to locate a residential structure. For this reason, fresh water availability was included in the suitability classification represented by the drainage density of each basin. Drainage density was calculated dividing the sum of the length of the drainages in a basin by the basin area (Horton 1932). This measure can be used as indicator of surface permeability and proxy for fresh water availability on surface (Table 2).
The overall suitability classification added the values of suitability ranks for each variable by means of a raster calculation. This classification was originally structured in a 2x2m raster file of the terrestrial area of Old Providence Island. All suitability values were reclassified in four categories: very low suitability (1), low suitability (2), high suitability (3), and very high suitability (4).
The Model
The model description follows the ODD protocol (Grimm et al. 2006, 2010). The description consists of six elements. These elements provide an overview of the model and the general concepts behind the model’s design. An animation of one of the runs can be found in the Appendix.
Purpose
The purpose of the model was to understand how average gregariousness in a socially differentiated human population changed settlement location in a heterogeneous environment during a colonization process. The model presented did not aim to reproduce historical events. The model simulated settlement patterns under different degrees of gregariousness within an enclosed and heterogeneous environment. It was conceived as a tool to model gregarious behavior as a proxy for interdependence and independence.
Entities, state variables and scales
The model contains two kind of agents: settlers and runaways. Settlers represent colonial households, and runaways represent escaped slaves. Both settlers and runaways were characterized by the state variables gregariousness, occupation radius, reproduction rate and position (occupied cell). Additionally settlers have the state variable escape rate, and runaways have the state variable fear of settlers (see Table 3). Each agent is gregarious only with agents of the same class. Runaways attempt to stay away from settlers.
Of all state variables, only position is dynamic: gregariousness, occupation radius, reproduction rate, escape rate and fear of settlers are static variables i.e. they are assigned at agent birth and their value does not change afterwards. Other than gregariousness, which is sampled from a normal distribution, these properties were homogeneous across the whole population. This was a design choice taken in order to emphasize the analysis of the spatial distribution patterns produced by changes in gregariousness. Changing the sampling distribution for any of these attributes can be easily achieved by re-implementing the corresponding sub-procedure in the source code provided.
The digital landscape in which agents interact is heterogeneous, fixed, and without mobility constraints. It simulates the land extent of Old Providence Island (22.3 \(km^2\)) and an adjacent sea area surrounding the Island (0.69 \(km^2\)). The total area represents roughly 23 \(km^2\). Each habitat cell characterizes an area of approximately 3401 \(m^2\). Cell size matches the resolution of the digital elevation model available for the island. Cell size also roughly represents modern rural land property on the island in which 71% of rural properties are smaller than 1 ha (Rico García & Durán García 2015). Cells are arranged in a 2D \(67\times101\) layout. Habitat cells can be occupied by one agent at a time.
Landscape heterogeneity is represented by the suitability of cells: the land classification of Old Providence Island introduced above was used to create a four-level rank for cells, representing their suitability for human habitation; inland cells have suitabilities ranging from 1 to 4, and sea cells have 0 suitability and cannot be inhabited. Suitability here is used only as a representation of the agents’ preference for certain terrain, and provides no advantage to the inhabitants. Furthermore, each cell maintains its suitability without changes derived from harvesting activities or environmental hazards. Once again, these factors were excluded from the model in order to focus on the spatial results of interaction between agents with different average gregariousness. Each step of the simulation was intended to represent a period of 1-2 years.
| Variable | Type | Range | Description |
|---|---|---|---|
| All agents | |||
| Position | Dynamic | \([0,6766]\) | ID of the cell occupied by the agent |
| Occupation Radius | Static | Integers in \([0, 10]\) | Radius of the agent’s area of influence. The agent harvests cells and interacts with other agents within this area |
| Reproduction rate | Static | Float in \([0,100]\) | Probability of spawning a new settler on any given simulation step |
| Gregariousness | Static | Float number in \([-1,1]\) | Preference for living close to other agents. Positive values represent preference for spatial closeness to other agents, negative values represent spatial avoidance of other agents |
| Settlers | |||
| Escape rate (settlers only) | Static | Float in \([0,100]\) | Probability of spawning a new runaway on any given simulation step (slave escape) |
| Runaways | |||
| Fear of settlers (runaways only) | Static | Integers in [2, 14] | Valuation of the importance of avoiding settlers |
Process overview and scheduling
Figure 3 presents the workflow of one simulation step. The following processes take place in each step:
- An agent assesses terrain by comparing its position with that of their peers.
- Based on this assessment, the agent chooses between moving or staying.
- If the agent is a settler, they kill all runaways within their occupation radius.
- The agent may then reproduce with a probability given by their reproduction rate.
- If the agent is a settler, it may spawn a runaway through the slave escape submodel (see Submodels).
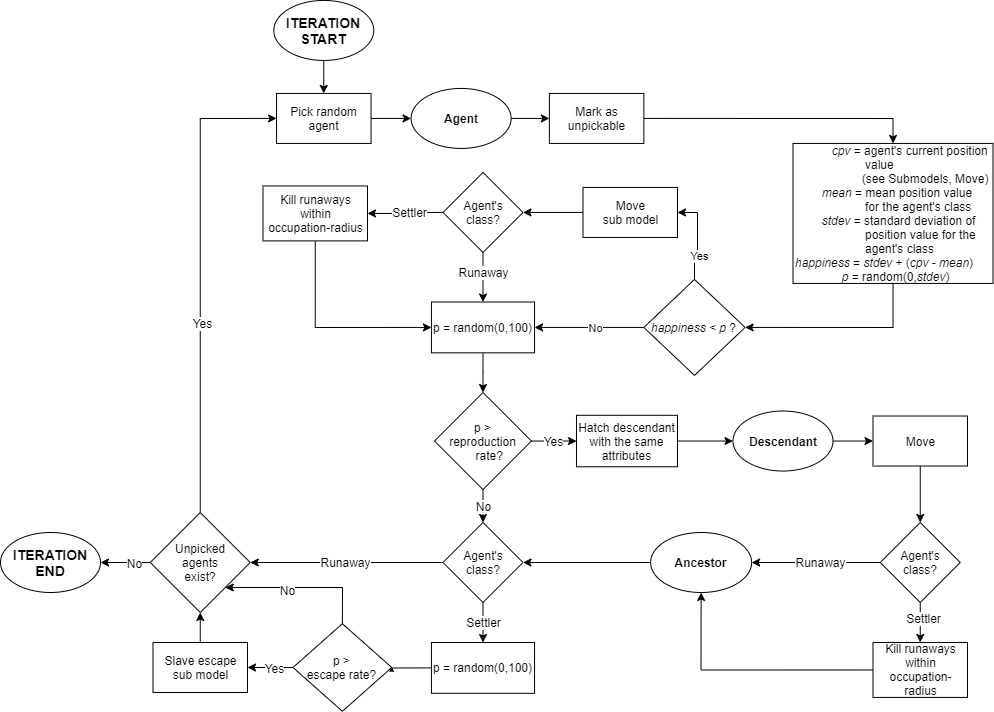
This schedule is completed by each agent successively in random order. Agent variables are updated asynchronously while population attributes (means and deviations) are updated globally at the end of each simulation step. Agent attributes are inherited by their offspring. Descendants assess available cells and then settle on an unoccupied cell immediately after birth. Only runaways die, and only when killed by settlers.
Design concepts
Basic principles: The model uses the principle that simple rules of social interaction could explain macro level phenomena such as spatial patterns (Drennan 1988; Drennan & Peterson 2006; Janssen & Ostrom 2006; Peterson & Drennan 2005). More complex forms of social interaction such as cooperation could derive from simple rules (Carballo 2013), like with whom or why you participate as part of a group. In this sense, gregariousness preferences are given in the range between individualism and collectivism, being collectivism a society-level indicator that allows to map communities or groups in which cooperation can emerge.
Emergence: The main emergent phenomenon is the formation and shaping of communities. Both settlers and runaways change their location and proximity to other agents, and therefore the number and characteristics of their clusters, in response to their interactions.
Adaptation: Agents identify the optimum cell according to an individual criterion (see objectives) and make a decision about whether to emigrate from their current location or not (see stochasticity). Agents consider suitability of terrain, location of other agents, and their own preference to live near other agents to choose their location. Upon moving to a new cell, settlers exterminate all runaways inside their occupation radius thus shaping the environment to their needs. Conversely, runaways avoid settlers to increase their chance of survival.
Objectives: Each agent aims to settle at an optimum location, according to the following criteria: a) Suitability of the terrain (cells) ; b) Neighbors: Agents assess the presence of agents of the same class negatively from the point of view of resource distribution, and positively or negatively from the point of view of companionship, depending on their own gregariousness. With positive gregariousness and as population density increases, the drive towards closeness opposes the impulse to inhabit the best terrain available. Runaways assess the presence of settlers in their neighborhood negatively.
Prediction: Agents predict the need to split resources (suitability) with other agents inside their occupation radius. Agent predictions do not use memory of previous decisions. Agents predict their gains based on the assumption that other agents maintain the same location.
Sensing: Agents sense cell suitability and the presence of other agents. They are aware of the satisfaction of agents of their own class with their current locations.
Interaction: Two agents may not occupy the same cell at the same time. Settlers kill runaways within their occupation radius. Runaways actively avoid settlers. Agents share their location and satisfaction with their current locations.
Stochasticity: Agent gregariousness is assigned randomly, following a normal distribution. Mean gregariousness and standard deviation are model parameters. The choice to move is a stochastic process, but takes agent’s objectives into account. Agents on a disadvantageous position relative to peers of the same class are more likely to move. The choice to reproduce is stochastic: all agents are equally likely to reproduce, with a probability given by their reproduction rate. The escape of a runaway from a settler is probabilistic as well. Other than gregariousness, all random variables are sampled from uniform distributions.
Observation: Location and gregariousness of each agent were recorded after each simulation step, along with the total number of agents of each class.
Initialization
Values for the following parameters must be provided in order to run the simulation:
- Reproduction rate
- Initial population of settlers
- Mean gregariousness and standard deviation for settlers and for runaways
- Escape rate
- Occupation radius
- Fear of settlers.

These parameters were not adjusted with input data; instead, simulations were run with wide ranges of values and the effect of variations on the parameters was analyzed (See Section 4).
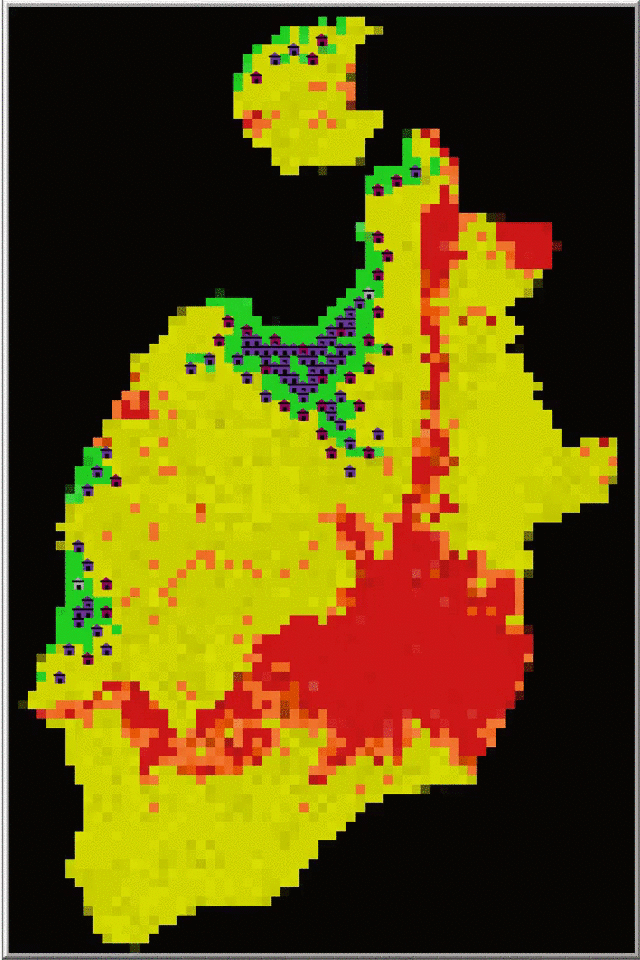
Cells are arranged in a grid and their suitability values initialized according to input from a png file in which suitabilities are encoded as colors. The initial population of settlers spawns in the center of the grid and then their attributes are initialized, one agent at a time, as follows:
- Reproduction rate, escape rate, and occupation ratios are assigned the values of the corresponding parameters.
- Gregariousness is assigned randomly, following a normal distribution with the given mean and standard deviation.
- The settler is positioned at its preferred location.
An example of an initialized simulation is shown in Figure 4(a).
Submodels
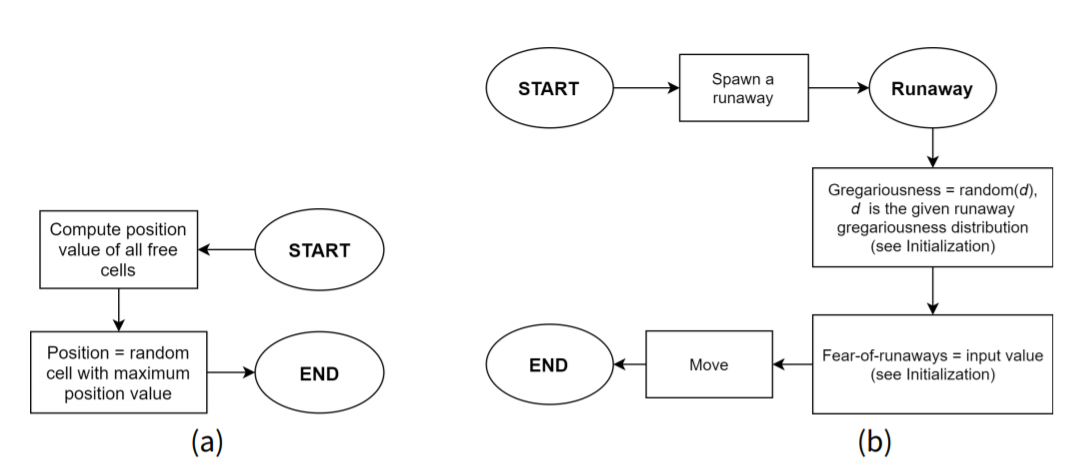
Move
This submodel is summarized in Figure 5(a). Agent \(a\) assesses the suitability of a cell \(p\) as a potential habitat by calculating the sum of suitabilities of all cells within its occupation radius from \(p\), and then dividing the result by the number of agents inside that region. Other agents present will be valued negatively due to the need of sharing produce with them. For this purpose, settlers only take other settlers into account.
Closeness to other agents may be valued positively or negatively depending on the gregariousness of agents. Only agents of the same class are considered when assessing agent closeness. Last, runaways weight in the presence of settlers within the area. Taking all these factors into account, the overall valuation of the cell is given by:
| \[\textit{position-value}(p|a)=\frac{\sum_{q\in r(p|a)}\textit{suitability}(q)}{A}\left(1+C\,\textit{gregariousness}(a)-\delta_{a}S\,\textit{fear-of-settlers}(a)\right)\] | \[(1)\] |
Agent \(a\) is satisfied with its current position if \(\text{position-value}(a)\) is greater or equal to the mean position value of agents of its class. In this case, agent \(a\) stays in its current position. If \(\text{position-value}(a)\) is below 1 standard deviation of the mean, agent \(a\) is unsatisfied and will move to a new cell. Otherwise, agent \(a\) may move to a new cell with probability:
| \[p(a\to\textit{move})=\frac{m(\textit{position-value})-\textit{position-value}(a)}{\sigma (\textit{position-value})}\] | \[(2)\] |
Slave escape
A runaway escapes from a settler with a probability equal to the settler’s escape rate. The new runaway has a gregariousness sampled from a normal distribution and moves immediately to an optimum location (see Figure 5 (b)).
Simulation Experiments
Series of simulation experiments were conducted by systematically changing the parameter values within the allowed ranges (see Table 4). Only one parameter changed at a time; all the others remained at their default values. A total of 10 replicas were run for each set of values. Each replica consisted of 100 simulation steps.
The effect of each parameter on the spatial distribution of settlers and runaways was measured through the Average Nearest Neighbor Ratio (ANNR) (Ebdon 1985):
| \[\textit{ANNR}=\frac{\bar{d}}{\langle d\rangle}\] | \[(3)\] |
| \[\bar{d}=\sum_{i=1^n}\frac{d_i}{n}\] | \[(4)\] |
| \[\langle d\rangle=\frac{0.5}{\sqrt{\frac{n}{A}}}\] | \[(5)\] |
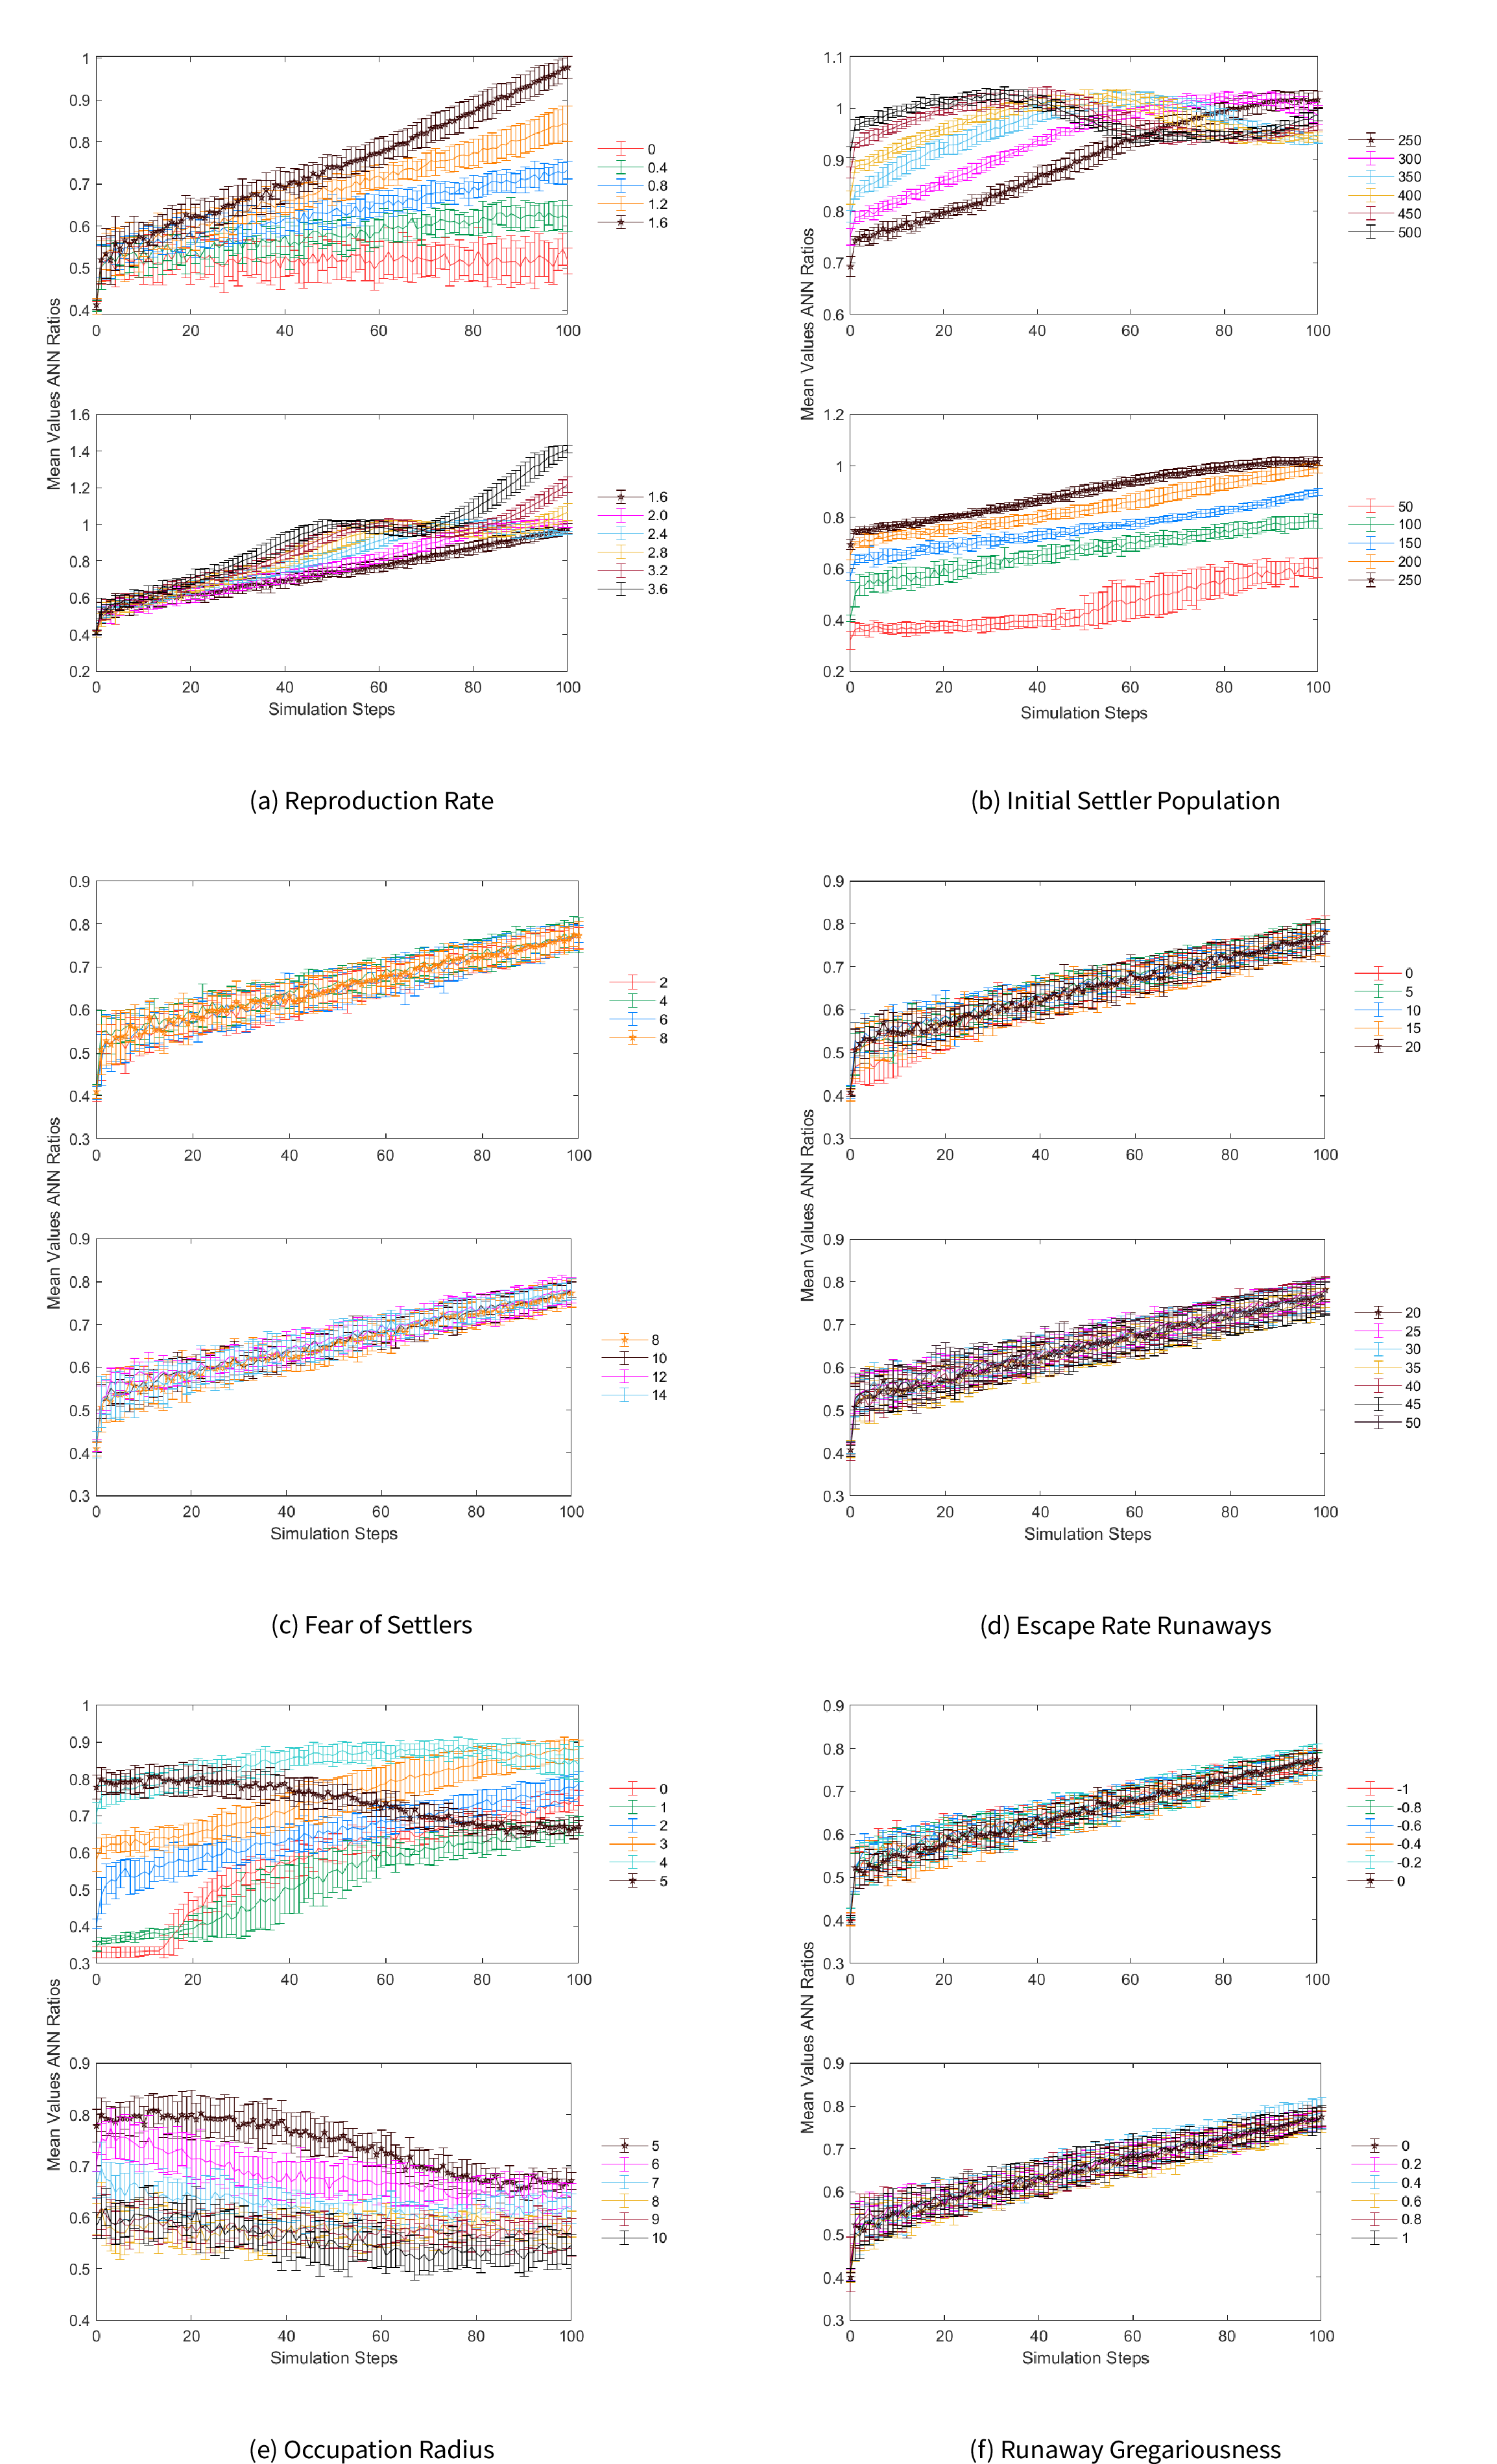
The ANNRs allow to evaluate changes in spatial clustering for agents of the same class within a fixed study area. If the ANNR is less than 1, the pattern exhibits clustering. If the index is close to 1 it suggest a random distribution. If the index is greater than 1, the trend is toward dispersion (Mitchel 2005). We compared the changes in the spatial distribution of settlers and runaways, simulating long-term changes. We were interested in the variability of ANNR values over time. For each simulation step, the distribution and confidence intervals of ANNR values were calculated using the mean and standard deviation of all ANNR values for each change in parameter values. Parameter values were used as a grouping variable to plot mean ANNR values and standard deviations (Figures 6, 7, and 8).
| Parameter | Low Value Used | Default Setting | High Value Used | Increment |
|---|---|---|---|---|
| Reproduction rate | 0 | 1% | 3.6% | 0.4% |
| Fear of settlers | 2 | 10 | 14 | 2 |
| Initial population | 50 | 100 | 500 | 50 |
| Mean gregariousness | -1 | 0.7 | 1 | 0.2 |
| Gregariousness std. dev. | 0 | 0.33 | 1 | 0.1 |
| Occupation radius | 0 | 2 | 10 | 1 |
| Escape rate | 0 | 10% | 50% | 5% |
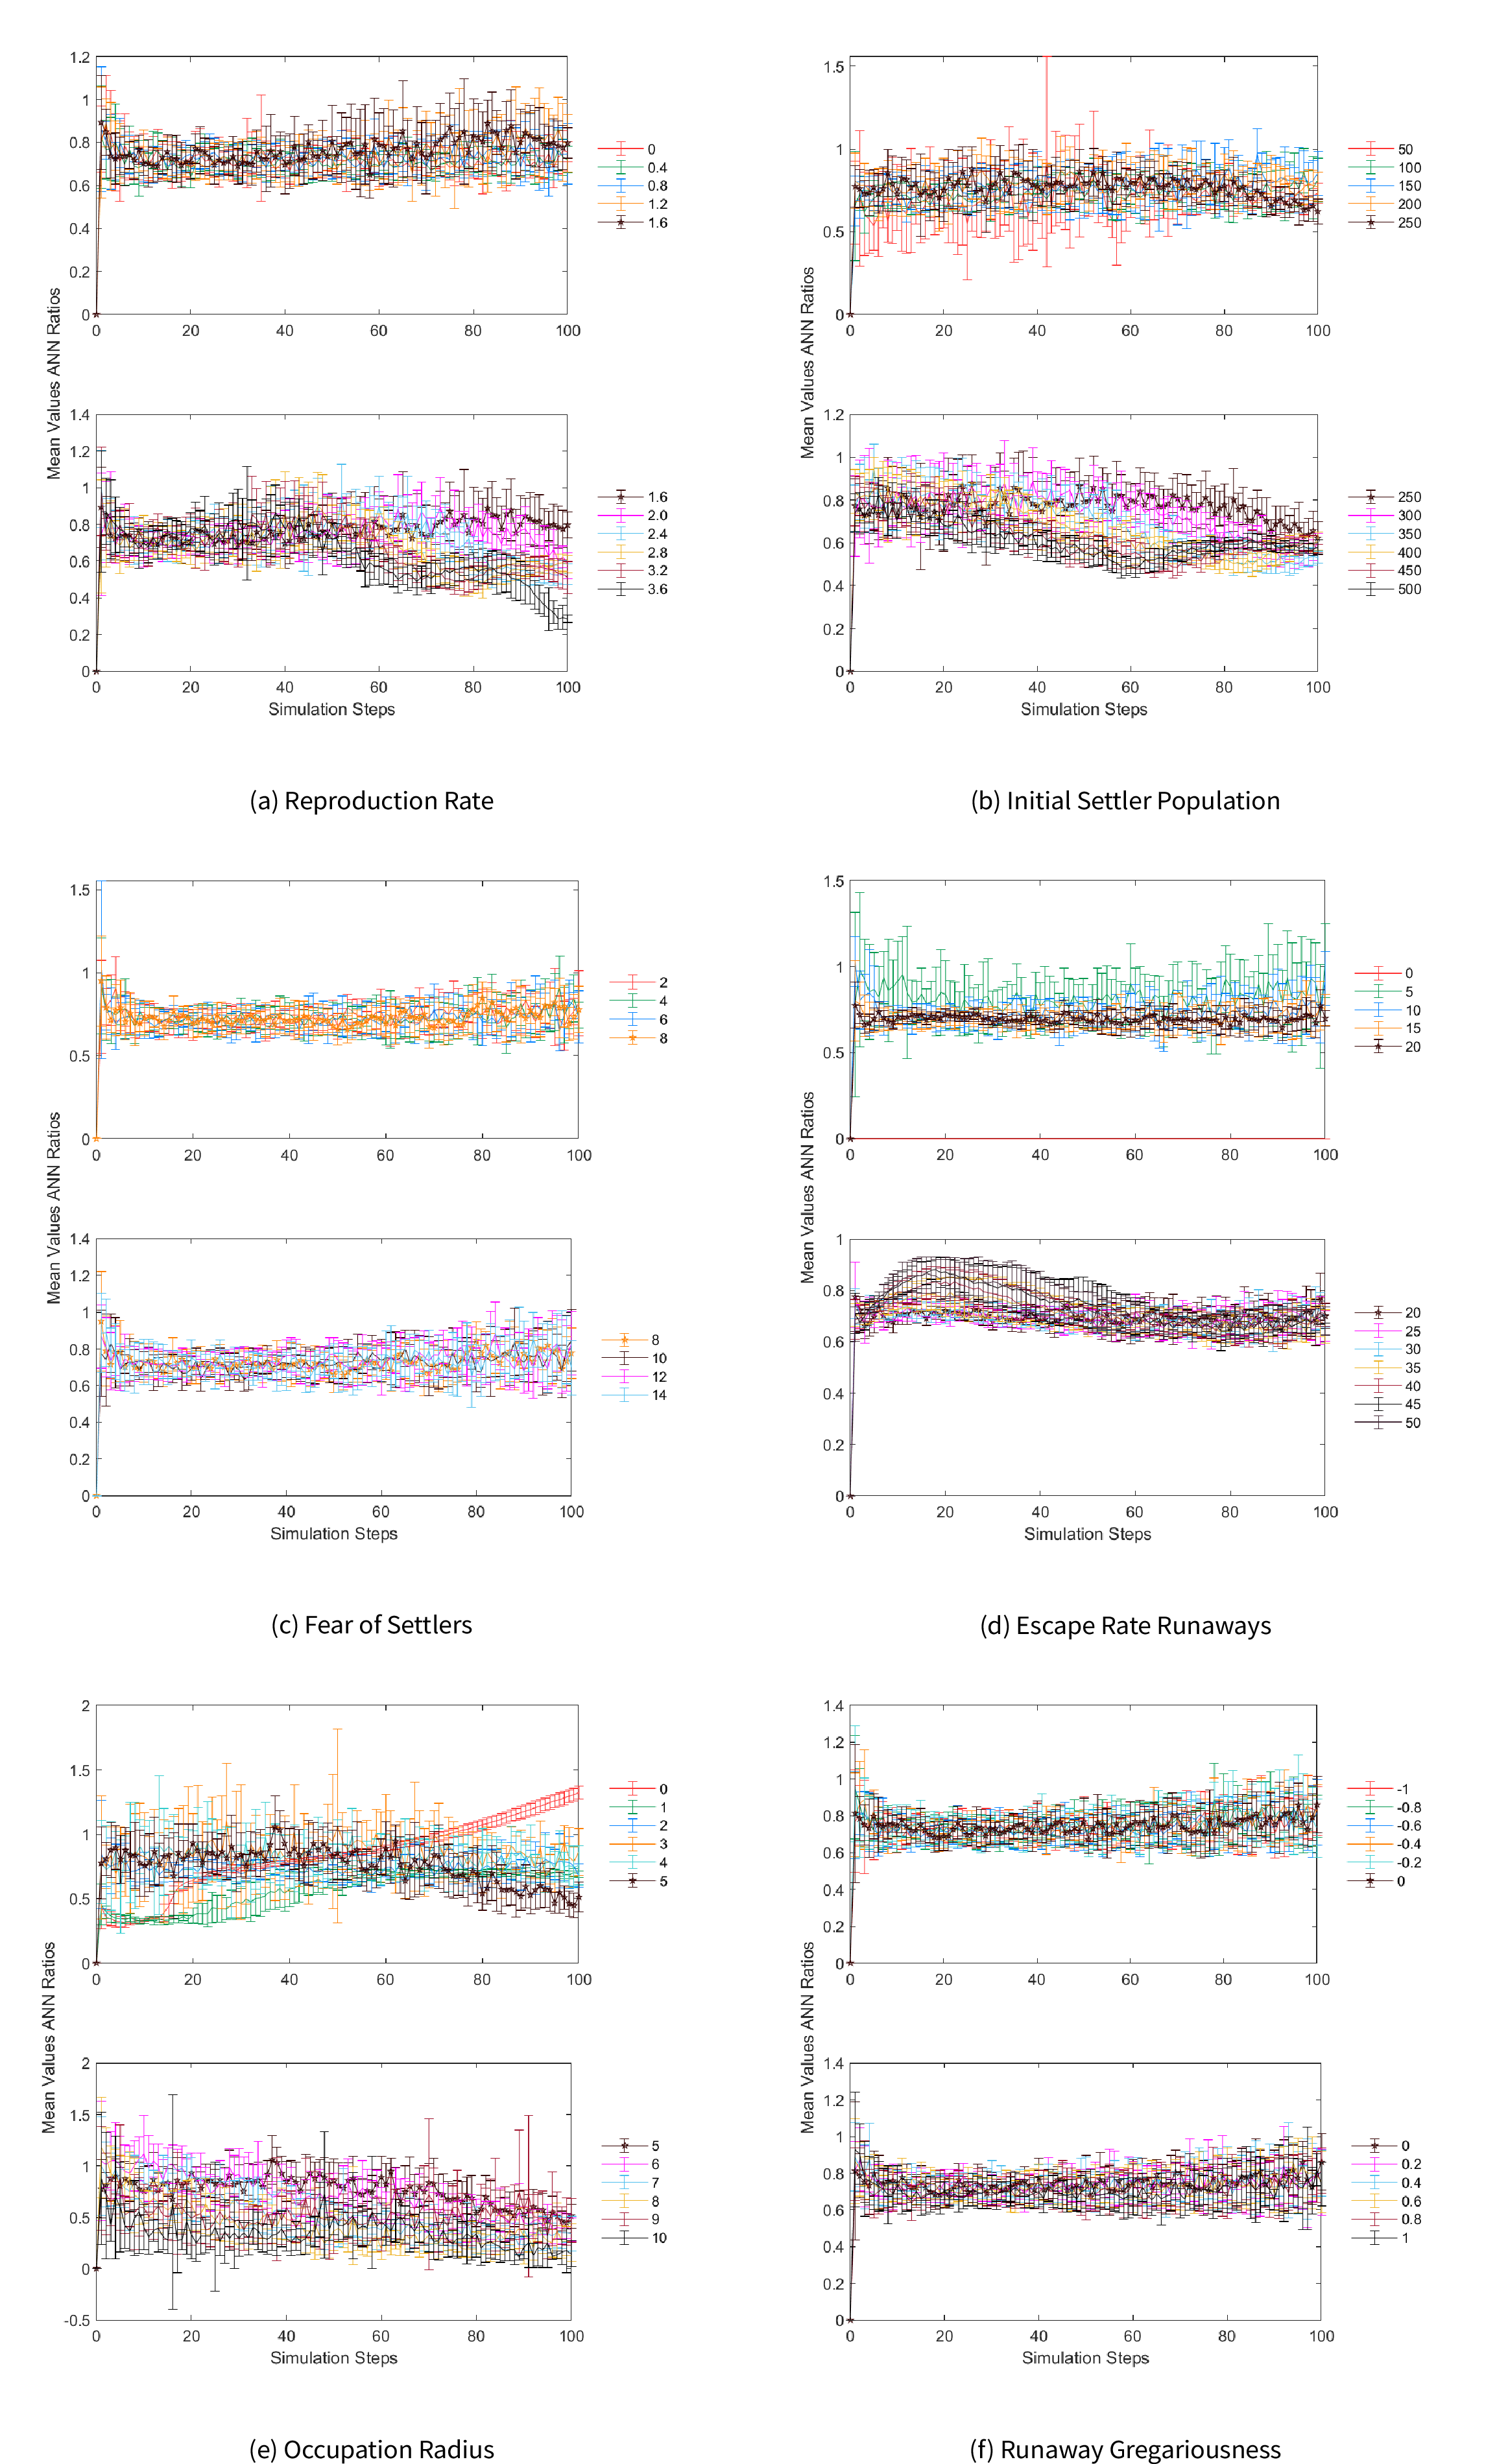
Reproduction rate
Increments in the reproduction rate diminished settler clustering across the digital landscape (Figure 6(a)). For settlers, at rates below \(1.6\%\) there was a tendency towards clustering. In runs with reproduction rates \(\ge2\%\) the curve flattens on ANNR=1 at some point of the simulation, revealing a pseudo-random pattern. For reproduction rates \(>2.4\%\) the spatial distribution shifted toward dispersion in the last steps. This is due to saturation of high-to-mid-suitability terrain enforcing settlement separation outside of the most crowded areas (see Figure 4).
The patterns shown by runaways were different (Figure 7(a)). The spatial distribution of runaways showed a clustered pattern with ANNR values roughly between 0.5 and 1. The runaway population was kept low by settlers’ location change: runaway colonies were small and short-lived. In most cases, this pattern continued until the end of the simulation. However, for reproduction rates \(>3.2\%\) there was a significant increment in runaway clustering during the final simulation steps .This is due to the increase in settler dispersion and fostered occupation of new areas at high reproduction rates: runaways answered to this situation by fleeing to the lowest-suitability area, which settlers avoided because of its low productivity and isolation (see Figure 4). This effectively created a safe haven for runaways, where an unusually large and tightly clustered community flourished.
Initial population
The initial population always clustered in the northwest where the largest fertile bay is located (Figure 4(a)). Historic accounts mention that this place sheltered New Westminster, the first European nucleated settlement. This area is also where the largest nucleated community is located today on the island (Figure 1). Agent clustering was sensitive to and increased with the initial population. First settlers and settlers prone to gregariousness were concentrated in the most suitable areas but then population growth resulted in a steady tendency toward dispersion (Figures 6(b) and 4(b)). After the second half of the simulation steps, settler clustering in the simulation with the smallest initial population (n=50) showed considerable spread of its ANNR values. This suggests that the number of possible spatial configurations of agents across the landscape increased. Simulations with larger initial populations showed settler spatial patterns that could be better explained as stochastic processes. Simulations with initial populations \(\geq\) 250 showed ANNR values around 1, without conspicuous dispersion. In this scenario, neither increase nor decrease in settler clustering occurred but rather low predictability in settler spatial patterns. Runaway spatial patterns did not differ with changes in settler initial population. The ANNR values for runaways were close to 1, indicating that their spatial configuration probably followed a stochastic process (Figure 7(b)). These patterns are consistent with those observed for reproduction rate, and are likely caused in the same manner by demographics.
Fear of settlers
As expected, settlers maintained similar spatial distributions regardless of how much runaways preferred to avoid them (Figure 6(c)). The ANNR values of settlers increased monotonously during the simulation. Once more, this is explained by population growth enforcing colonization of new areas. Runaway clustering was not sensitive to changes in their preference to avoid cells with settlers either (Figure 7(c)). Simulation runs with different fear of settlers’ values maintained a similar tendency and spread of runaway ANNR values, which were more or less constant across the simulation. These values spread roughly between 0.6 and 1, suggesting that runaways had a slight tendency to clustering. This was a consequence of settlers eliminating runaway settlements in each of the new locations they settled, as explained before.
Escape rate
The increase of escape rate decreases variability in runaway clustering without visible effects on settler clustering (Figure 6(e)). For runaways, all escape rate values showed ANNR values below 1, which could be interpreted as an indication of constant aggregation in space. The lowest positive value (5%) showed more spread of the runaways’ ANNR values than other parameter values, at the beginning and at the end of the simulation. The highest escape rates (\(\geq 40\%\)) created an initial population effect on runaways that increased the randomness in the spatial distribution of runaways during the first quarter of the simulation steps, after which the growing settler population overtook runaways (Figure 7(e)).
Occupation radius
Simulations were very sensitive to changes in the occupation radius and a high value in this parameter increased settler clustering more than any other parameter included in the model. Low values (between 1 and 4) increased the randomness in the spatial locations of settlers, while values \(\geq 5\) augmented clustering (Figure 6(e)). This change in regime highlights the increasing importance of gregarious life compared to terrain quality when more opportunities for interaction are available. The spatial location of runaways rather showed a stochastic pattern with increasing spread in ANNR values with respect to the mean (Figure 7(e)). As before, this is explained by low runaway population due to extermination by settlers. In fact, at minimum occupation radius, where settlers are effectively blind to the presence of runaways, the runaways population grew and the ANNR curve displayed a different pattern, quite similar to the one observed for settlers.
Settler gregariousness
As with the previous simulations, a trend towards increasing randomness driven by population growth was observed as time progressed. Non-gregarious populations (mean gregariousness \(\leq0\)) showed almost the same mean ANNR values, falling within each other’s standard deviation intervals. On the other hand, increasingly positive gregariousness values (\(\geq0.2\)) visibly increased settler clustering, as expected. Each increment was significant enough to make the mean ANNR values fall outside the standard deviation interval of the next greater adjacent value. Nevertheless, the effect produced by the population growth through time continued to drive the ANNR values closer toward random patterns (Figure 8(a)). Runaway clustering was not very sensitive to changes in settler gregariousness. Runaway locations show similar spread in mean and standard deviation ANNR values regardless of changes in settler gregariousness (Figure 8(b)). Settler and runaway clustering was not sensitive to changes in runaway gregariousness. For both class agents, each parameter showed very similar clustering patterns without significant differences in the spread of values or the tendency of ANNR values through time (Figures 6(f), 7(f)).
Standard deviation gregariousness
Figures 8(c) and 8(d) show that this parameter did not affect agent clustering for either population.
Discussion
The different scenarios showed that initial settlers start in very suitable areas with a clustered pattern, and new agents move to lower suitability areas often following a random or evenly-dispersed pattern. Figure 4(a) shows that during the initialization one major cluster of settlers emerged. Initial settlers found the best spot and thrived there, showing gregarious behavior in resource-rich locations. Figure 4(b) and Figure 8(a) suggest that initial gregarious behavior or a large proportion of the population with strong gregarious preferences does not preclude the existence of dispersed agents. On the contrary, simulations showed that on average agents have a tendency to disperse themselves, driven by population growth. Initial settling and environmental heterogeneity limit high suitability location options for subsequent agents (settlers and runaways), increasing their dispersal across the environment.
Clusters of settlers and runaways can be taken as a representation of local (nucleated) communities (Drennan & Peterson 2006) and these are intensified by some changes in simulation parameters. Although they did not necessarily located always close to each other, settlers and runaways showed orientation to in-group behavior, which could be interpreted as a sign of collectivism. Initialization always produced one nucleated settlement in the same place where initial settlers of Old Providence started. This place has the largest number of contiguous, highly suitable cells, and for this reason, all simulations started always from a clustered pattern. However, ANNR analysis reveals that the size of this settlement decreases for 0 and negative gregariousness, showing that gregarious drive can play a role in the emergence of large nucleated communities (see Figure 8(a)).
Settler clustering was reduced with time in most of the simulations, driven by the population growth of settlers and the restrictions imposed by the initial population and environmental heterogeneity. Runaway clustering showed values in the same intervals through time in all simulations, regardless of parameter changes. Considerable variability in the distribution of runaway clustering, expressed by means of the standard deviation of ANNR values, was observed. This variability could be associated with the dominated role of runaways in the model. Runaways sustained a constant population but could not form permanent groups because they were heavily dominated by settler activities. This suggests that populations structured by dominant roles hinder possibilities of steady interaction between dominated agents.
Simulations showed that gregarious behavior increased clustering, but the likelihood of interaction between agents showed stronger effects on agent locations. Settler clustering increased when: a) there was a strong increment in occupation radius (Figure 6(a)) and (b) the initial settler population was very small (Figure 6(b)). These parameters are modifiers of the number of possible interactions between agents. Large occupation radii trigger more interactions because settlers can intersect with a larger number of other agent occupation radii and cover more settlers with their own occupation radius. A larger occupation radius also increases the number of cells available for each settler which, other things being equal, reduces the disadvantages/benefits of increasing distance between agents and the importance of environmental heterogeneity in ideal location calculations. The combination of these factors averages on a negative or positive effect on the value of gregariousness. The negative effect dominated for occupation radius <5, causing an increase in clustering. Then, at occupation radius >5, the potentiating effect on gregariousness starts to dominate, causing clustering to increase.
Runaway clustering, on the other hand, was most affected by: a) strong increments in occupation radius; and b) high reproduction rate values (Figure 7(a)). Occupation radius affected runaways in the same way as settlers, but now another effect emerged from the survival pressure characteristic of this population: at very low occupation radius settlers’ ability to detect runaways becomes hindered, which allows the population to thrive. Similarly, reproduction rate increments increased runaway clustering because new runaways were more likely to emerge from older runaways, but specially because demographic explosion pushed them towards areas less prone to be reached by settlers (See Figure 4). This allowed new runaways to cluster near other runaways without being killed by settlers. At the same time, the population growth of settlers created by larger reproduction rates increased settlement dispersal and reduced areas in which runaways could thrive, which in turn decreased the average nearest neighbor distances between runaways that survived after each simulation step. A small initial population allowed the occupation of highly suitable areas in a slow and orderly process, delaying the emergence of behaviors that locate settlers and runaways in less suitable areas. Simulations thus suggest that the frequency of agent interaction can be driven by the average degree of gregariousness in a structured population but the most conspicuous effects in clustering were produced by initial conditions and behavioral adaptations that increased the capacity of agents to access more resources and the likelihood of more frequent interaction with other agents.
The model also suggested that regardless of the agents’ preferences, most of the agent population aggregates first within the cells with best suitability and then occupies other less suitable areas. Historic data about Old Providence Island indicate that the colonization process was similar to the pattern in Figure 4. Historic records describe a mixed settlement pattern configured by a small nucleated settlement, named New Westminster (today Old Town), located in the same area where the largest nucleated community occurred in the model. Dispersed farmsteads and settlements of escaped slaves emerged later on the island. New Westminster only had 30 houses, a church and the governor’s house (Newton 1914 pp. 53–152). Input data and simulation results suggest that archaeological contexts produced by initial colonial settlements could be located inside the Bowden area. These observations are congruent with theoretical expectations of an Ideal Free Distribution model (Winterhalder et al. 2010). Simulations also suggest that regardless of the way a human population is structured within a heterogeneous environment, clustering and spatial location are governed by underlying principles such as the likelihood of interaction and the maximization of individual gains, respectively.
Extensions
The model can be improved in several dimensions. The model assumed a static environment, whereas eco-dynamics of human populations and environments create density dependent effects that are usually expressed in a decreasing relationship (Winterhalder et al. 2010). In other words, the density of the population can reduce habitat suitability. Dynamic environments with feedback loops that simulate positive and negative effects of population density is one way to improve the model. Further extensions should explore the effects of travel costs by means of including variation in the terrain topology. Other model extensions should include stochastic environmental hazards. For example, on Old Providence Island storms and hurricanes occur at irregular intervals and their ecological consequences on settlement nucleation dynamics could be substantial (e.g floods, lost crops). In order to improve the model, extensions can also evaluate the effects of environmental homogeneity on agent’s behavior. The model should be run in environments with less environmental heterogeneity to test its effects on agent clustering. The modeled scenarios were similar in demographic terms. The effects of slavery in the model can be expanded by including slave labor and different slave trade scenarios as part of the model. The population growth of settlers was constant and this agent class did not die in the model. The model also lacks variables to measure fitness. Agent reproduction can be improved by including death events for settlers and agent fitness measures. The occupation radius is an important parameter in the model and it can be modeled with more variability for each agent class. Different occupation radii between or within the same or more agent classes could help to explore complexity behind several levels of hierarchical formations.
Concluding remarks
This paper describes an exploratory exercise in archaeological agent-based modeling. A simple socio-ecological model yielded results that can be meaningfully compared with historic records and theoretical expectations. This is an encouraging finding. It might be interesting to explore what kind of agent behavior and emergent phenomena occur in larger areas with less environmental heterogeneity, and larger populations with less complete knowledge about their environment merits. Human colonization events limited by technologies of communication and transportation occurred very often in the past. The archaeological context derived from these processes hold data that could be used to analyze, validate, and plan future long-term human colonization endeavours. One possible future application of this type of model can be found in considering long-term social variables of small hierarchical formations in the future human colonization processes into heterogeneous environments outside planet Earth. The model also shows that even with highly simplistic assumptions, agent-based modeling can be used to assess the effects of different factors in spatial patterns of a colonization process. Differences in the frequency of face-to-face interaction, central to the modeling process, can resemble cross-cultural variability of individualism versus collectivism found in innumerable studies (Minkov 2013). The spatial patterns found across space and time in a human community are a proxy for different the degrees of gregariousness that a community may show. They capture the spatial aspect of collectivism. Improving the fit of such agent-based models to analyse high level concepts such as gregariousness is still a challenge, but such a broad-brush approach as this one could be a good starting point.
Model Documentation
The model was developed in Netlogo (v. 6.1.1) using KIDS guidelines (Edmonds & Moss 2005). Files for further use or replication, and the code can be found online at: https://www.comses.net/codebases/d5cfd5b6-6cfe-4dbc-ab9c-6fadb3ed688a/releases/1.0.0/.Appendix
References
ÁLVAREZ, Y., Amaya, C., Barbosa, L. N., Builes, J. S., Henao, J. D., Montoya, S. M., Pacheco, P. A., Ramírez, L. F., Urrego, S., Zapata, A. M., Ordóñez, O., & Restrepo, J. J. (2014). Descripción e interpretación geológica de las Islas de Providencia y Santa Catalina. Boletín de Ciencias de La Tierra, 67–81.
BALLADARES, S. (2013). Las sociedades antiguas de nicaragua del 500 a.c. Al 800 d.c. Revista Humanismo Y Cambio Social, 1, 88–96.
BARCELÓ, J., Forte, M., & Sanders, D. H. (Eds.). (2000). Virtual Reality in Archaeology. Computer Applications and Quantitative Methods in Archaeology. British Archaeological Reports Ltd.
BARTON, C. M., Schmich, S., & James, S. R. (2004). 'The ecology of human colonization in pristine landscapes.' In C. M. BARTON, G. A. Clark, D. R. Yesner, & G. A. Pearson (Eds.), The Settlement of the American Continents: A Multidisciplinary Approach to Human Biogeography. Tucson, Arizona: The University of Arizon Press, pp. 138–161.
BARTON, C. M., Ullah, I., & Heimsath, A. (2015). How to make a barranco: Modeling erosion and land-use in mediterranean landscapes. Land, 4(3), 578–606. [doi:10.3390/land4030578]
BARTON, C. M., Ullah, I. I. T., Bergin, S. M., Sarjoughian, H. S., Mayer, G. R., Bernabeu-Auban, J. E., Heimsath, A. M., Acevedo, M. F., Riel-Salvatore, J. G., & Arrowsmith, J. R. (2016). Experimental socioecology: Integrative science for anthropocene landscape dynamics. Anthropocene, 13, 34–45. [doi:10.1016/j.ancene.2015.12.004]
BILLINGHAM, J., Gilbreath, W. P., Oleary, B., & Gosset, B. (1979). Space resources and space settlements. NASA - U.S. Government Printing Office.
BRIGGS, J., Dabbs, K., Holm, M., Lubben, J., Rebarber, R., Tenhumberg, B., & Riser-Espinoza, D. (2010). Structured population dynamics: An introduction to integral modeling. Mathematics Magazine, 83(4), 243–257. [doi:10.4169/002557010x521778]
CARBALLO, D. M. (Ed.). (2013). Cooperation and Collective Action: Archaeological Perspectives. Boulder, CO: University Press of Colorado.
CLARK, J. K., & Crabtree, S. A. (2015). Examining social adaptations in a volatile landscape in Northern Mongolia via the agent-based model GER GROUPER. Land, 4(1), 157–181. [doi:10.3390/land4010157]
CLEMENTE-CONTE, I., & Gassiot Ballbè, E. (2004). ¿En el camino de la desigualdad? El litoral de la costa caribe de nicaragua entre el 500 cal. ANE y el 450 cal. NE. Revista Atlántica-Mediterránea de Prehistoria Y Arqueología Social, 7, 109–130.
CLEMENTE-CONTE, I., & Gassiot Ballbè, E. (2015). 'Apuntes sobre formación de sitios a partir de restos arqueomalacológicos. El conchero 4 del sitio karoline (400 cal bc - 300 cal ad) de la costa atlántica de Nicaragua.' In I. Gutierrez, D. Cuenca, & M. González (Eds.), La Investigación Arqueomalacológica en la Península Ibérica: Nuevas Aportaciones. Nadir, pp. 137–150.
CORALINA-INVEMAR. (2012). Atlas de la reserva de biósfera seaflower. Archipiélago de san andrés, providencia y Santa Catalina. Instituto de Investigaciones Marinas y Costeras “José Benito Vives De Andréis” -INVEMAR- y Corporación para el Desarrollo Sostenible del Archipiélago de San Andrés, Providencia y Santa Catalina -CORALINA-.
CRAWFORD, S. D., & Márquez-Pérez, A. I. (2016). A contact zone: The turtle commons of the Western Caribbean. International Journal of Maritime History, 28(1), 64–80. [doi:10.1177/0843871415624095]
CREMA, E. R. (2014). A simulation model of fission–fusion dynamics and long-term settlement change. Journal of Archaeological Method and Theory, 21(2), 385–404. [doi:10.1007/s10816-013-9185-4]
DRENNAN, R. D. (1988). 'Household location and compact versus dispersed settlement in Prehispanic Mesoamerica.' In R. R. Wilk & W. Ashmore (Eds.), Household and Community in the Mesoamerican Past. Albuquerque, NM: University of New Mexico Press, pp. 273–293.
DRENNAN, R. D., & Peterson, C. E. (2006). Patterned variation in prehistoric chiefdoms. Proceedings of the National Academy of Sciences, 103(11), 3960–3967. [doi:10.1073/pnas.0510862103]
EBDON, D. (1985). Statistics in Geography: A Practical Approach. Second edition. New York, NY: Basic Blackwell.
EDMONDS, B., & Moss, S. (2005). 'From KISS to KIDS – An “anti-simplistic” modelling approach.' In P. Davidsson & K. Logan B. andTakadama (Eds.), Multi-Agent and Multi-Agent-Based Simulation. Berlin Heidelberg: Springer, pp. 130–144. [doi:10.1007/978-3-540-32243-6_11]
ESRI. (2019). World imagery [base map]. Scale not given. World imagery. April 4, 2019. http://www.arcgis.com/home/item.html?id=10df2279f9684e4a9f6a7f08febac2a9.
FAJARDO, S., & Rodríguez, Á. (2017). Estudios de impacto ambiental para las obras de protección del litoral de la bahía de black sand en la isla de providencia y para la recuperación de las playas de north end (spratt bight) y los estudios y diseños estructurales para la construcción de un mirador turístico en el sitio donde se localiza el espigón tiuna, isla de san andrés. Unión Temporal Sisco Ingeniería - Aquabiósfera S.A.S.; M.A.S. ESTUDIOS for Findeter S.A.
GILBERT, N. (2008). Agent-Based Models. London: SAGE Publications.
GRIFFIN, A., & Stanish, C. (2007). An agent-based model of prehistoric settlement patterns and political consolidation in the lake Titicaca basin of Peru and Bolivia. Structure and Dynamics, 2(2).
GRIMM, V., Berger, U., Bastiansen, F., Eliassen, S., Ginot, V., Giske, J., Goss-Custard, J., Grand, T., Heinz, S. K., Huse, G., Huth, A., Jepsen, J. U., Jørgensen, C., Mooij, W. M., Müller, B., Pe’er, G., Piou, C., Railsback, S. F., Robbins, A. M., … DeAngelis, D. L. (2006). A standard protocol for describing individual-based and agent-based models. Ecological Modelling, 198(1), 115–126. [doi:10.1016/j.ecolmodel.2006.04.023]
GRIMM, V., Berger, U., DeAngelis, D. L., Polhill, J. G., Giske, J., & Railsback, S. F. (2010). The ODD protocol: A review and first update. Ecological Modelling, 221(23), 2760–2768. [doi:10.1016/j.ecolmodel.2010.08.019]
GROSMAN, L. (2016). Reaching the point of no return: The computational revolution in archaeology. Annual Review of Anthropology, 45(1), 129–145. [doi:10.1146/annurev-anthro-102215-095946]
HALL, S. (2000). 'Cultural identiy and diaspora.' In N. Mirzoeff (Ed.), Diaspora and Visual Culture: Representing Africans and Jews. London: Routledge, pp. 21–33. [doi:10.4324/9781315006161]
HEY, J., & Machado, C. A. (2003). The study of structured populations—new hope for a difficult and divided science. Nature Reviews Genetics, 4(7), 535–543. [doi:10.1038/nrg1112]
HORTON, R. E. (1932). Drainage‐basin characteristics. Eos Trans. AGU, 13, 350–361.
INVEMAR-ANH. (2012). Estudio linea base ambiental y pesquera en la reserva de biosfera seaflower (archipiélago de san andrés, providencia y santa catalina) como aporte al conocimiento y aprovechamiento sostenible de los recursos para la región -fase i. Informe ténico final. INVEMAR ANH; INVEMAR ANH.
JANSSEN, M. A., & Ostrom, E. (2006). Empirically based, agent-based models. Ecology and Society, 11(2), 37. [doi:10.5751/es-01861-110237]
JOCHIM, M. (2009). The process of agricultural colonization. Journal of Anthropological Research, 65(2), 299–310. [doi:10.3998/jar.0521004.0065.209]
KOHLER, T. A., Bocinsky, R. K., Cockburn, D., Crabtree, S. A., Varien, M. D., Kolm, K. E., Smith, S., Ortman, S. G., & Kobti, Z. (2012). Modelling prehispanic pueblo societies in their ecosystems. Ecological Modelling, 241, 30–41. [doi:10.1016/j.ecolmodel.2012.01.002]
KOHLER, T. A., & Carr, E. (1997). 'Swarm-based modelling of prehistoric settlement systems in southwestern North America.' In I. Johnson & M. North (Eds.), Archaeological applications of GIS: Proceedings of Colloquium II, UISPP XIIITH Congress, Forli, Italy, September 1996 (CD-ROM). University of Sydney, Archaeological Computing Laboratory.
KOHLER, T. A., Johnson, D. C., Varien, M., Ortman, S., Reynolds, R., Kobti, Z., Cowan, J., Kolm, K., Smith, S., & Yap, L. (2007). 'Settlement ecodynamics in the prehispanic central Mesa Verde region.' In T. Kohler & S. E. van der Leeuw (Eds.), The Model-Based Archaeology of Socionatural Systems. School of Advanced Research pp. 61–104. [doi:10.1093/oxfordhb/9780195380118.013.0050]
LAKE, M. W. (2014). Trends in archaeological simulation. Journal of Archaeological Method and Theory, 21(2), 258–287. [doi:10.1007/s10816-013-9188-1]
LONDOÑO, W. (2014). Informe del programa de arqueología preventiva del proyecto de reconstrucción del fuerte la libertad. Santa catalina, municipio de providencia, departamento de san Andrés, Colombia [Unpublished technical report]. Augusto Rico S.A.S.
MAYFIELD, T. (2019). Ending a great season on Providence Island. https://hunterblatherer.wordpress.com/2019/08/27/ending-a-great-season-on-providence-island/.
MINKOV, M. (2013). Cross-Cultural Analysis: The Science and Art of Comparing the World’s Modern Societies and their Cultures. London: Sage. [doi:10.4135/9781483384719]
MITCHEL, A. (2005). The Colonising activities of the English puritans: The last phase of the Elizabethan struggle with Spain. New Haven: Yale University Press.
NEWTON, A. P. (1914). Colonising Activities of the English Puritans: The Last Phase of the Elizabethan Struggle with Spain. New Haven: Yale University Press.
NIETSCHMANN, B. (1995). Conservación, autodeterminación y el área protegida costa miskita, Nicaragua. Mesoamérica, 29, 1–55.
OBERTO, M. (1834). Carta enviada al general Francisco de Paula Santander, Presidente del Estado de la Nueva Granada por Manuel de Oberto, con informes geográficos, económicos y políticos de las islas de San Andrés, Providencia y Santa Catalina; y de los Puertos de Bocas del Toro, Portobelo, Chagres y Cartagena: Vols. caja 40 folios 171-176. (A. G. de la Nación, Ed.). Bogotá D.C. Archivo General de la Nación. Fondo ENRIQUE ORTEGA RICAURTE Serie Correspondencia Militar. Box 40 Sheets 171-176.
OFFEN, K. H. (2008). El mapeo de la mosquitia colonial y las prácticas espaciales de los pueblos mosquitos. Mesoamérica, 29(5), 1–36.
OFFEN, K. H. (2011). La cartografía colonial de centroamérica y el topónimo “mosquito”. Asociación para el Fomento de los Estudios Históricos en Centroamérica.
ONEILL, J. (1809). Noticias de la situación de la isla de san andrés y sus adyacentes: Vols. Legajo 11 folios 470-497 (A. G. de la Nación, Ed.). Bogotá D.C.Archivo General de la Nación, Fondo POBLACIONES Varias, Folder 11 sheets 470-497.
ORDAHL, K. (1993). Providence Island 1630-1641: The Other Puritan Colony. New York, NY: Cambridge University Press.
PARSONS, J. J. (1985). San Andrés Y Providencia. Una Geografía Histórica de las Islas Colombianas del Mar Caribe Occidental (2nd ed.). Banco de la República.
PETERSON, C. E., & Drennan, R. D. (2005). Communities, settlements, sites, and surveys: Regional-scale analysis of prehistoric human interaction. American Antiquity, 70, 5–30. [doi:10.2307/40035266]
PINDER, D., Shimada, I., & Gregory, D. (1979). The nearest-neighbor statistic: Archaeological application and new developments. American Antiquity, 44(3), 430–445. [doi:10.2307/279543]
POSADA, B., Henao, W., & Morales, D. (2011). Diagnóstico de la erosión costera del territorio insular colombiano (Vol. 24). INVEMAR.
RAMERY de, T. (1793). Descripción topográfica de las islas de san andrés, providencia, mangles grande y chico, sus situaciones, población, temperamento, suelo, cosechas y pesca: Vols. legajo 102 folios 592-596 (A. G. de la Nación, Ed.). Archivo General de la Nación; Bogotá D.C. Archivo General de la Nación. Sección Colonia, Fondo MISCELANIA, folder 102 sheets 592-596.
RICO García, A., & Durán García, M. (2015). Insumos técnicos para la revisión y ajuste esquema de ordenamiento territorial providencia y santa catalina islas. Diagnóstico del territorio [Unpublished technical report]. CORALINA Alcaldia de Providencia; CORALINA Alcaldia de Providencia.
ROCKMAN, M., & Steele, J. (2003). Colonization of Unfamiliar Landscapes: The Archaeology of Adaptation. London, UK: Routledge. [doi:10.4324/9780203422908]
ROMERO, Y. (2013). Reconocimiento de arqueología submarina no intrusiva para la profundización d elos canales navegables de acceso a las islas de san andrés y providencia. Programa de arqueología preventiva y plan de manejo [Unpublished technical report]. Instituto Nacional de Vías. Subdirección Red Nacional de Carreteras.
ROWLAND, D. (1935). Spanish occupation of the island of Old Providence, or Santa Catalina, 1641-1670. The Hispanic American Historical Review, 15(3), 298–312. [doi:10.2307/2506336]
RUEDA, M., Marmol, D., Viloria, E., Doncel, O., Rico-Mejia, F., Garcia, L., & Girón, A. (2010). Identificación ubicación y extensión de caladeros de pesca artesanal e industrial en el territorio marino-costero de colombia [Book]. INVEMAR, INCODER, AGENCIA NACIONAL DE HIDROCARBUROS-ANH.
SAQALLI, M., & Van der Linden, M. (Eds.). (2019). Integrating Qualitative and Social Science Factors in Archaeological Modelling. Berlin Heidelberg: Springer.
SMITH, C., & Davies, E. T. (2012). Emigrating Beyond Earth: Human Adaptation and Space Colonization. New York, NY: Springer.
STEIN, G. (1999). Rethinking World-Systems: Diasporas, Colonies, and Interaction in Uruk Mesopotamia. Tucson, Arizona: University of Arizona Press.
TOUS i Mata, M. (2002). De la gran nicoya precolombina a la provincia de Nicaragua, s. XV Y XVI. PhD Thesis. Universität de Barcelona.
VOLLMER, L. (1997). La Historia del Poblamiento del Archipiélago de San Andrés, Vieja Providencia y Santa Catalina. Ediciones Archipiélago.
WILKINSON, T. J., Christiansen, J. H., Ur, J., Widell, M., & Altaweel, M. (2007). Urbanization within a dynamic environment: Modeling bronze age communities in Upper Mesopotamia. American Anthropologist, 109(1), 52–68. [doi:10.1525/aa.2007.109.1.52]
WINTERHALDER, B., Kennett, D. J., Grote, M. N., & Bartruff, J. (2010). Ideal free settlement of California’s Northern Channel Islands. Journal of Anthropological Archaeology, 29(4), 469–490. [doi:10.1016/j.jaa.2010.07.001]
WURZER, G., Kowarik, K., & Reschreiter, H. (Eds.). (2015). Agent-Based Modeling and Simulation in Archaeology. Berlin Heidelberg: Springer.