Fear, Behaviour, and the COVID-19 Pandemic: A City-Scale Agent-Based Model Using Socio-Demographic and Spatial Map Data

, , , , ,
and
RWTH Aachen University, Germany
Journal of Artificial
Societies and Social Simulation 25 (1) 3![]()
<https://www.jasss.org/25/1/3.html>
DOI: 10.18564/jasss.4723
Received: 16-Jun-2021 Accepted: 29-Nov-2021 Published: 31-Jan-2022
Abstract
Modelling infectious diseases has been shown to be of great importance and utility during the ongoing COVID-19 pandemic. From today's globalized information landscape, however, a plethora of new factors arise that have not been covered in previous models. In this paper, we present an agent-based model that reflects the complex interplay between the spread of a pathogen and individual protective behaviour under the influence of media messaging. We use the Rescorla-Wagner model of associative learning for the growth and extinction of fear, a factor that has been proposed as a major contributor in the determination of protective behaviour. The model space, as well as heterogeneous social structures among the agents, are created from empirical data. We incorporate factors like age, gender, wealth, and attitudes towards public health institutions. The model reproduces the empirical trends of fear and protective behaviour in Germany but struggles to simulate the accurate scale of disease spread. The decline of fear seems to promote a second wave of disease and the model suggests that individual protective behaviour has a significant impact on the outcome of the epidemic. The influence of media in the form of messages promoting protective behaviour is negligible in the model. Further research regarding factors influencing long-term protective behaviour is recommended to improve communication and mitigation strategies.Our contribution
In this article, we present a Covid-19 pandemic model that includes a psycho-social model of agents to understand the impact of media on fear and of fear on behavior. We utilize real-world data to calibrate our model and use a compartmentalized extended SIR-Model to simulate disease progression. We use an OpenStreetMap-based approach to generate realistic and performant street node networks and simulate a population’s mobility and behavior, which is calibrated using real-world data.
Related Work
In this section, we briefly introduce disease modeling in general. Afterward, we provide an overview of the theories guiding our agent-based modeling approach.
Modeling of disease spread
Mathematical modeling allows for the derivation of macroscopic or system-level dynamics from microscopic or individual dynamics and behavior (Hethcote 1989). One area of application for mathematical modeling is the spread of infectious diseases. The basis for modern disease modeling is the so-called SIR model by Kermack & McKendrick (1927). This deterministic model assumes that individuals can be divided into three distinct groups: They are either susceptible to the disease (S), infected with the disease (I), or removed (R), i.e., recovered or deceased. On a system level, one can observe first an exponential increase in infected individuals. Once the fraction of susceptible individuals is sufficiently reduced so that the disease cannot spread as easily anymore, a decrease in new infections occurs.
Using the SIR model, three threshold parameters can be described which are central to the description of disease spread: \(R_0\), \(R\) and \(\sigma\). \(R_0\) represents the basic reproduction rate at the beginning of the infectious spread when all individuals are susceptible. \(R\) represents the average reproduction rate which changes during the infectious spread as the amount of susceptible individuals decreases. Finally, \(\sigma\) represents the average number of connections that will lead to a transmission of the disease. At the beginning of the infectious spread, all thresholds are the same. But as the infection spreads and the fraction of susceptible individuals decreases, \(\sigma\) and \(R\) decrease as well. It follows that \(R_0 \geq \sigma \geq R\) (Rodrigues 2016).
There are many extensions of the SIR model. For example, the SEIR model differentiates between two kinds of infected individuals: Exposed (E) individuals, i.e., individuals that are infected but not yet infectious, and infectious (I) individuals (Hethcote 2000). As reviewed by Estrada (2020), compartmental models like the SIR, the SEIR and its extensions are prominent in the modeling of COVID-19 epidemiology. For example, Dehning et al. (2020) combined a SIR model with Bayesian inference to analyze the effectiveness of the German interventions implemented in spring 2020; Worby & Chang (2020) and Götz & Heidrich (2020) used the SEIR model as a foundation.
In a review of epidemic models, Badham & Gilbert (2015) found that most models were deterministic mathematical models like the models described above. As the model population was compartmentalized according to an (extended) SIR model, modifications in behavior were implemented by modifying the transmission rates in the associated differential equations. Perez & Dragicevic (2009) described this approach as a possible shortcoming of mathematical models as it is based on the assumption that the population is homogeneous, both in its behavior and in its spatial distribution. This neglects the influence an individual’s behavior and social contact network has on the spread of an infectious disease (Wilensky & Rand 2015). Using agent-based modeling, behavior and the contact network can be included.
A current example of an agent-based model harnessing this potential is the model by Aleta et al. (2020) who modeled the disease spread in the Boston metropolitan area. Generally, in research on the COVID-19 pandemic, agent-based modeling has been most commonly used to simulate the effects of different non-pharmaceutical interventions (e.g., Silva et al. 2020; Bouchnita & Jebrane 2020; Hoertel et al. 2020).
For our model, we follow the approach described by Perez & Dragicevic (2009). In agent-based modeling of disease spread, they propose the inclusion of two complementary aspects: Firstly, an infection model like the mathematical models described above, which maps the parameters of the disease itself. Secondly, an agent model that represents the behavior of the population including the spatial and social infrastructures governing contact, and therefore possible transmission of disease, between individuals. Both of these aspects are discussed in the following.
Agent-based modeling - Disease spread
For the infection model, Khalil et al. (2012) propose an extension of the SEIR model. This extension is depicted in Figure 1. They introduce the following states: Contact with an infected individual (C), infected but not quarantined (NQ), quarantined (Q), dead (D) and immune (M).
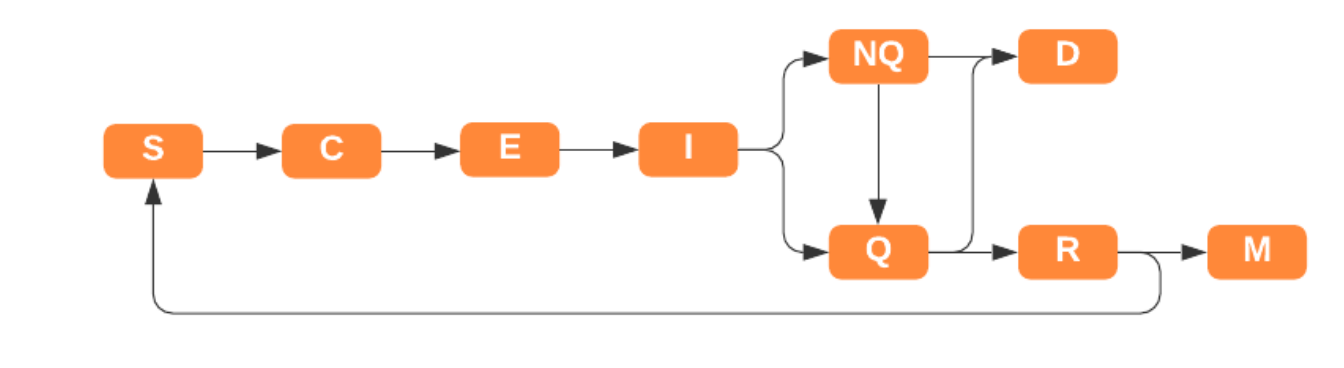
With the exception of the dead (D) parameter, all of the added states influence the potential of infection transmission when two agents come into contact. Concerning the way agent-to-agent contact is modeled, the possibilities range from simple to very complex: For example, Hethcote (2000) discusses the law of mass action as a possible simple way of modeling disease spread. This would imply that the rate of infection scales with the population density. However, this does not hold true especially for very high or very low population densities. A more sophisticated approach is modeling the spread of the disease through grid squares, where each grid differs in population size and environment type (e.g., hot, cold, damp, dry \(\dots\); Scottish COVID-19 Response Consortium 2020). Aleta et al. (2020) modeled COVID-19 transmission in the Boston metropolitan area, creating a contact network by combining empirical mobility data with census data. On the very complex side, Perez & Dragicevic (2009) designed a model which tracks agent contacts as they move through their daily routine in an environment mimicking a city with dedicated places for work, school, leisure, etc. While this results in a very precise fit of the model infection spread to the empirically observed infection spread, a model like this would be hard to scale beyond the city level.
In addition to direct agent-to-agent contact, which mostly is the main mode of transmission, some diseases also spread through residues of their pathogens in the environment. For COVID-19, there is evidence that it can be transmitted via surfaces (van Doremalen et al. 2020). Including this mode of transmission in a model results in different patterns of disease spread compared to the case of only person-to-person transmission (Wilensky & Rand 2015).
Agent-based modeling - Agent behavior
In addition to infection, the disease model also includes agent behavior.In the mathematical model by Wilensky & Rand (2015), agents move randomly through space, each step infecting one of their uninfected neighbors with a given probability of infection.1 The simplified model helps to decipher the underlying dynamics of a disease such as the reproductive number and thus the threshold at which an infection becomes an epidemic.
In contrast, Harris et al. (2019) largely ignore agent behavior in their model. Instead, only agents born in the current time step can move and the virus itself moves across the network. Also, the virus can only move if it has been generated in the same time step. Since a new virus is created in each round of the model, the virus can spread across the environment. The simplified human behavior can generate predictions that correspond to specific patterns of infectious spread. Wang et al. (2021) find that the inclusion of human activity patterns, e.g., attendance of work or school, are vital in modeling COVID-19 transmission.
To realistically replicate disease spread behavior, more complex human behavior (i.e., moving agents and individual behavior) is required. Nevertheless, proper cognitive architectures are rarely used for infection modeling because the disadvantages of high computational power requirements, high complexity, and high level of detail outweigh the advantages in accuracy. So far, more realistic models with a high level of detail have only been achieved at small scales with, for example, 1000 agents (e.g., Perez & Dragicevic 2009; Naveh & Sun 2006) or involving large computational nodes (e.g., Bhattacharya et al. 2019). However, particularly for disease simulations, a higher number of individuals can better replicate propagation at larger scales. Ideally, a predictive agent-based model should enable a one-to-one relationship between agent and inhabitant for the most fine-grained simulation possible.
In most recent disease models, behavior is classified as so-called conceptual behavior. This implies that the population mixture is homogeneous and therefore does not actually represent the behavior of individuals in the real world. The conceptual models employ abstract agent cognition to achieve large-scale performance and facilitate modeling. For example, Khalil et al. (2012) use conceptual behavior for agents in their model. During the day, agents have different social groups of social contacts through work, school, family, and their daily routines.
Parker & Epstein (2011) generate different agent routes, such as work-from-home or nine-to-five jobs, that lead to different rates of family, work, and chance of contact at different times of the day. In addition, agent behavior can be modified in terms of how long agents walk through the environment on a given day. The behavior of the agents also depends on policies as, for example, rules for social distancing or job closure.
Recent agent-based models (e.g., D’Orazio et al. 2020) also use simple cognitive models and spatial structures and treat individual cognition and resulting behaviors such as mask-wearing and density factors as constant, empirical parameters. Another example is the spatially explicit COMOKIT model that allows the modeling of COVID-19 spread at the scale of a city (Gaudou et al. 2020, see also Mahdizadeh Gharakhanlou & Hooshangi 2020).
Although human behavior is an important factor in the spread of infectious diseases, little research has been conducted on how individual behavior affects it. For example, the spread of a disease can be stopped if the number of agents carrying it is so low that the disease dies out (Funk et al. 2009). Whether an individual changes its behavior (for example, reducing contacts) depends on the information received (Funk et al. 2010).
Behavior change and information flow in agent-based models
Many epidemic models have assumed that human contact structure remains the same during the course of an epidemic and ignore that human behavior adapts to the presence of infectious diseases (Parker & Epstein 2011; Pastor-Satorras et al. 2015). Funk et al. (2010) cite several examples of changes in human behavior in the face of infectious diseases, such as voluntary self-quarantine during the bubonic plague pandemic, changes in travel behavior, and general protective behavior in the face of diseases such as measles and HIV. Research suggests that this change in human behavior can lead to a decrease in transmission rates (Nishiura 2007) or, as mentioned before, even stop the spread of a disease. Empirical evidence from the first wave of COVID-19 in Germany demonstrates the effectiveness of enforced protective behavior, i.e., the so-called lockdown (Bönisch et al. 2020; Müller et al. 2020). It also indicates that protective behavior was at least in part influenced by fear (Jørgensen et al. 2021; Stangier et al. 2021). This is further underlined by mobility only slowly increasing once the lockdown ended (Bönisch et al. 2020).
It is important to capture both directions of the dynamic between the infection behavior (see Section 2.7) and human behavior (see Section 2.10) model: how agent behavior affects the spread of disease, and how the spread of disease affects agent behavior (Funk et al. 2010). Because people act on information, information is the primary reason for behavior change of individuals.
Funk et al. (2010), in their review of models that incorporate behavior change, discuss three dimensions of this change: the source of information, the type of information, and the effect of behavior change. The source of information is usually divided into two forms: Globally available information carried by websites, newspapers, and TV news, and locally available information from a social or local network. Including both kinds of information sources has implications for the outcome of the simulation. For example, it is plausible that if beliefs against vaccination have spread in an area, less individuals in this area would be willing to get vaccinated. Similarly, it has been shown that if many individuals in an area are aware of a disease and adapt their behavior to the conditions of the disease, that the disease may die out. Both examples show that information (local in this case) can have an impact on the outcome of a potential simulation situation.
Funk et al. (2010) classify the types of information into belief-based or prevalence-based. Thus, a distinction is made between the actual prevalence of the disease and beliefs about its prevalence.
Third, an individual’s behavioral change affects disease spread when it affects either the structure of their social network, disease parameters such as infection and recovery rates, or transmission between states of the disease. This may also be the case with studies of vaccination decisions that alter disease states, individual behaviors such as social distancing that reduce infection rates, or quarantine that drastically reduces an individual’s social network (Funk et al. 2010).
As mentioned above, compartmental disease models do not not account for the heterogeneity of individuals. To improve modeling of behavioral decisions, Badham & Gilbert (2015) developed the TELL ME model that incorporates heterogeneous change in behavior due to communication.
TELL ME project
The key components of the TELL ME model are messages,regions, and individuals. Individuals perform protective behavior, which they compute depending on their attitude, perceived threat, and subjective norms. The protective behavior is in a feedback loop with the regional force of infection, incidence, and vulnerability.
With behavioral models, it is difficult to assess which parameters to use and to determine their relative influence on behavior. For the TELL ME model, Badham & Gilbert (2015) use a combined approach from the Theory of Planned Behavior and the Health Belief Model. They operationalize it by taking a weighted mean of the key inputs of attitude, subjective norms, and threat, and comparing this mean to a threshold to determine whether or not a behavior is adopted. In the model, communication is simulated by transmitted messages that consist of five parts: the sender (usually the health authority); the effect, which is calculated later in the model; the message content; the channel, which specifies the transmission medium; and the receiver.
The message content consists of the possible behavior that an agent can exhibit and the content that is specified in the message. The content of the message either recommends that the agent performs a behavior or the content exerts an influence on the agent’s attitude, trust, and perceived social norms. In the model, people who use the respective channel (social media, mass media) and hold the corresponding target flags receive the messages (For example, only people with the "high risk" flag receive messages directed to them. Messages are sent at specific times and received immediately by the target audience.). It is important to note that in the TELL ME model, agents behave only according to the information available to them. As a result, their behavior sometimes differs greatly from what would be ideal under the current circumstances (Badham & Gilbert 2015).
Funk et al. (2010) adopt the idea of bounded confidence from Hegselmann & Krause (2002): Messages change behavior only if a person’s attitude is close to the message. If the recipient is within a range of acceptance of the sending institution, attitude change is calculated as the product of confidence in the message source and the difference between the message’s attitude and the agent’s prior attitude. Using the categorization of Funk et al. (2010) described above, the TELL ME model uses both local and global information sources, a prevalence-based information type, and a binary behavior change with vaccination acceptance or refusal. In the model, communication leads to homogeneous behavior change. However, this could not be verified yet empirically. In simulations of vaccination behavior adoption over the course of the H1N1 epidemics in France, Hong Kong, and Italy, the fit of predicted behavior was poor. In particular, the simulations could not replicate the observed dissonance of strong protective behavior peaking before the epidemic itself reaches a local peak, although they attempted to implement the difference between the real facts and the information available to the individual (Badham & Gilbert 2015). This shows what aspects an improved model should take into account: Individual behavior that is not correlated directly with the risk of infection, but rather with the perceived danger and novelty of the disease.
Agent zero
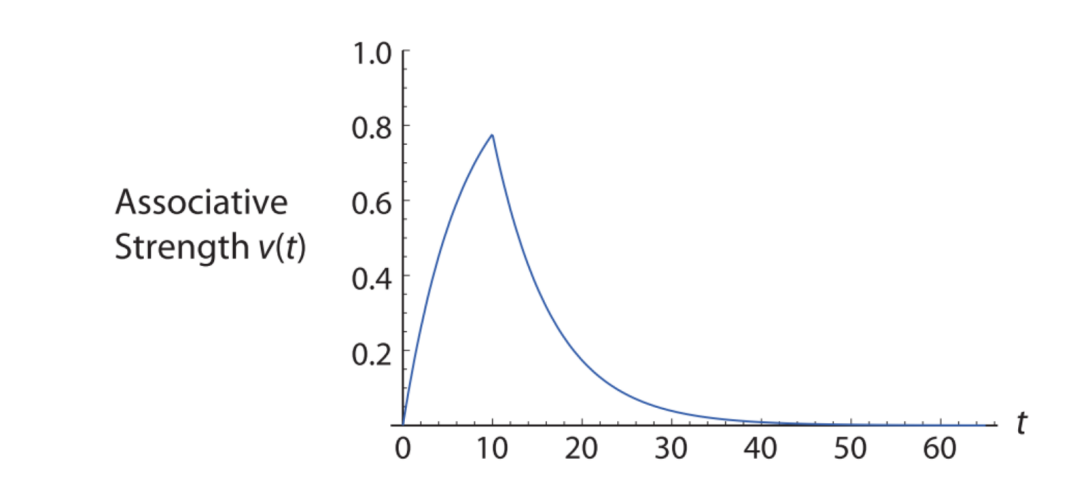
With Agent Zero, Epstein (2014) has introduced a second model that is fundamental for this study. The Agent Zero model is based on neurocognitive principles and consists of three parts: affective, cognitive, and social components. These three parts define an agent’s behavioral disposition and determine if an agent performs an action. The agent responds to stimuli (events) that (may) trigger fear or other feelings and shape the agent’s behavior. The strength of association of a feeling to a stimulus determines the strength of the response. A stimulus may be the experience of a criminal act, the infection of a person, or the sudden drop in the price of an index stock. For the affective component, the Rescorla-Wagner model of conditioning is used as the central mechanism (Epstein 2014). In the Rescorla-Wagner model, learning describes an association between conditioned and unconditioned stimuli. If the conditioned stimuli predict the unconditioned stimuli, there is a strong association between the stimuli.
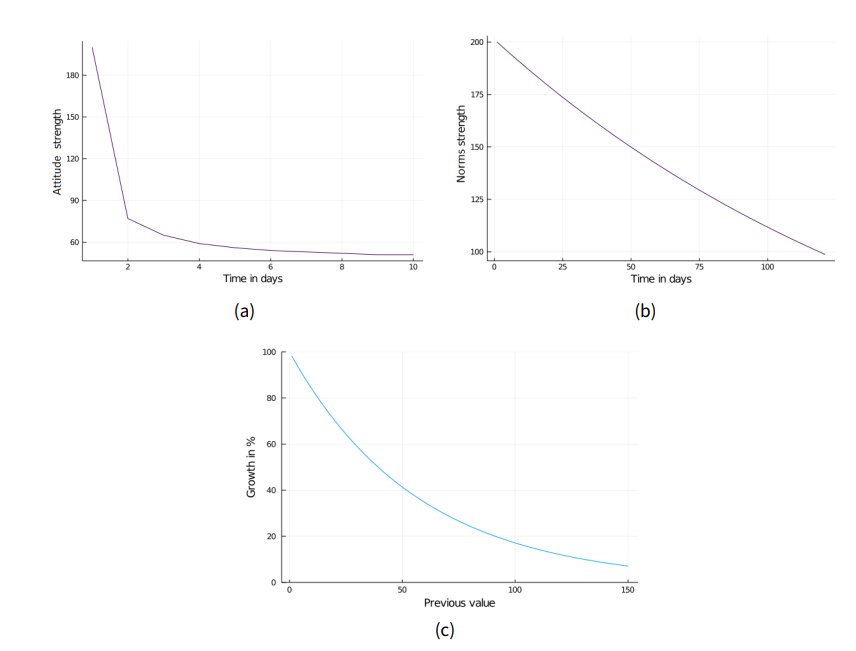
The model states that a stimulus leads to a strong learning effect at the beginning and that this learning effect decreases the closer the current association is to the strongest possible association. This is also referred to as bounded growth. After a stimulus is presented, the strength of the association decreases rapidly at first and then more and more slowly (Rescorla & Wagner 1972). This process is also referred to as extinction. The model consists of a two-phase model for the association and extinction of fear (see Figure 2).
The model explains attributes such as fear that remain active long after the presentation of an initial stimulus. At each step, the agent checks whether it has been exposed to a stimulus and updates its association strength accordingly. In Epstein’s model, agents have a limited radius from which they retrieve information.2 Thus, agents form their opinions (cognitive component) based on spatial sampling. In addition, agents have memory and compute a moving average estimate of events that were within their sample radius. The cognitive and affective component combined form the solo disposition, i.e., the disposition of the agent without social influence. The social component is based on a network transmission model in which individual dispositions are weighted and added up and determine whether an action is performed. It is not the behavior, but the disposition for an action that ensures that other agents perform an action. Overall, the agent considers both its own disposition and a weighted sum of the other agents. If the resulting disposition is greater than a threshold, the agent acts.
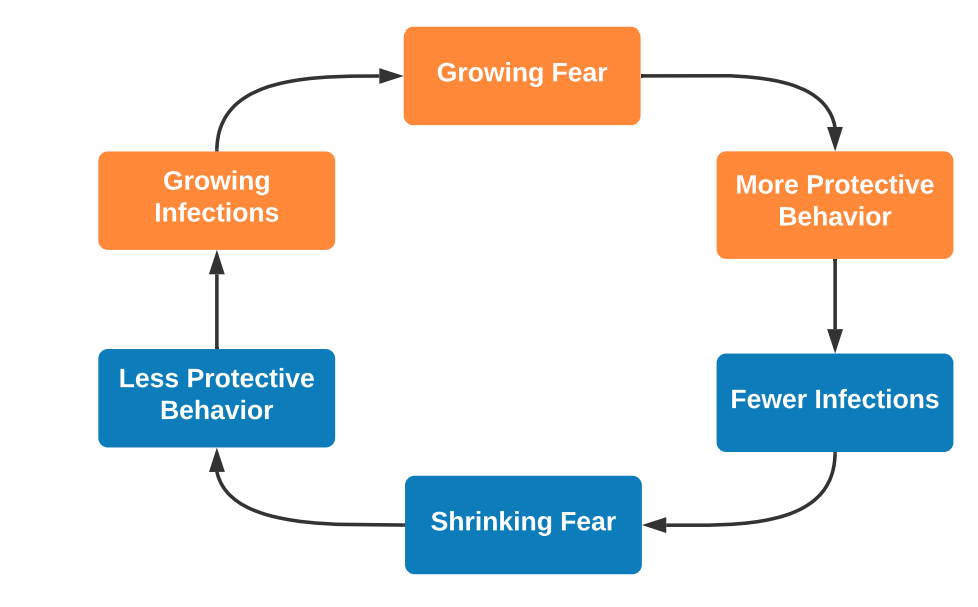
Epstein’s model focuses on phenomena such as fear and violence as action, but can be applied to other contexts as well. Fear can lead to behaviors such as social distancing or self-quarantine, which can alter the course of an epidemic. Epstein also points to this possibility and suggests that this mechanism may be responsible for various ripples that can occur during epidemics. For example, fear could lead to protective behavior that reduces average infections, which in turn reduces fear and thus protective behavior, leading to a new wave of infections. Thus, the model is very well suited as a basis for our developed model. Epstein’s model provides an approach to modeling growth and decay of dispositions toward a stimulus, as well as how these dispositions can be modeled in individuals and networks.
Our contribution
Our model builds on the aforementioned models and incorporates the identified stylized facts. The model represents the ongoing COVID-19 epidemic in an exemplary German city, Aachen. It incorporates infection and agent modeling insights with mechanisms for behavior change based on information. With a conceptual model of cognition, the model allows for a balance between realism and meaningful abstraction, limiting modeling and data requirements and allowing the model to be applied to other diseases. This way, infection behavior can be modeled realistically without making the model overly complex, while agent behavior and spatial detail should as of now be kept at a conceptual level in order to balance complexity and computational efforts.
Method
Our model simulates the spread of COVID-19 in a German city starting on Februar 14, 2020, and the influence of media and individual behavior change on this spread. We formulated the following goals for agent behavior and properties: agents must have realistic demographic properties, a realistic day-to-day behavior and exhibit realistic behavior changes. While keeping in mind that the model should allow a large-scale simulation, several aspects have to be tackled to generate a model with the desired properties.
First, the model should incorporate the diversity of human demography, attitudes and behavior in Germany. Second, the modeled infection should exhibit similar properties as the real infection and generate a similar spreading pattern. Third, the cognitive architecture driving agent behavior should lead to patterns that mimic empirically observed patterns of human behavior.
The influence of media and communication is incorporated to evaluate whether they can help with curbing the spread of the epidemic. Our model builds upon the important findings of the TELL ME project and its modified behavior model (Badham & Gilbert 2015), the fear model of Epstein (2014) and the incorporation of media.
The media aspect is realized in the form of messages to the population that communicate behavioral guidelines, acceptance rates and the progress of the epidemic. The terms messages and communication are used to refer to the parametrized media in form of messages.To avoid confusing different terms, we highlight model parameters and proper names in italics. The model parameter protective behavior is shortened in the running text to behavior, social norms is shortened to norms to facilitate reading and reduce redundancy. Since half-life decay is the central component for the extinction of attitudes (Epstein, 2014), the extinction process is also referred to as decay. The presented model is referred to as Bounded Fear Growth model, abbreviated as BFG model.
Model features
Subsequently, we describe the distinct features of our models and explain why we decided on certain model dynamics.
In Table 1, we list values we chose for different model and agent parameters and state variables.
| Description | Value | Source |
|---|---|---|
| Initial attitude towards protective behavior | Sampled from \(N(\mu = 55.52,\) \(\sigma = 16.54)\), adjusted for age and gender | YouGov (2020a) |
| Wealth | Sampled from \(B\) prime distrib. \((\alpha = 2.29, \beta = 108.029)\), transformed to match average spending capacity | Institut der Deutschen Wirtschaft (2016) |
| Household size | Sampled proportionally from \([1,5]\) | Statistisches Bundesamt (2011) |
| Workplace size | Sampled from Rayleigh distribution (\(\sigma = 96.31\) ), based on average office sizes | Stottrop (2007) |
| Number of close friends | Sampled from \(N(\mu = 11, \sigma = 3)\) | SINUS-Institut (2018) |
| Number of acquaintances | Sampled from \(N(\mu = 20, \sigma = 5)\) | Assumption |
| Fraction of population receptive to norm and attitude messages | \(90\%\) | Infratest Dimap (2020) |
| Frequency of normative media messages | Once a day to every 10 days, based on empirical frequency | GDELT Project (2020) |
| Frequency of media messages influencing attitude | Once a day to every 10 days, based on empirical frequency | GDELT Project (2020) |
| Base probability to interact with friends | Weekday: \(10\%\), weekend: \(30\%\) | Assumption |
| Probability of working on the weekend | \(27.6\%\) | Statistisches Bundesamt (2019) |
| Probability to skip social activities during lockdown | \(90\%\) | Assumption |
| Probability to stay home from school during lockdown | \(100\%\) | Assumption |
| Probability to work from home during lockdown | \(49.8\%\) | MAGS NRW (2020) |
| Probability to skip social activities after lockdown | Decreases by 2% per day | Assumption |
| Probability to return to the office after lockdown | Increases by 2% per day | Assumption |
| Direct contact infection rate with protective behavior | \(3.66\%\) | Chu et al. (2020) |
| direct contact infection rate without protective behavior | \(9.5\%\) | Chu et al. (2020) |
| Indirect infection rate when using public transportation | \(3\%\) | Mossong et al. (2008) |
| Intra-household infection rate without protective behavior | \(16.3\%\) | Li et al. (2020) |
Agents and mapping
We programmed the model in Julia (Bezanson et al. 2017), with the Agents.jl package (Datseris et al. 2021) providing fundamental functions. Julia provides high computing power and enables the integration of several data sources.
Typically, disease models use contact networks to identify who infects whom. However, accurate data on such networks are rare. Therefore we created a spatial structure and the commute routes that are mainly based on empirical data. In our model, the number of friends and acquaintances is also empirically grounded. To minimize the impact of minor changes in the network, we build the network in several layers. Each agent is placed in closed friendship networks (cliques), closed (but larger) acquaintance networks, and agents pick schools (or workplaces) in their spatial vicinity. This should prevent the existence of critical nodes with high centrality that are connected to a lot of other nodes. It is also unlikely that the network will have isolated components. It also assumes no large gathering occurs. We picked these assumptions, because they would have no drastic impact on viral spread in different simulations. This assumes that there are no or few super spreading events, which reportedly was not the case in the first wave of the pandemic.
We generated the model space as a network of streets (edges) and intersections (nodes) from a given location and its OpenStreetMap (OpenStreetMap Foundation 2020) representation. We converted a given .OSM map to a node network that replicates real-world streets and their intersections.
This map is then filled with agents whose age, gender and population density is based on the German Census 2011 (Statistisches Bundesamt 2011). The Census 2011 provides information like age and gender about the inhabitants of Germany on a per-hectare basis. The generated agents are then grouped together in households ranging from one to five persons (single households, couples, and families) in proportion to the distribution of household sizes in Germany (Umweltbundesamt Bundesrepublik Deutschland 2017). Furthermore, agents receive a wealth property based on a BetaPrime distribution (Mirzaei et al. 2019) with a sample mean of the average spending capacity (purchasing power) per state (Institut der Deutschen Wirtschaft 2016).
Workplaces are randomly distributed across the map and agents between 18 and 65 years are then assigned to the preferably closest workplace. The workplaces employee capacity is determined by a continuous distribution based on the survey of office sizes of Stottrop (2007) divided by the default space per worker of 15 sqm in accordance with BAUA (2013) guidelines. The wealthier an agent, the smaller is the workplace he is going to work at, possibly resulting in contacts with fewer agents and therefore a decreased infection risk. This approach reflects that low-and middle-income workers are more at risk by COVID-19 than those with higher income due to less social protection measures and limited access to health services (International Labour Organization 2020).
Agents between five and 18 years are assigned to the closest school. Schools are generated based on real locations denoted by the corresponding OpenStreetMap tag and do not have a capacity limit.
To represent social behavior, agents are assigned a group of close friends (\(\mu = 11, \sigma = 3\), SINUS-Institut 2018) and a twice as big circle of acquaintances (\(\mu = 20, \sigma = 5\)). On average, people interact with their friends once to multiple times per week (Blom et al. 2020), which is incorporated as selecting 10% of the population on a daily basis to engage in social or distant activities. On weekends this rate is set to 30%.
We generated a daily routine for each agent from the aspects work or school, social group, distant group and home. Agents move up to four times per day (towards and back from work/school, towards and back from social or distant activities). The probability of going to work on the weekend is reduced to 27.6% following the data of Statistisches Bundesamt (2019), concerning the average probability of working on the weekend.
At the last step of the agent generation, the base attitude towards protective behavior is computed. Based on the trust in the health care system (YouGov 2020a), attitude is modeled as a normal distribution (\(\mu = 55.52, \sigma = 16.54\)). Here, trust is understood as general confidence in a working health-care system, which in turn makes individuals more receptive to governmental information and instructions with regard to health-protective behavior. The sampled attitude is then adjusted so that women exhibit slightly less trust (Perrotta et al. 2020) and trust also decreases with age (Guerrero et al. 2015). Overall, trust in our model represents a rather constant perception of the overall state of the healthcare system and is only influenced by news reporting.
Figures showing the distributions determining the attitude, workplace sizes, daily contacts and maximum workplace size per agents can be found in the Appendix (Figure 18).
Infection parameters and disease progression
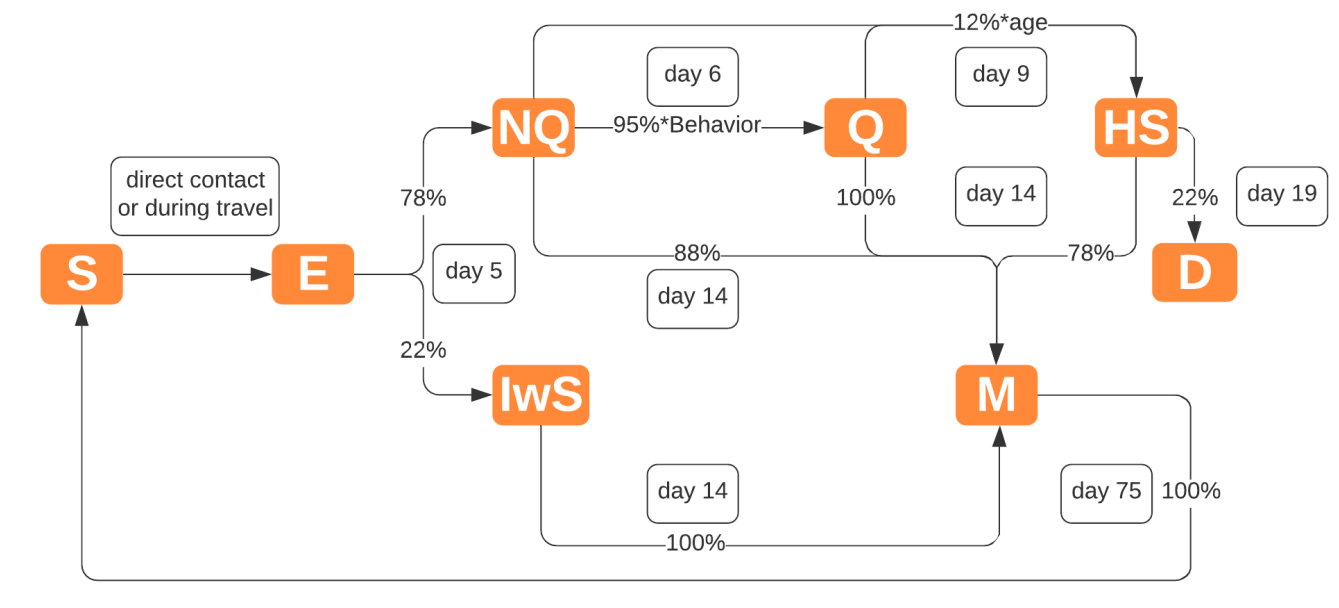
The infection stages used in the model are an extension of the SEIR model so that the daily routine of agents is represented adequately with regard to the lifecycle of the infection. Figure 3 depicts the generated extension of the SEIR model with the individual states of the disease and the transmission probabilities and time periods between them. The states of infection and their explanation can be found in Table 2. Information regarding the infection parameters is mostly based on the Robert Koch Institute fact sheet, which consolidates studies regarding the COVID-19 epidemic (Robert Koch Institut 2020b).
| Abbreviation | State | Description |
|---|---|---|
| S | Susceptible | Initial population |
| E | Exposed | Agents exposed to the virus |
| NQ | Not Quarantined | Agents that show symptoms and are not in quarantine |
| IwS | Infected without symptoms | Agents that carry and spread the virus, but do not exhibit symptoms |
| Q | Quarantined | Agents with symptoms that undergo self-quarantine |
| HS | Heavy symptoms | Agents in quarantine with strong symptoms |
| D | Dead | Deceased agents |
| M | Immune | Agents that overcame the infection and are temporarily immune |
Several factors influence the risk of infection between agents. The main factor is the protective behavior of an agent, which decreases the risk of infecting others (as quantified by Chu et al. 2020) by adopting health-protective measures like wearing masks, keeping a safe distance and regularly washing hands. Behavior also influences one’s decision to partake in social activities, where agents with active behavior are more likely to skip these interactions. Furthermore, agents can choose to reject to self-isolate and therefore risk infecting others based on their behavior.
Travel to and from activities also poses a risk of infection by indirect contact, influenced by the agents wealth. This captures that less wealthy persons are more likely to use public transport (Governing.com 2012), which increases contact with others on the route. Wealth also indirectly increases the risk of infection since wealthier agents favor workplaces with less employees, resulting in less contacts on average at the workplace. Furthermore, age indirectly influences infections risk since the number of daily contacts relevant to infectious diseases differs between age groups (Mossong et al. 2008).
Initially, all but a predetermined number of Exposed agents are Susceptible. By direct contact (at work/school, home or social activities) or indirect contact (travel) with infected agents, agents become Exposed to the virus. The infection process is modeled as a Bernoulli process with the number of contacts in the same node and the given infection rate (3.66% for active behavior, else 9.5%, Chu et al. 2020). For each successful draw, a random agent from the node is selected and modeled as Exposed.
For infection via travel, infected agents add their traveled edges to a pool of infected edges. The infection risk is modeled as Bernoulli trial with the number of "contaminated" edges on the agents route as samples and a risk rate adjusted by the share of daily contacts of travel (3%, Mossong et al. 2008) and a wealth factor of the difference to the mean income.
Infected agents become Exposed and transition to either Infected without Symptoms (22%) or Not Quarantined (78%) after five days (Robert Koch Institut 2020b). A day after symptom onset, agents move to Quarantine. A 5% percentage is assumed as deviant, influenced by the agents’ behavior. All agents in the household also become Quarantined, as this is the recommended behavior in Germany. Quarantined agents stay in their home and do not travel across the map. However, a 16.3% risk of infecting other agents in the household exists (Li et al. 2020), which can be lowered by behavior.
12% (Robert Koch Institut 2020a) of Quarantined and Nonquarantined agents are at risk of developing heavy symptoms after four days from symptom onset (Robert Koch Institut 2020b). The individual risk increases with age (Robert Koch Institut 2020a) which is modeled as a linear growth with a baseline of 35 years. After ten days treatment, 22% of the agents with heavy symptoms decease (Robert Koch Institut 2020b). Agents in quarantine, not in quarantine and infected without symptoms overcome the infection after 14 days (the average infection period according to Robert Koch Institut 2020b). Immune individuals become susceptible again after 75 days, based on the findings of Long et al. (2020) who identified an immunity period of two to three months. Absolute cases, percentage of the population infected and the logarithmic growth rate (K) are used to evaluate infection growth.
Behavioral model
The agent’s health-protective behavior is a central aspect of this model as it has a large impact on infection risk and number of daily contacts. A day is divided into four steps of move and infect stages. First, the movement is computed, then infections, fear and behavior. On their daily schedule, agents move to their workplace, school, social nodes and back home. Agents above the behavior threshold can skip the step for social activities during the lockdown period (6th March 2020–24th April 2020) with a 90% chance. Schools are assumed to be closed during the lockdown. Attending the workplace, e.g., the office, is avoided with a 49.8% chance (Arbeit, Gesundheit und Soziales des Landes Nordrhein-Westfalen 2020). The model allows to set up these three dynamics (contact reduction, school closure, home-office mandates) separately so that it is possible to account for various lockdown measures for future research.
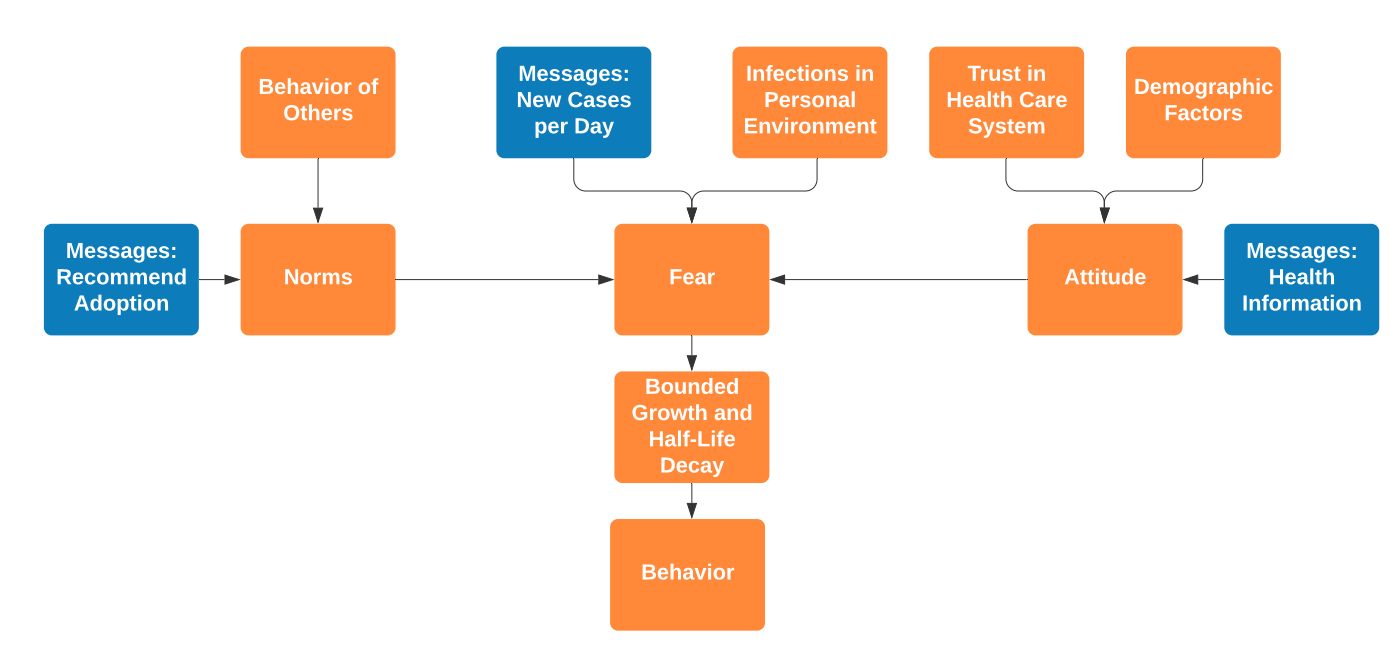
The behavior model is composed of three main components: social norm, attitude and fear. Attitude is the base attitude towards protective behavior, which is determined by trust in the health care system and demographic factors. Fear models the perceived risk the infection poses to the agent and his surroundings. Social norms represents the average behavior of other agents in the same nodes. Figure 4 shows the interaction of these components and how they constitute the agents behavior.
The behavioral model is based on the approach from the TELL ME model (Badham & Gilbert 2015), which uses the three individual factors as following:
| \[behavior = attitude+\frac{norm}{4.5}+fear\] | \[(1)\] |
This assumes equal influence of the three factors. However, evidence points to fear being a major influencing factor for protective behavior during the COVID-19 epidemic (Harper et al. 2020), even a dominant emotional response in time of crisis (van Bavel et al. 2020). Fear appeals are shown to positively influence protective behavior (Tannenbaum et al. 2018). To give justice to the precedence of fear over the other factors, the equation is adjusted to:
| \[behavior = \frac{attitude+norm}{2}*\frac{fear}{100}\] | \[(2)\] |
The changed equation reflects the importance of fear. By adopting fear as multiplier instead of a summand, fear acts as a moderator which can cause an otherwise incompliant person (by attitude and norm) to adopt behavior (and vice versa).
Social norms are computed as the average behavior of other agents in the same node during the "work" step, which can be the household, classmates or work colleagues. Agent attitude is computed at the model initialization as described in Section 3.6. Additionally, like the fear component, both these components are influenced by input from news media which is described in Section 3.32.
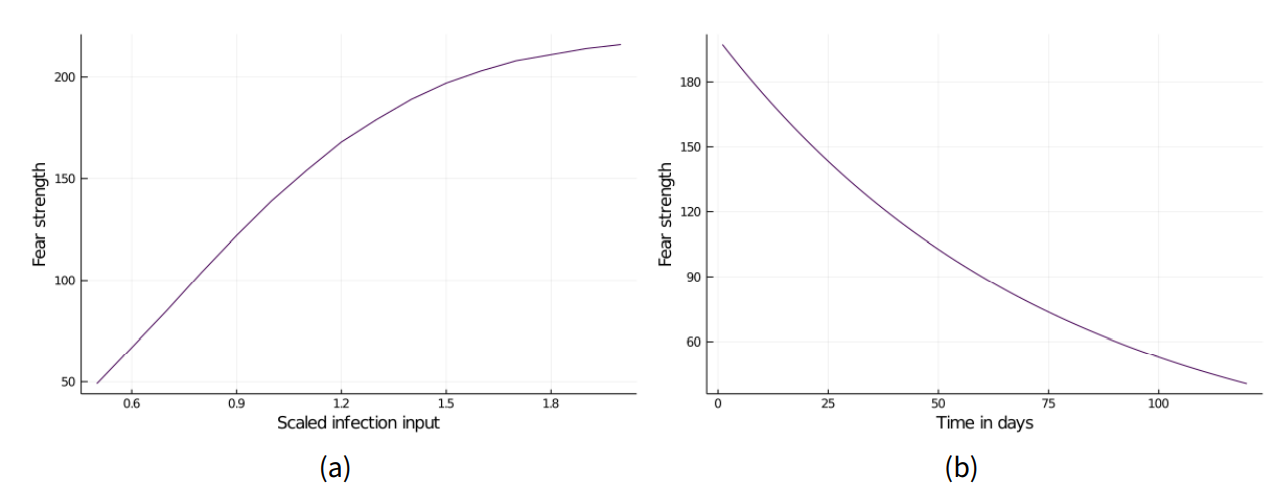
The fear factor is based on the number of reported daily cases and infected acquaintances of the agent. The total number of daily infections is divided by the total number of agents for normalization. This approach is derived from the cumulative incidence as used by Badham & Gilbert (2015), and is also supported by Murray & Schaller (2012), which find that the cumulative incidence of infections is linked to behavior and conformity. The second component, infected acquaintances, is linked to the local incidence of the infection, which influences the perceived fear (Badham & Gilbert 2015). Here, the growth of active cases in the personal environment (adjusted by a correction factor) is used since now agents directly experience the infections. We model fear as only dependent on local information (infected acquaintances) and global information (new cases per day), as seen in Funk et al. (2010). Other factors could be age (since risk grows with age) or death rate (which is dependent on general health care system capacity and environmental factors amongst others). This would however firstly introduce a lot of complexity. Secondly, we want to focus on fear as stimulus, which we emphasize is not directly dependent on the risk for the individual. The assumption of fear as dependent on the increasing stimulus of cases allows to draw the analogy to the Rescorla-Wagner model as applied by Epstein (2014)
Together, the factors attitude, fear and social norms provide a balanced threat response. However, a central issue identified with common threat models is the linear growth of fear with infections. To address this problem, the approach of bounded growth and half-life extinction as presented by Epstein (2014) is applied as follows:
| \[\textit{fear} = 100*2.2*(1-exp\left({-\textit{global cases} * \textit{personal cases}}\right))\] | \[(3)\] |
The fear decay is, as used by Epstein (2014), adopted from the regular half-life equation. It is activated when fear growth has peaked (three days of less than 4% growth) and computed as follows:
| \[\textit{new fear} = \textit{old fear}*(1-exp\left(\frac{-\textit{time}}{150}\right))\] | \[(4)\] |
Communication
As Funk et al. (2010) find, information can significantly change the behavior of individuals, with studies such as (The dynamics of risk perceptions and precautionary behavior in response to 2009 (H1N1) pandemic influenza) and (Legacy and social media respectively influence risk perceptions and protective behaviors during emerging health threats: A multi-wave analysis of communications on Zika virus cases) finding a positive impact of news on protective behavior. We assume a positive influence of news and model this information with influence on each behavior component.
Agents receive periodic input from news media in form of messages to represent the influence of media appeals. Two types of messages are set up: First, a channel that provides infection case number to the agents, informing them of the global infection. The second message type influences norms and attitude by representing appeals to the population that increase adoption of protective behavior. To simplify the representation of news, we use a keyword-based approach to evaluate those appeals. The frequency of appeals is based on the frequency of certain keywords (see the Appendix) on the press and media database GDELT for German articles (GDELT Project 2020). Note that during the initial stages of the pandemic modeled here (starting February 2020), COVID information was connoted very positively, whereas the infodemic stage only began later. This motivates the positive interpretation of the mention of keywords as increasing trust.
We chose to capture articles mentioning behaviors like washing hands or wearing masks to implement communication that has the potential to influence social norms (Dickie et al. 2018). To capture news influencing the agents attitude towards the healthcare system, the attitude keywords aim to capture news related to the virus and its spread. The number of messages captured for each message type is translated to a frequency ranging from one to ten. Each day, if \(\textit{current day }\%\textit{frequency}= 0\), a message is sent. This ensures that with higher frequency, more messages are sent, while also incorporating a certain randomness.
For norm and attitude messages, 90% of the population are modeled as receptive (Infratest Dimap 2020). The growth of both properties is governed by
| \[\textit{new property} = \textit{old property}*\left(1+exp\left(-\textit{scaled property}\right)\right)\] | \[(5)\] |
| \[\textit{new attitude} = \textit{current attitude}*exp\left(-\frac{\textit{current attitude}-\textit{prior attitude} }{\textit{correction factor}}\right)\] | \[(6)\] |
The greater the difference between current and prior attitude, the greater the decay. The norm growth by messages decreases globally with time.
| \[\textit{new norm} = \textit{current norm}*exp\left(\frac{-\textit{time}}{\textit{correction factor}}\right)\] | \[(7)\] |
We want to address here a distinction between our model and the real world: In the model, we assume media to objectively represent infection dynamics and transport normative messages that encourage protective behavior. There is evidence that exposure to news does stimulate such behavior (Jiang et al. 2021; Tukachinsky Forster & Vendemia 2021). However, the influence of news media as well as social media in the real world is obviously more complex and ambivalent: For example, US news were found to be highly polarized and politicized (Hart et al. 2020) which possibly inhibited protective behavior (Hubner 2021). More than that, the spread of misleading and downright false information termed infodemic by the WHO might lead to dangerous and even harmful behavior (Naeem et al. 2021). Therefore, modeling the news media as only positively influencing protective behavior is clearly a simplification. As our model covers only the beginning of the pandemic in Germany, we argue that this simplification is still valid: Similar to our model assumption, at this time German news media was rather unified in transporting such normative messages and supporting government action (Müller 2021). Relatedly, movements protesting COVID-19 protective measures and spreading misinformation only gained a large following in the summer of 2020 (Jarynowski et al. 2020). Nevertheless, model efforts covering different periods of times and countries with a different news landscape might need to include a more elaborated mechanism of media influence.
Model Analysis
For model calibration, we compared the face-validity of the model results with real-world data. While other researchers use death counts to calibrate and validate their models, we chose to use infection counts although those depend on the testing capability. On the other hand, deaths depend on health care system capacities and here, Germany is exceptionally well equipped. Deaths were minimal during the first wave of the pandemic, which is the phase our model tries to replicate (Villani et al. 2020). Smaller numbers are more sensitive to noise in the data, which in our case makes incidence a better metric. The real-world data for infection counts stems from Esri Deutschland GmbH (2020). For our analysis, we assume that the general infection trends in Germany are representative of those in the city of Aachen. The German case counts were scaled to fit the agent population of our model. The adoption of protective behavior is based on Blom et al. (2020), which shows peak protective behavior on the 16th March 2020 and slow decay afterwards. Since this data is not detailed enough, we complemented it with the mobility data as compiled by Apple (2020). The shown trend matches Blom et al. (2020) and additionally provides detailed data on a day-to-day basis. The time series is inverted from "activity levels" to correspond to the growing adoption of protective behavior. The fear trend of the population is based on a web survey by YouGov (2020b), which depicts the levels of high or very high fear regarding COVID-19. Since the survey started only after the virus began spreading in Germany, two weeks of fear levels were prepended extrapolated from the observed exponential growth phase. We discuss the validity of the fear levels further on in Section 5.7.
Face-validity is a subjective judgement of model behavior and often used as first validation step (Heath 2010; Myers & Davis 2007; Xiang et al. 2005). As additional, objective measurement, Mean Average Percentage Error (MAPE), Mean Average Error (MAE) and Root Mean Square Error (RMSE) are used. The MAPE is prone to too much sensitivity for small values, which is balanced by the MAE which favors a prediction with correct Median, and the RMSE which better captures intermittent peaks (Vandeput 2019).
The lack of validation and testing procedures for ABMs (Guercan et al. 2013) poses a problem for the hypothesis evaluation. We use a t-Test (Welchs’s t-Test for unequal variances) when comparing model results for similarity as recommended by Lee et al. (2015). For the comparison to real world data, we use face-validity and the observed measurement errors (ME). The model infection trend is therefore compared with (adjusted) real world infection data. 40 model runs are computed for each configuration and the results bootstrapped (5000 samples) to improve the estimates and calculate reliable confidence intervals.
We use the logarithmic growth rate of the infection, computed as
| \[K = \frac{\textit{d} ln(\textit{N})}{\textit{dt}}\] | \[(8)\] |
Verification, validation, replication
We verified that the model corresponds to the concept and that the model corresponds to the real-world data. The code and data are provided on an OSF repository (OSF 2020) at https://osf.io/axv6q/for inspection.
The micro and macro behavior of the model were tested repeatedly during the development of the model. The conceptual model and its goals are described in the method chapter. Since the aspects of realistic day-to-day behavior, demographic properties and behavior changes are incorporated, we consider our goals to be fulfilled. By using the census, realistic and diverse demographic properties are incorporated into the model. Similar infection spreading patterns as seen in the real world with exponential growth phases are also captured. The cognitive architecture reacts to rising infections with protective behavior and the growth curves correspond to the Rescorla-Wagner pattern (see Figure 21). This support the assumption that the implemented model corresponds to the conceptual model.
The model was validated against real-world trends of fear, behavior and infections. The model behaves reasonable in different regions and is therefore generalizable to countries with comparable social structures, health care system and value norms as Germany. The model was calibrated by comparing the average results of eight runs to real-world data and judging the face-validity as well as MAPE. The calibration results are presented in the Appendix (see Table 3).
During the validation process with bigger agent populations and in different landscapes (the district of Aachen and Rostock, up to 67,939 agents), we noticed that the model results were not valid. The decay of infection growth was mainly caused by a lack of susceptible individuals, not protective behavior. Instead, more protective behavior led to fewer cases (see Figures 21 and 22). After updating the fear computation and implementing a lockdown release, the face-validity and macro-behavior was improved. A sensitivity analysis as performed by Perez & Dragicevic (2009) was performed to evaluate the relative importance of different parameters. The results show a linear and valid reaction to parameter changes (see Table 4).
The model can be replicated by using the source code and data provided on the OSF repository (OSF 2020). The data in combination with further setup-information in the repository allow researchers to adopt this model for further academic use in other regions than Germany.
Model Results
Using our model, we conducted several experiments. The model allows calibrating the results with real world infection and location data. We can derive conclusions about the interplay of fear and protective behavior during a pandemic and generate similar infection and behavior trends as observed in Germany. The model can provide insight on the impact of fear on behavior, and shows an improved fit to protective behavior in comparison to the TELL ME model. While individual agent behavior has a strong impact on the spread of the epidemic, the communication model did not show significant influence.
General model results
We will present three different models with two different scopes: a small city-wide model of Aachen (AC1) and two larger district-wide models of Aachen (AC2) and Rostock (RO2). AC1 will serve as the main model which we will use to demonstrate the general workings of the model as well as the effects of different parameters and configurations. The two larger models AC2 and RO2 are used to demonstrate generalizability and scalability. If not explicitly stated otherwise, any reference to the model or a simulation run will be to the AC1 model.
AC1 is populated in accordance with the German census data we acquired for the city of Aachen. 53.58% of the agents are male and 46.41% are female, 9.4% are under 18 years old and 14.97% are over 65 (Statistisches Bundesamt 2011). The wealth factor is set to 1408, as opposed to a country-wide 1482 (Institut der Deutschen Wirtschaft 2016).
As for the model performance, a simulation of four months within the city of Aachen and 11,325 agents requires 287 seconds, resulting in 2.56 seconds per simulation step. When increasing model scale and size, for example to the district of Aachen and 52,910 agents, a model run requires 7.54 hours and 242 seconds per step.
The age distribution of the infected in the simulation is as follows: 3% under 18, 5% over 65 and 92% between 18 and 65. For infections, the ratios are: 7.43% under 15, 66,94% from 15 to 60, 25,66% over 60 (Esri Deutschland GmbH 2020). The fatalities of the simulation are distributed with 2% under 18, 69% between 18 and 65, 29% over 65. Overall, a 3.6% mortality is observed. For fatalities in the empirical data, the ratios are 0.01% under 18, 4.81% over 18 to 59, 95.18% over 60 (Kremer & Thurner 2020). 95% of infections in the simulation are contact infection, 5% are environmental infections (think: surfaces etc.), as compared to 10% environmental infections as found by Ferretti et al. (2020). On average, 21.05% of the cases are asymptomatic (compared to He et al. (2021), which find an average rate of 15.6% with a CI from 10 to 23%. Overall, these simulated numbers are in line with the empirical data provided by RKI. As of 2021, the updated ratios show a reduced presence of infections and deaths for the elderly, which is likely connected to the ongoing vaccinations and passed first waves.
The model also reproduces an infection risk gap between wealthy and less wealthy agents. The average wealth of all agents is 219, while the average wealth of infected agents is 209.
Model calibration
The parameters in the model are adjusted so that the outcomes of the simulations fit the empirical data for infections, fear and behavior as closely as possible. Two changes are particularly impactful for this purpose: The infection risk was reduced from 1.0 to 0.8 to better capture the empirical development of infections, and the fear growth factor is adjusted to 2.2 to match the empirical fear growth more closely. The calibrated functions are shown in Figure 5, with the strength of the respective behavior (norms or attitude) on the y-axis.
The adjustments increase the model fit in terms of error measures, but lead to some undesirable macro-effects, namely high-frequent oscillations in the infected count that are not present in the empirical data. Figure 6 shows the cycle of mutual influence of the model factors.
Furthermore, in model runs with higher population, the infection growth was unbounded by protective behavior. When running the model for longer periods (>200 days), infections rise up to nearly 100% of the population.
To mitigate these undesirable effects, fear was averaged over a window of six days in order to reduce the volatility of this variable. This was based on Epstein (2014) who also used a moving average computation for fear. Furthermore, the impact of behavior on infection risk was reduced (from tenfold to threefold). Even though this slightly decreases the fit with the empirical data, we reduce the problem of over-fitting and the model generalizes to other contexts much better.
Apart from the above changes, some smaller fixes were applied. To balance out the increased fear growth factor, the fear decay factor was adjusted to 150 accordingly which yields a more realistic decay. The onset of fear decay was adjusted as well so that it is applied after three days of less than 104% growth (see Figure 7).
The adjustments result in less frequent oscillations and show periods of growth and decay as seen in the real-world data. Most importantly, behavior has a long-term impact on the infection curves. The calibrated tables are provided in the Appendix (see Tables 3 and 4).
Infection trends in the model
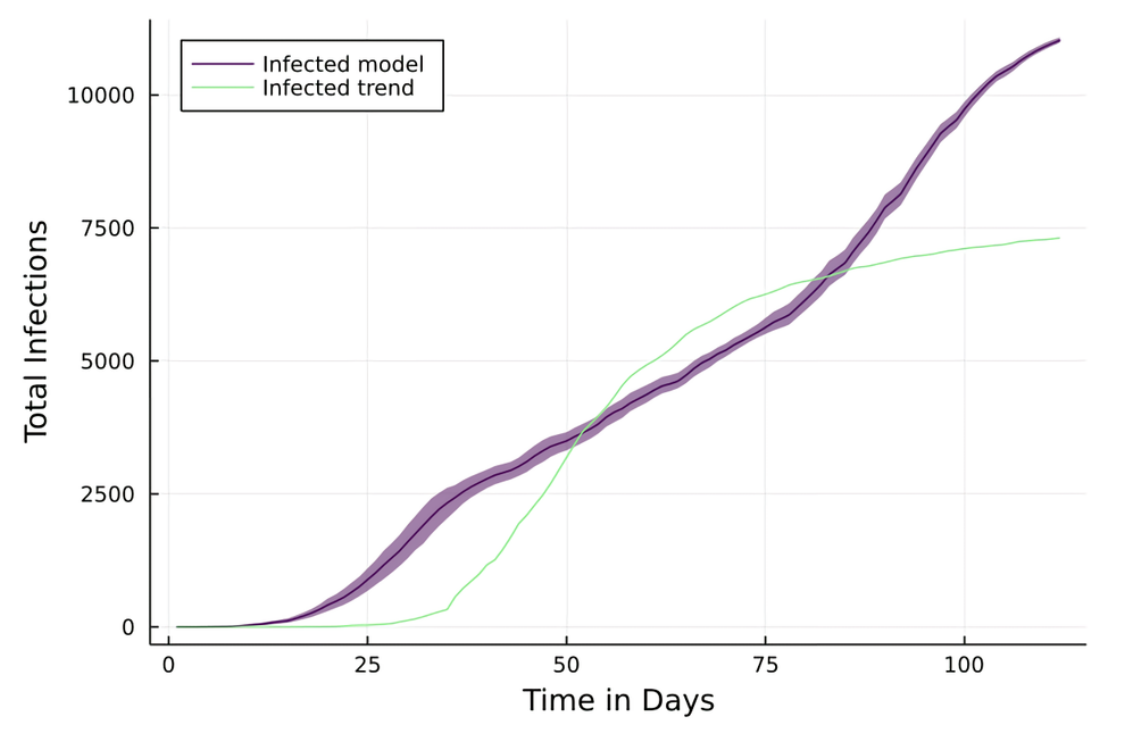
The following section shows the resulting infection, fear and behavioral trends observed in the model and compares them to the real world data. Initially, we will demonstrate how well the presented bounded fear growth (BFG) model can reproduce the infection trends in the empirical data. We can simulate an artificial epidemic that exhibits the desired curve with an initial exponential growth phase that eventually flattens out. In that regard, the model matches the empirical observations well, however, there are two aspects that are reproduced less accurately. First of all, the exponential growth phase starts about 10 days earlier in the model than in reality. Secondly, contrary to the empirical observations, the reopening of workplaces and schools leads to immediate outbreaks and subsequent steady growth (highest K: 5.49).
Specifically, the fraction of infected agents is at 7% on day 25, 29% on day 50, 49% on day 75 and it rises up to 86% by day 100. The MAPE is very high (MAPE = 1173.63) due to a large discrepancy in the beginning, the other MEs indicate a good fit (RMSE = 0.13, MAE = 28%).
To ensure that the model is not specific to the original space of the city of Aachen, we ran it on the map of the full district of Aachen as well. The population density was adjusted accordingly which yielded an agent population of 22,087 agents.
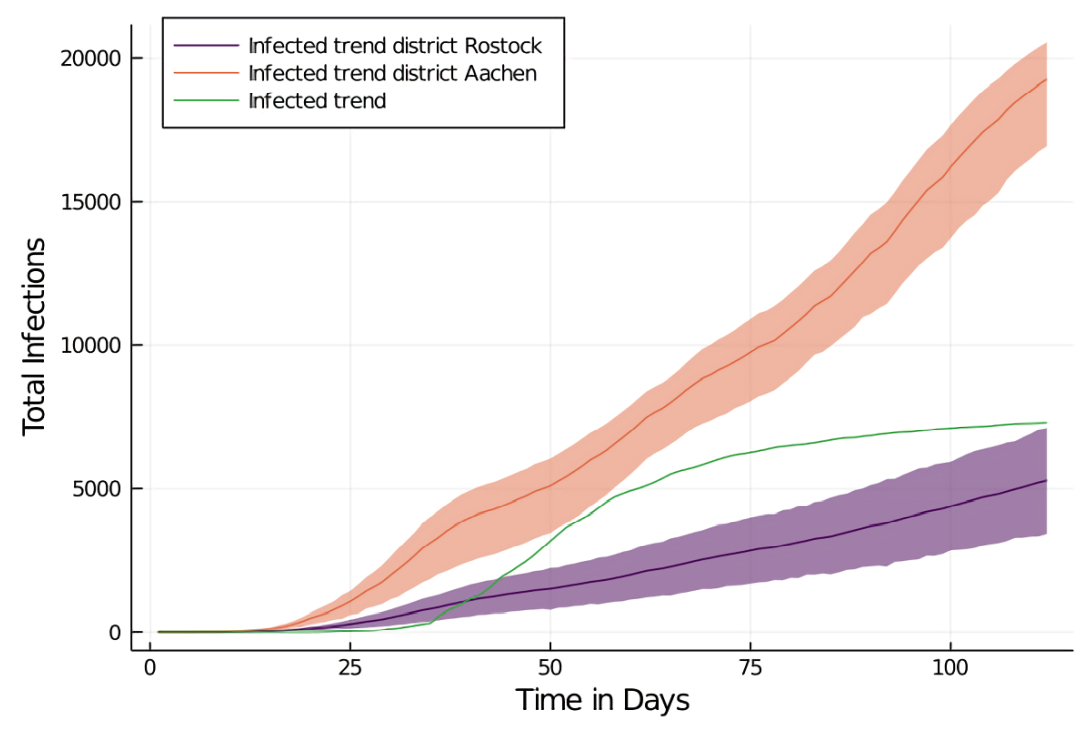
The simulation of infection spread in the AC2 model shows that the first inhibition of the infection spread begins at day 30. Subsequently, the infection spreads slowly, and breaks out again after day 75 with steadily high growth rates between day 30 and 112 (mean K = 0.027). With the infection-curve adjusted, this results in MAPE = 1196.9, RMSE = 0.25, MAE = 98%.
As a second comparison, we ran the model on the map of the district of Rostock too. The district of Rostock provides very different circumstances and provides a good benchmark for the generalizability of the model: It is five times bigger than the district Aachen (3,422.51 km2 vs. 706.95 km2), but has less than half the population (215,794 vs. 557,026). With an appropriate adjustment to the density factor, this yields an agent population of 14,126 agents.
The infection spread in this configuration is significantly slower than in the previous two configurations with the city and the region of Aachen respectively. The growth rate stays continuous after day 40 (\(K \sim 0.2\)) and the first noticeable inhibition of spread occurs at day 30, with a subsequent gradual growth afterwards. The fit according to the error measures is worse than for AC1 (MAPE = 374.84, RMSE = 0.42, MAE = 47%).
Overall, the model is able to produce face-valid infection curves in different spaces. However, it is not able to reproduce the more particular aspects of the empirical trends. For instance, the first outbreak took place too early and there was a second outbreak in the model that was not present within the timeframe of the empirical data.
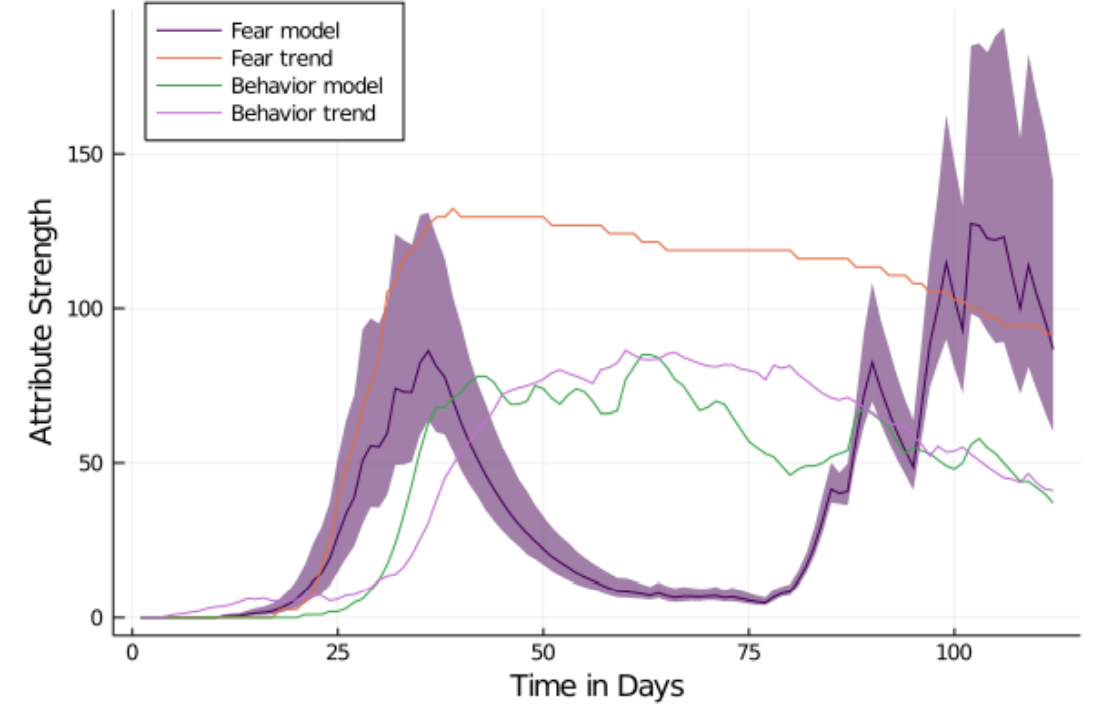
Fear and behavior in the model
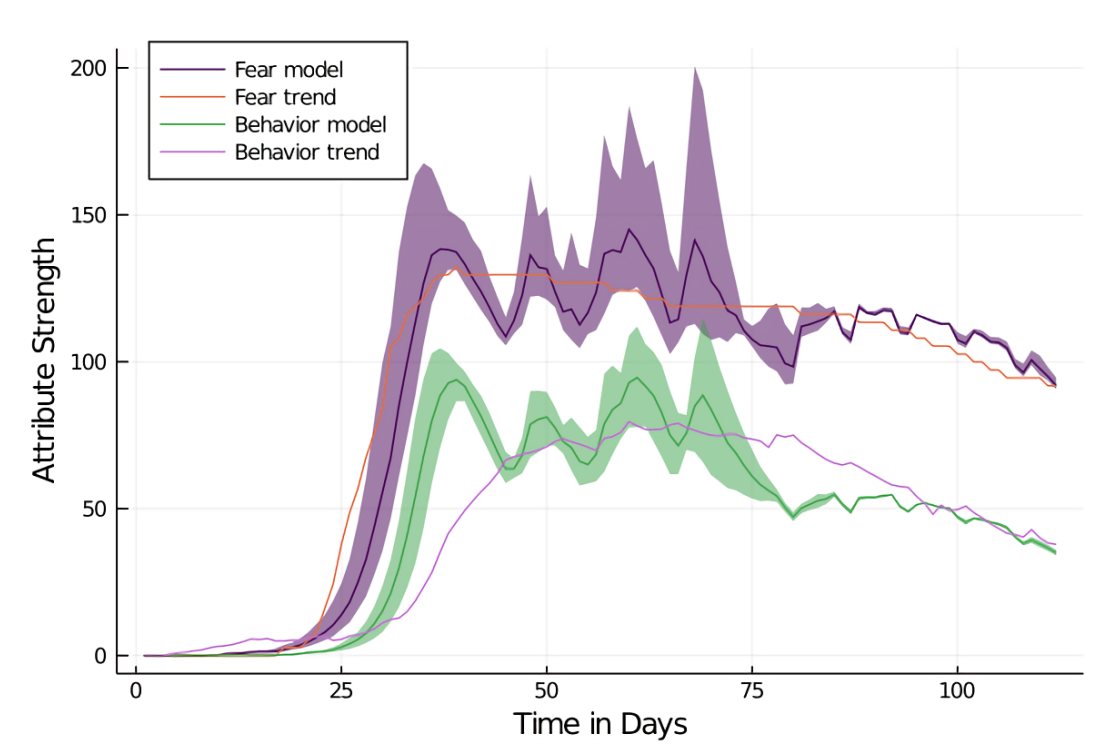
The next objective is to compare the empirical trends for fear and behavior with the ones generated by the model. First of all, we will review the results of the AC1 model with the city of Aachen as a map. Regarding fear, the levels rise sharply after day 20, reaching their peak at day 35 with a subsequent slight decay. This corresponds well to the empirical data (MAPE = 9.44, RMSE = 0.08, MAE = 8%). Behavior yields a similar curve as fear, but with a slight delay and a lower peak after which there is, as for fear, a slight decay. Even though this conceptually satisfies the expectations, the fit with the empirical data is lower for behavior than for fear (MAPE = 40.1, RMSE = 18.18, MAE = 22%).
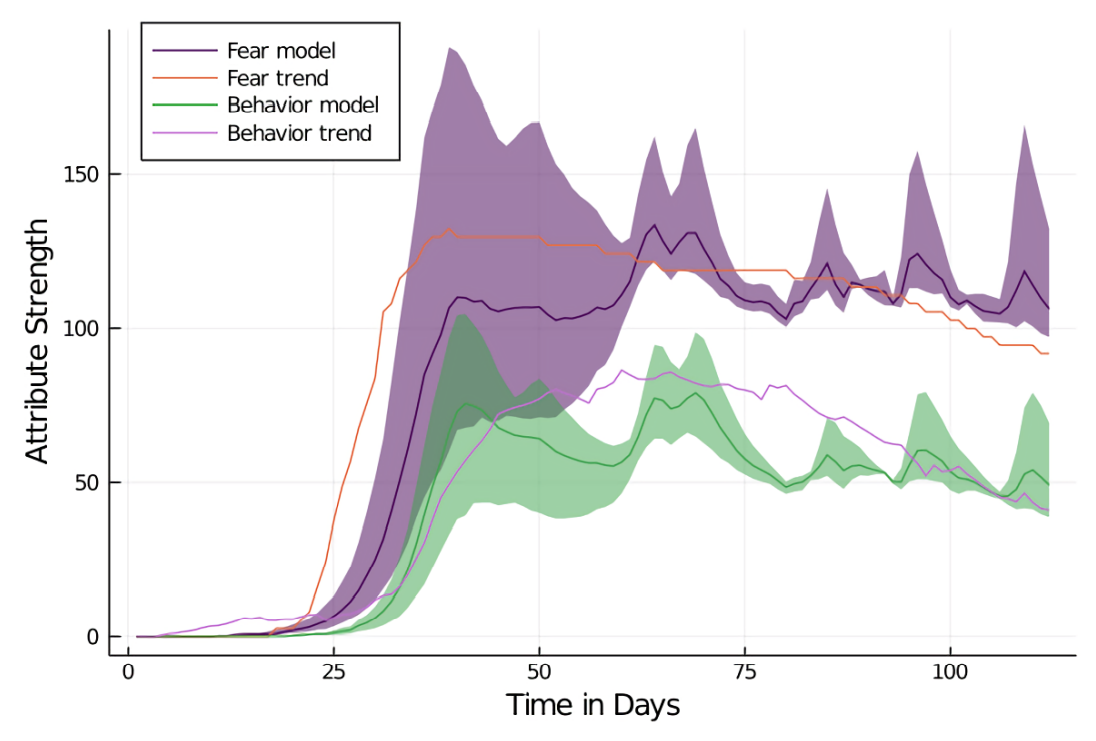
In the district of Aachen, fear and behavior curves show weaker initial growth and less pronounced decay than in the city of Aachen model (AC1). The general trend of both curves is face-valid with MEs for fear slightly lower (MAPE = 17.95, RMSE = 0.16, MAE = 16%) than behavior (MAPE = 36.29, RMSE = 0.16 and MAE = 21%). For both fear and behavior, large confidence intervals are produced. This indicates lots of variance between individual model runs. Variance is reduced substantially in later stages of the simulation.
For the simulation in the district of Rostock (see Figure 24 in the Appendix), both fear and behavior are significantly lower and show decreased fit to the empirical data (fear: MAPE = 49.24, RMSE = 0.81, MAE = 56% / behavior: MAPE = 69.22, RMSE = 1.12, MA = 47%). The general trend shows growth in fear and behavior from day 30 to 40. After day 40, fear grows stronger while behavior only grows slightly. Overall, both curves are not face-valid, but they are more so for Aachen than for Rostock. Overall, fear and behavior show realistic macro behavior.
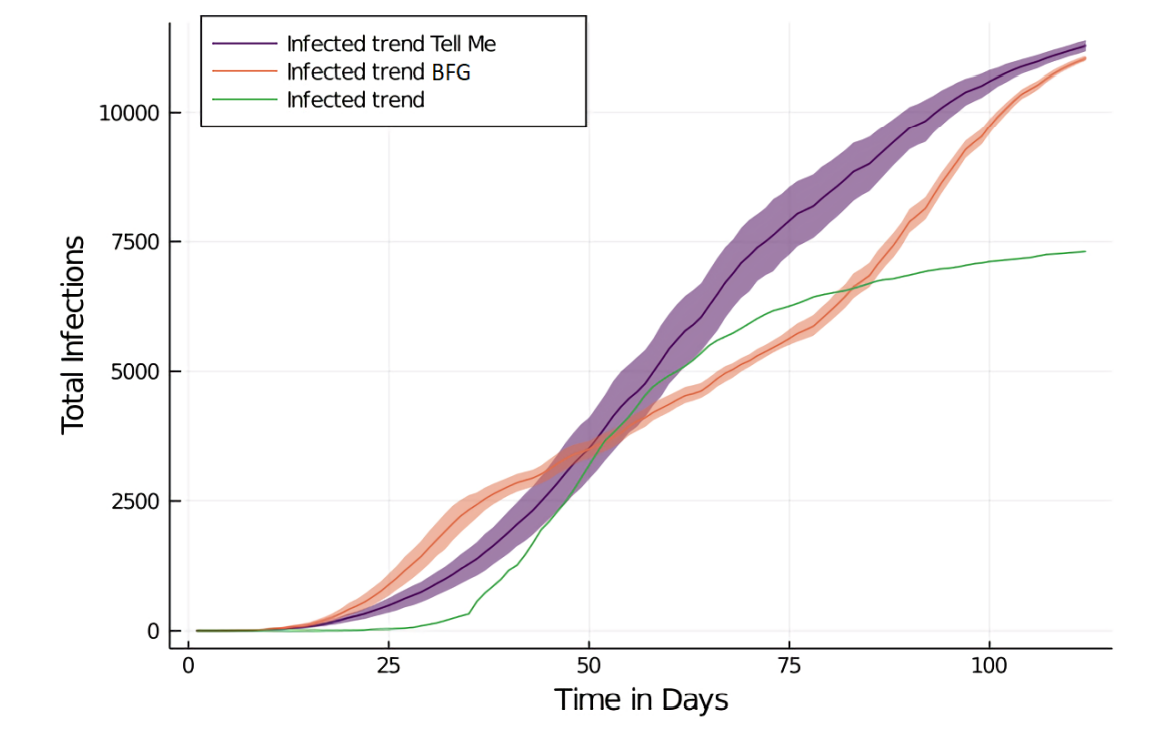
Comparison with the TELL ME Model
Next, we will compare the BFG model with the TELL ME model in terms of their explanatory power with regard to simulated epidemics. The performance will be evaluated in terms of the measurement errors introduced earlier.
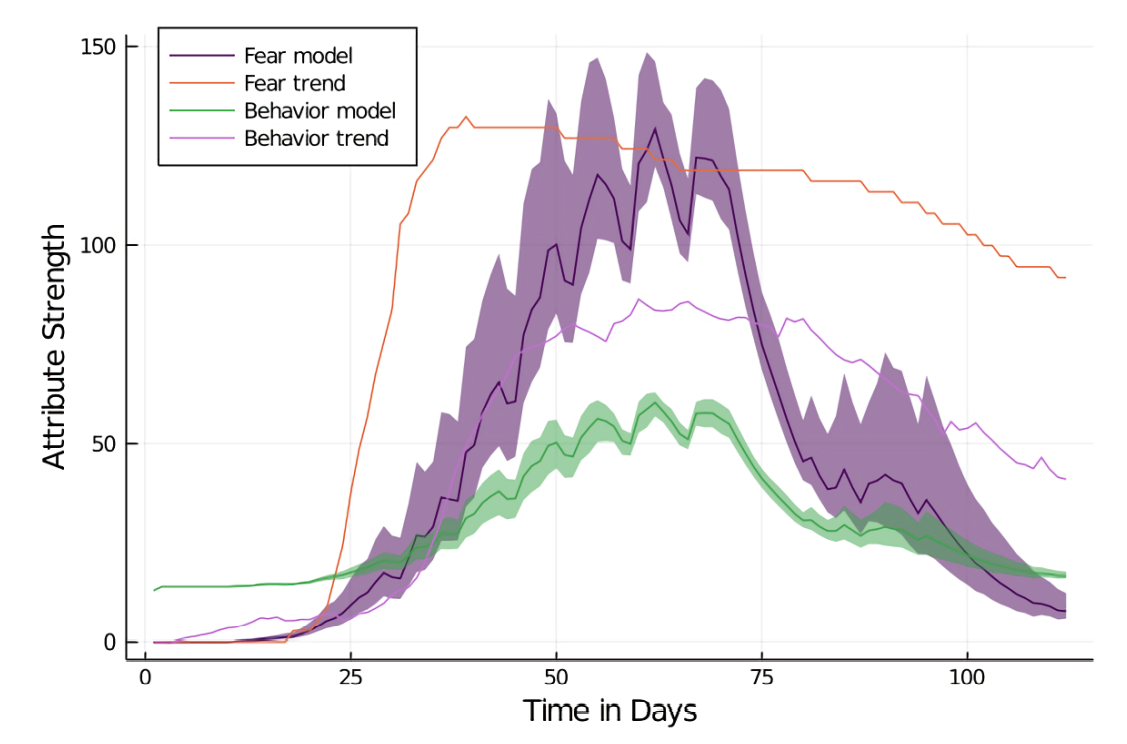
With the TELL ME behavior model, the fear growth starts later than with the BFG model. It peaks around day 60, then declines. The average agent behavior is initially much higher than in the BFG model, but grows only slowly in response to increasing fear.
The performance of the TELL ME model is worse than the BFG model in several regards. The resulting behavior (MAPE = 219.28, RMSE = 0.57, MAE = 50%) as well as the resulting infections (MAPE = 710.29, RMSE = 0.16 and MAE = 36%) have worse fit with the empirical data than the BFG model. Infections grow slowly but consistently and they are not inhibited by protective behavior: The growth rate from day 25 to 100 is steadily declining (day 25: 0.12, day 120: 0.004), the infection rates overall are low as well. The slow infection growth is manifested in lower infection rates for day 25 (4%) in the TELL ME model than in the BFG model (7%) and, conversely, in higher infection percentages in later stages of the simulations (day 50: 31%; day 70: 70%; day 100: 93%). Overall, the results are less realistic and produce higher MEs for behavior and infections when the TELL ME model is applied. The curves differ significantly from the BFG model.
The Influence of individual behavior
We investigate the influence of individual behavior change by running the model with non-individual behavior change, that is, by running a simulation where each agent adopts the same average behavior value. The baseline is provided by the AC1 BFG model (the model that runs on the map of the city of Aachen). We compute the average behavior of all agents at every step and use the resulting time-series in the simulation runs with non-individual behavior change.
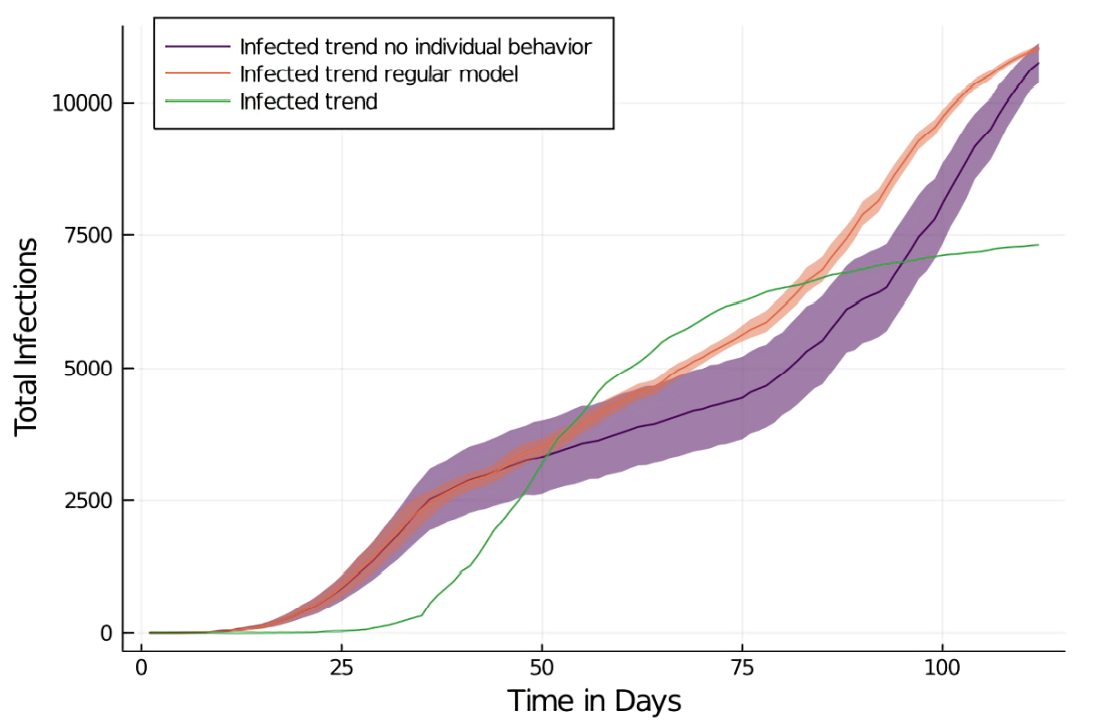
The MEs of the infection spread are similar to a regular run with individual behavior (MAPE = 1093.10, RMSE = 0.12, MAE = 29.32%). However, the eventual infection count is lower than in the BFG model, with 10% fewer infections both on day 75 (39%) and on day 100 (71%), which also results in an overall slightly lower growth rate. The fear levels drop significantly during the period of constantly active behavior from day 30 to 60, where the fear decay furthermore starts to reduce the average fear.
After the reopening of schools and the beginning of the behavior decay (in the regular BFG model) infections and, consequently, fear start to increase again (day 100: \(K = 0.03\) vs. \(K = 0.015\) for the BFG model). The curves exhibit substantial differences. For the simulation with non-individual behavior change, the overall fear and infection trend is flattened and 10% lower infections are observed.
The Influence of media messaging
Lastly, we explore whether the outcome of the epidemic is influenced by the implemented media model. The media messaging in the model impacts norms and attitudes of the agents and for the purpose of investigating their influence, we compared model runs with and without media messages with regard to emerging behavior and resulting infections.
The comparison of both configurations exposes only minimal differences with regard to infection, fear and behavior curves. The infection curve without media messaging has a similar fit with the empirical data (MAPE = 920.56, RMSE = 0.12, MAE = 11%) as the one where media messaging is applied. The same is true for the infection growth rate: It exhibits a similar trend (K = 0.2 for day 40 to 120) as in the model with media messaging. The cumulative infections without messages are slightly lower than with messages (84% at day 100 compared to 81%). Here however, the confidence intervals overlap. The most noticeable difference between both models is the higher variance in the model without messages (see Figures 25 and 26 in the Appendix).
Discussion
In the following, we discuss the performance of our model and the applicability of the behavior and media model. We also evaluate different limitations and propose improvements for future model efforts. Naturally, a complex agent-based model can only test the plausibility of the hypothesized theory and will—on its own—constitute sufficient sole evidence for the theory.
Model results
The results of our study show that our model allows the simulation of the spread of COVID-19 in different locations and exposes valid macro behavior. Our model incorporates two major aspects that we described in the related work section: human behavior change (Funk et al. 2010; Parker & Epstein 2011; D'Orazio et al. 2020) and communication and media structures (Funk et al. 2010). The model can be easily adapted to new regions and population densities (also referred as transferability) and generates a heterogeneous agent population.
The model parameters show that the simulation exhibits realistic infection fatality rates, infection age proportions and incorporates a realistic environmental interaction effect. Agents possess a realistic daily routine and show valid micro behavior when faced with the threat of an epidemic. We calibrated the model to the observed trends of fear, protective behavior, and accumulated infections in Germany. The model is robust to location changes as tested with two different districts in Germany.
Regarding model performance, we can simulate a population of 11.000 agents during a time span of four months in under five minutes. We tested simulations with up to 67,939 agents which required a runtime of 7.7 hours. Based on the tenfold increase, further expansion of the model will likely require the use of high-performance computing.
A sensitivity analysis shows a linear increase with regard to parameters like the number of initial infected, contact rate, and infection risk. This supports the validity of the model by showing realistic macro behavior on the increase and decrease of parameters and no overly sensitive parameters.
The implementation of communication into our model did not have a significant impact on the model results. All differences seen in the model with media communication are within the confidence intervals of the regular model. We nevertheless assume that communication has at least an indirect influence on the behavior of the population, since there is evidence for a correlation between media consumption behavior and COVID-19 risk perception (Guastafierro et al. 2021; Rivas et al. 2021).
Individual behavior change has a significant impact on the outcome of the epidemic. Enforcing homogeneous behavior in the model results in a mitigated infection spread, dissimilar to the observed data. This illustrates the importance of the heterogeneous behavior of individuals for reproducing the course of a disease.
Development of behavior and fear
We positioned fear as one of the drivers for protective behavior which matches empirical findings from the first wave of COVID-19 in Germany (Jørgensen et al. 2021; Stangier et al. 2021). Both the fear and the behavioral curve closely match the observed real-world data (see Figure 11). Optimistically, it seems plausible that our model captures an essence of the underlying psychological, behavioral mechanisms. Pessimistically, we provide a model that is able to explain the observed phenomena qualitatively. However, a number of open question remains:
Firstly, as fear itself is decreasing, are the other factors (i.e., norms and attitude) still sufficiently predicting behavior? Because the model only captures the initial phase of the pandemic, it is possible and even likely that other factors and behavioral drivers have emerged as the pandemic has progressed. For example, Jørgensen et al. (2021) found that self-efficacy was a more stable predictor of behavior than fear, even at the beginning of the pandemic.
Secondly, we have modeled fear as dependent on the observed number of new infections. As already mentioned, this conceptualization combined with a function of fear decay has led to a fear curve that closely corresponds with the empirical fear trend. Here, too, the question is if the mechanisms that generate fear remain stable as the pandemic progresses.
Both in the COSMO survey (Betsch 2021) and the you.gov study (YouGov 2020b), the fraction of respondents reporting a high level of affective risk or fear decreased sharply at the end of the first wave which corresponds to our model. After, however, the size of this fraction did not correspond with the number of infections as strongly anymore. Instead, it remained stable as infection numbers were negligible in the summer and never substantially surpassed the size it had in the first wave, even as infection numbers soared during the second wave. This suggests that perceptions of risk and fear, while initially driven by infection numbers, might be influenced by other factors as the pandemic progresses.
Certainly, as 2021 introduced the second year of the pandemic for many countries, the driving factors of the behavior of individuals changed drastically, with numerous reports of fatigue with regard to the pandemic (Ala’a et al. 2021). The topic of pandemic fatigue itself and if it actually exists is, however, still being discussed (Reicher & Drury 2021).
Evaluating the model predictions
While individual behavior has been shown to be an important aspect in our model, the implemented communication model is not of significant importance to the disease spread. By using the proposed method for behavior calculation and growth and decay of different agent properties, we have demonstrated that these components improve the model behavior. They could therefore be used in further research to gain insights into the important aspect of human behavior during epidemics. Similar infection spreading patterns as observed in Germany are also achieved, though the scale of the infection spread could be improved.
The mutual influence of protective behavior and infections can produce a chicken and egg dynamic and result in a wave-like pattern. Here, a reduction in fear due to fewer infections can lead to less protective behavior, causing more infections which again increase fear (and so forth).
This cycle can also be seen in the media model. The influence of media on increased protective behavior is modeled as short-lived. Therefore, small reductions in the infection trends are met with decreased fear and, shortly after, lower protective behavior, which minimizes the impact of media overall. Refer to Figure 6 for the underlying mechanism that leads to self-balancing. Other underlying factors like average number of contacts or infection rates have a measurable impact on the epidemic (as seen in the sensitivity analysis) and should therefore be targeted in further research.
The cyclic nature of epidemics was also encountered in other research. (Badham & Gilbert 2015) found that effective protective behavior can lead to fewer vaccinations because the disease spread appears to be less threatening. Often, infectious diseases occur in multiple waves as seen in the influenza pandemics of the 20th century (Mummert et al. 2013), an important dynamic also observed in our model. This supports the assumption that changes in contact patterns and human behavior, in general, are influential in multiple disease waves (Epstein 2014).
For a predictive model, a higher number of agents would provide better and more fine-grained results. Our model in its current form provides a good basis for policy decisions, but it is less capable of being used as a predictive model.
To optimize the predictive power of the model for infection modeling, recent findings of disease states and the transfer rates between them should be implemented. This would allow infections to be predicted more validly and on a larger scale.
Limitations and future work
We based our model on several assumptions and simplifications due to the complex subject being modeled. Consequently, it deviates from reality in some places. While we often chose reduced complexity over a maximum in realism, it might be sensible to add features in other modeling contexts with different requirements.
In the future, we plan to improve the implementation of agent behavior and schedule. As Perez & Dragicevic (2009) recommended, we integrated infrastructure and social structures into our model, which can also be reused in future models. We used OpenStreetMap (OSM) data for accurate school locations. However, since a similar feature is not offered for workplaces, we placed them randomly across the map. This could be improved by parsing different workplace-related locations from OSM. A related problem is the workplace size, which we based on an approximate bureau distribution taken from a dated and local study (Stottrop 2007) and then divided by the average space per worker. For predictive modeling, more detail could be useful.
Another aspect is that the agent population lives within a closed space. Thus, phenomena such as commuting are only indirectly considered when modeling a smaller scale (i.e., a smaller city) by placing some agents farther away by extending their search radius for a suitable workplace.
As already mentioned, in our model the influence of media was negligible. This is due to the self-balancing cycle already discussed. However, this cycle is dependent on media messaging that unilaterally supports protective measures as infection numbers rise. While this is a sufficient representation of the media landscape in early pandemic Germany, the influence of media in other locations and phases of the pandemic is clearly more complex. For example, we did not account for misinformation or media content which discourages protective behavior. The mechanisms of mutual influence between the COVID-19 pandemic and the so-called infodemic need to be addressed in future modeling efforts.
A number of other adjustments could be made to the infection model. Firstly, as of now, we implemented agent immunity as binary and fixed duration, which does not correspond to the current virological findings (Robert Koch Institut 2020b) and could be modified in future models. This could be done by implementing a chance of infection even though immunity is active and a fade-out of the immunity effect against infection. Secondly, our model does not account for vaccination as it replicates the early phase of pandemics. Including vaccinations would likely lead to a dramatically changed model dynamic: On the one hand, an agent’s willingness to be vaccinated might depend on similar factors as other protective behaviors. On the other hand, vaccination might reduce an agent’s fear. Thirdly, currently, a one-time decision determines the transition between agent states. That is, the agent decides on a fixed day whether to go into quarantine or not. More realistic, however, would be to use continuous probabilities, so that the agent can decide each day whether to accept or reject the quarantine. Overall, future work should update the infection parameters, as many settings are based on preliminary findings due to the novelty of COVID-19.
In our model, fear results from the combination of the percentage increase in infected and infected acquaintances. However, the disease breaks out too early in our model compared to reality. This suggests that other factors should be taken into account that caused the infection to break out later in reality. To better represent the macro behavior of the agents, we want to identify a fear mechanism that is as realistic as possible. A further consideration when modeling the influence of fear is the age-dependence of COVID-19 infection severity as well as health-dependency. Especially for young people, concern for others might be a stronger driver of protective behavior than fear for themselves (Fisher et al. 2021; Nivette et al. 2021). It might also lead to differing patterns of protective behavior, e.g., agents only socially distancing from other agents they perceive to be vulnerable. Although the variability of fear in our model is mainly based on the number of an agent’s acquaintances who are infected, this variability can also cover for aforementioned age dependencies and can be refined in further studies.
In general, we note that the model performs best in the initial phase of the pandemic. As discussed, with the pandemic stretching over several months, the influence of other factors like efficacy beliefs or norms might grow. In future work, these factors could be modeled as parts of the attitude parameter. Furthermore, social norms are only computed during the "work" stage, foremostly to save computation time. But the influence of work colleagues on social norms, opposing to family or circles of friends, is not quantified, and research is needed to evaluate the relative importance of those different influences. We state that the model is easily transferable to other regions. This does however not directly equate to generalizability to other countries, since this would also require consideration of different demographic structures and social norms and behaviors.
Another factor that might be incorporated in future model efforts, especially if they move beyond the initial phase of the pandemic, is seasonality. Though additional measures would be necessary to eradicate COVID-19, the warm season has been shown to slow down pandemic spread considerably (Liu et al. 2021). The early outbreaks found in the model can be attributed to many different factors, which should be considered in further research. A likely culprit is the density of the social and spatial network. The spatial network uses a true-to-size spatial structure of a city, but reduces the number of inhabitants for computational and complexity reasons. In the same manner, the social network uses an amount of social contacts that is grounded in empirical data. With enough computing resources, the agent count could then be increased to reflect a more realistic density of agents. An alternative approach would be to decrease the resolution of the network and the accompanying complexity, though reasoning about the required scale and validity of the resulting model is out of scope for this paper.
Overall, it makes sense to incorporate more recent developments into future models. For example, it seems reasonable to consider that despite current relaxations at certain incidences (usually at an incidence of 100), a kind of emergency brake should take effect and relaxations should be withdrawn. The results of our model are especially relevant in light of the emergence of multiple waves of COVID-19 in Germany and Europe, which were facilitated by a decay in adoption of protective behavior like social distancing (Rosney 2020). Because the model uses local and global information, the average fear levels could be influenced by true global infection cases (i.e., infections occurring in other countries). In any case, fine-grained information on trends in fear and protective behavior could greatly aid further research on this topic, since access to regional behavior data is limited. Since this data is presumably already being collected (by service providers such as Google and Apple), it could be obtained as a first step towards a more fine-grained mobility and behavior dataset.
In a second step, fear levels of the population could be deducted from their protective behavior. Since mobility reports are often available daily, this could provide policy makers with live information about the efficacy of protective behavior and allow NPIs to be established in a much more precise manner instead of the often criticized blanket measures. It could also be used to gain information about the current stage of the threat perception process (i.e., exponential growth or decay phase), and act accordingly.
An ever-increasing factor of importance for the fight against COVID-19 was the development of vaccines, which has been conducted with overwhelming speed and deeply influences the mechanisms of fear and behavior that we investigate. However, vaccines only come into play during later stages of an epidemic, having required about eight months for their development. We however focus on the initial stages of a pandemic, where novelty and fear are important factors. While at this time, vaccinations do not play a role yet, the influence of vaccinations would likely influence the model in a two-fold way: Firstly, getting vaccinated is another possible protective measure for which adoption is influenced by fear and norms. Secondly, the vaccination status of the agent and in the population is in turn likely to affect fear and attitudes towards protective behavior. However, we fundamentally aim to show that fear plays an important role at the beginning (that is, the first months) of a pandemic and investigate possible mechanisms for its influence, but do not want to speculate over its further importance. This is also why this work does not serve as a predictive model, but rather as an impulse for policy recommendations for future models of future pandemics. We, therefore, reproduce the initial phase of the pandemic rather than predict the ongoing situation, and emphasize learning for the initial phase of other pandemics where there exists no vaccine.
With regard to the complexity of this model, Occam’s Razor can surely be applied at many angles—how much influence on behavior do concepts like family structure, news, transport, social contact rates actually exert? We intended this model as an integrated concept of different components, foremostly based on a given level of realism. Next steps could be taken for finding out the essential components by their stepwise removal and evaluation of prediction performance. This could be approached with a Lasso-Regression mindset, progressively shrinking the amount of concepts included.
Our work as proof of concept enables future studies to build up on our findings and to explore possible extensions in terms of fear complexity, vaccination status and different degrees of interventions.
Conclusion
Our proposed behavioral model produces realistic results by using the Rescorla-Wagner model based on recommendations of Epstein (2014) and a modification of the TELL ME behavioral model (Badham & Gilbert 2015), using fear as central factor in determining protective behavior. We simulated the spread of COVID-19 with an agent-based model and took individual protective behavior and media influence into account. We incorporated real-world demographic data, social structures and infection stages in the model. Our model underlines that agent-based models are a promising technology for epidemiological modeling and can help planning preventive measures and mitigate disease spread.
Fear was modeled as an important factor in the adoption of protective behavior. With the given dynamics, fear can rapidly decay if the stimulus declines, thereby reducing protective behavior, similar to empirical data. Furthermore, individual behavior plays an important role and shows how only a few deviations from recommended protective behavior can fuel infection growth. The mutual influence of both factors can lead to self-stabilizing behavior, highlighting the importance of underlying base-rates of infectivity rather than short-lived increases to protective behavior.
The model could be used to inform policy decisions regarding individual behavior and for the further study of the relation of fear and protective behavior. We found that the applied media model had no influence on the outcome of the epidemic, while consistent individual behavior across the population is identified as important factor with regard to the effectiveness of non-pharmaceutical interventions. To use our simulation as a predictive model, it requires further modification to better reproduce infection parameters and spread, and an increased number of agents for a more realistic simulation.
Together with the insights on fear extinction, this puts the spotlight on ways to ensure consistent and effective individual behavior during an epidemic on the one hand, and research on coping with fear extinction and the accompanying decay of protective behavior on the other hand. We encourage studies which focus on fear extinction in the short and long term, and how other behavioral mechanisms could be used to ensure consistent and widely adapted protective behavior. By furthering research in the proposed directions, communication and mitigation strategies could be improved, which could ultimately help with reducing the impact of further waves of COVID-19 and possibly of other epidemics yet to come.
Notes
- This behavior is consistent with the mathematical model of Kermack-McKendric’s SIR model.↩︎
- and are therefore subject to sample selection bias.↩︎
Model Documentation
Our modelwas implemented in Julia 1.5 using a patched Agents.jl 3.0 library (Datseris et al. 2021), and the source code for the model and the required libraries with all simulations presented in this article can be found at https://github.com/digitalemuendigkeit/COVID19-ABM and at https://osf.io/axv6q/. The repository also contains a dockerfile for simple reproducibility.Appendix: Additional Figures and Tables
Figures
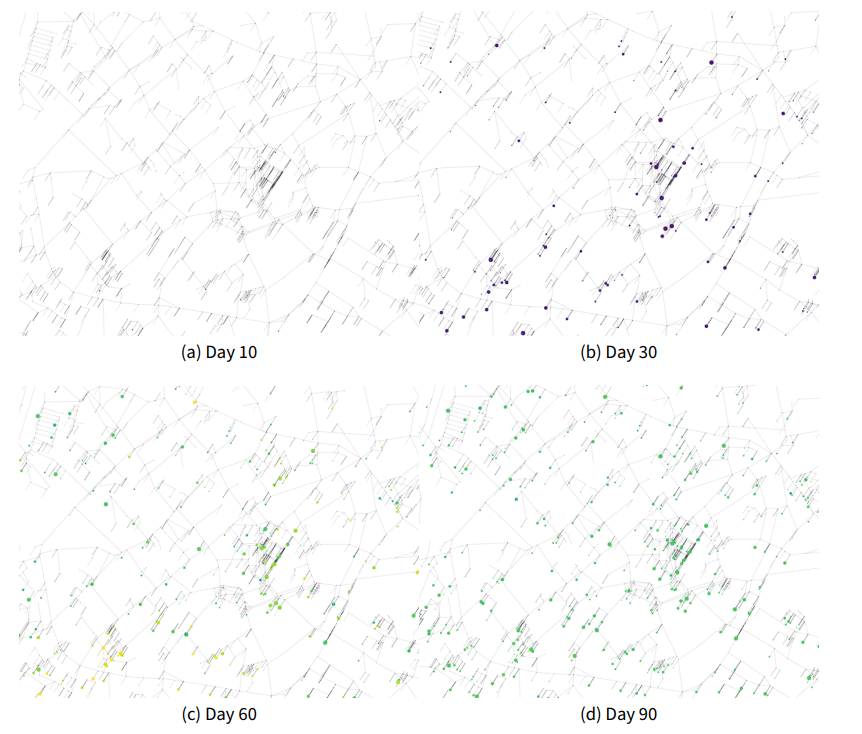
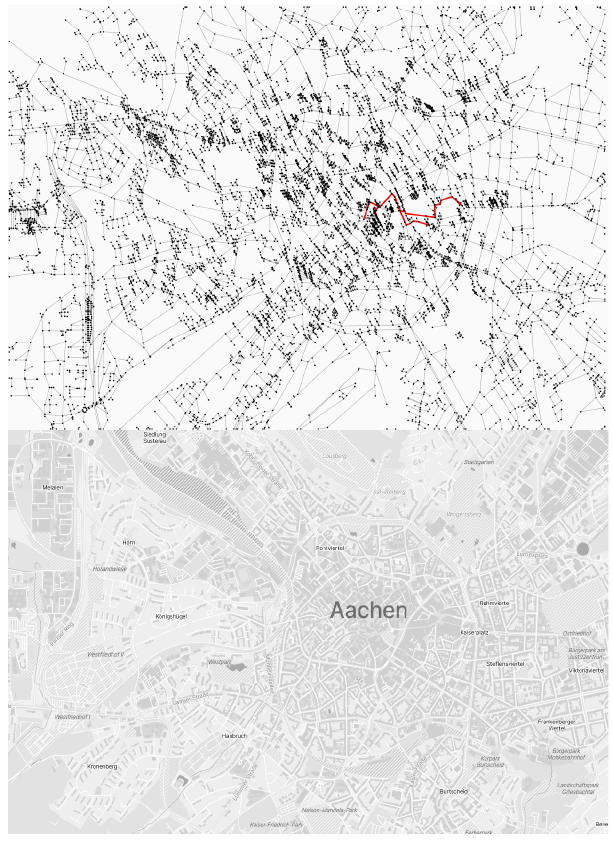
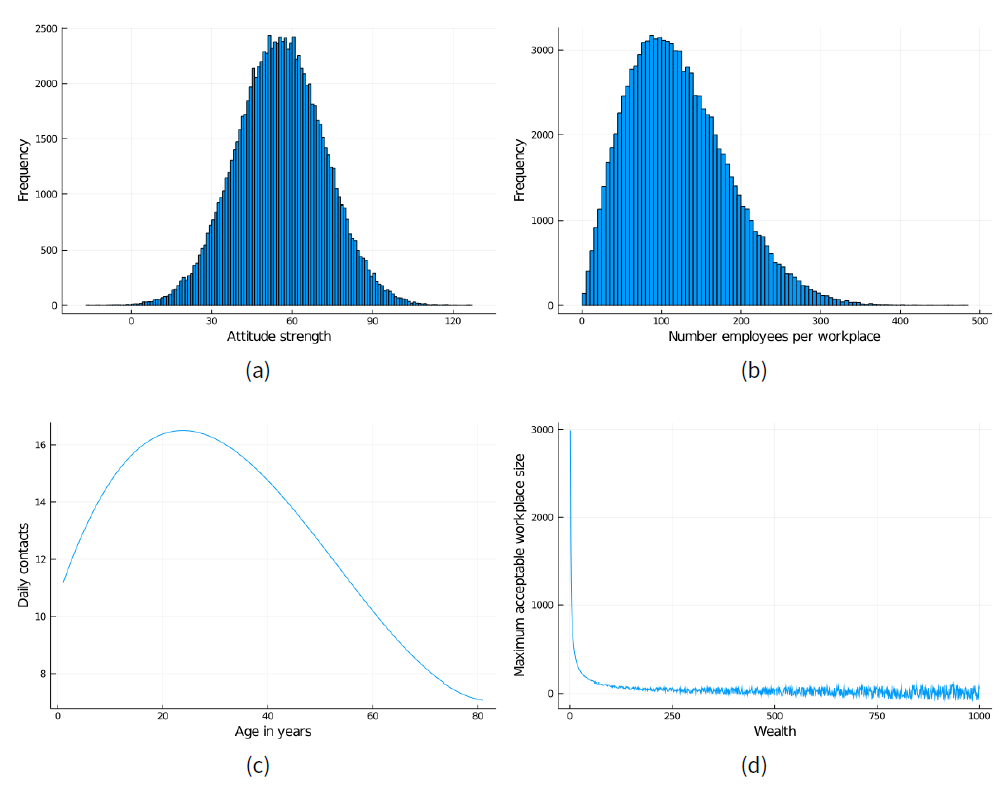
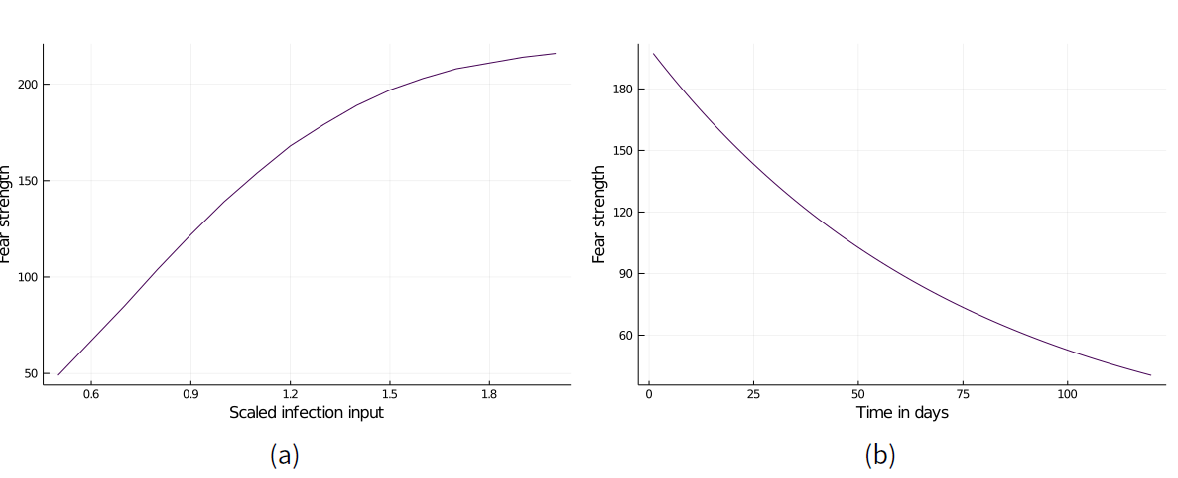
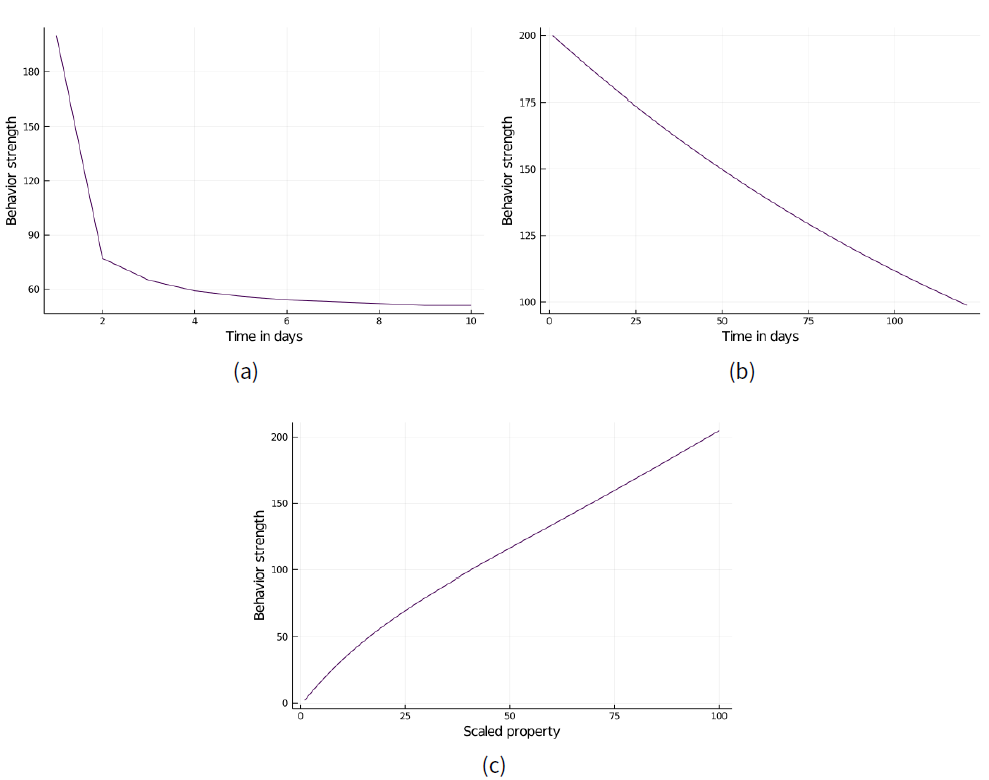
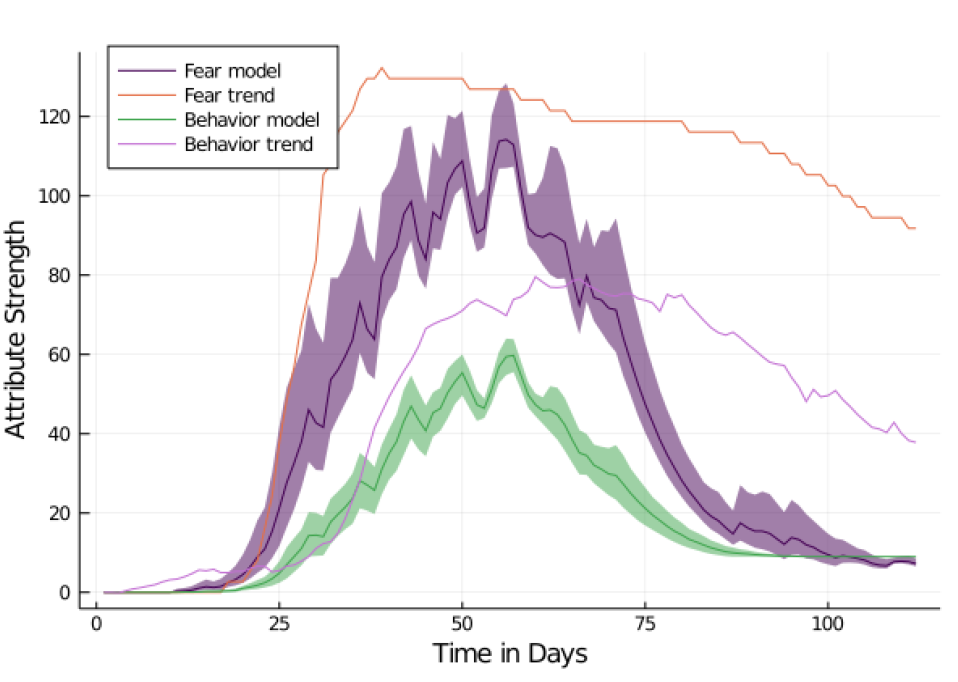
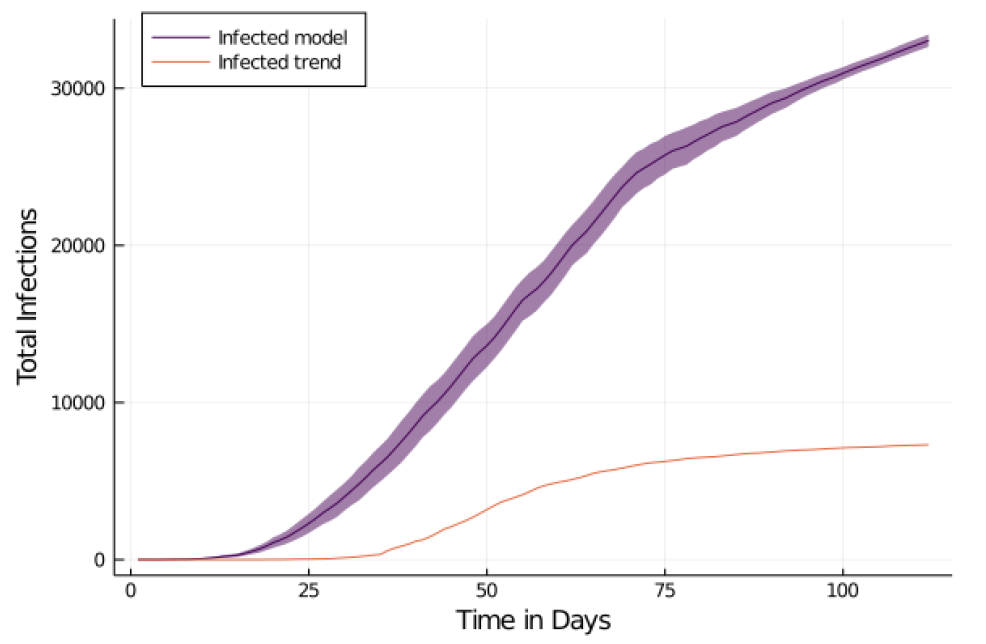
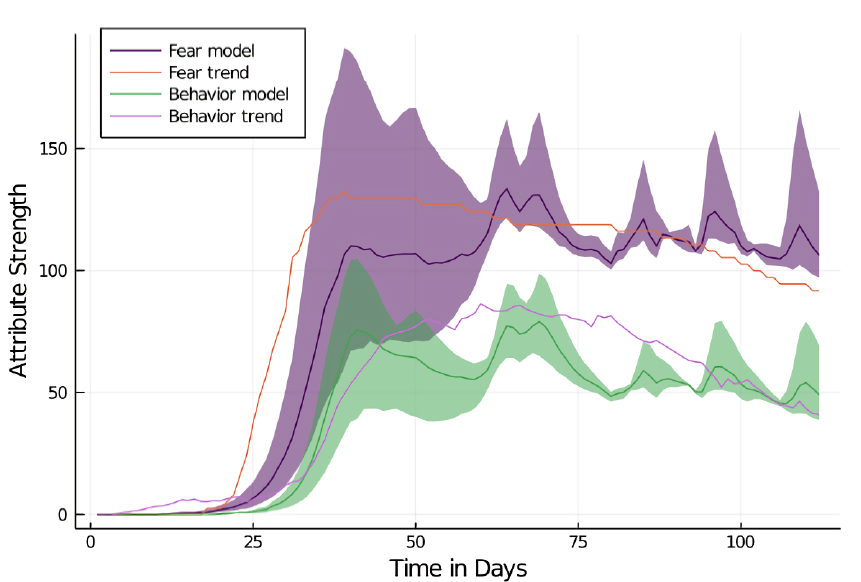
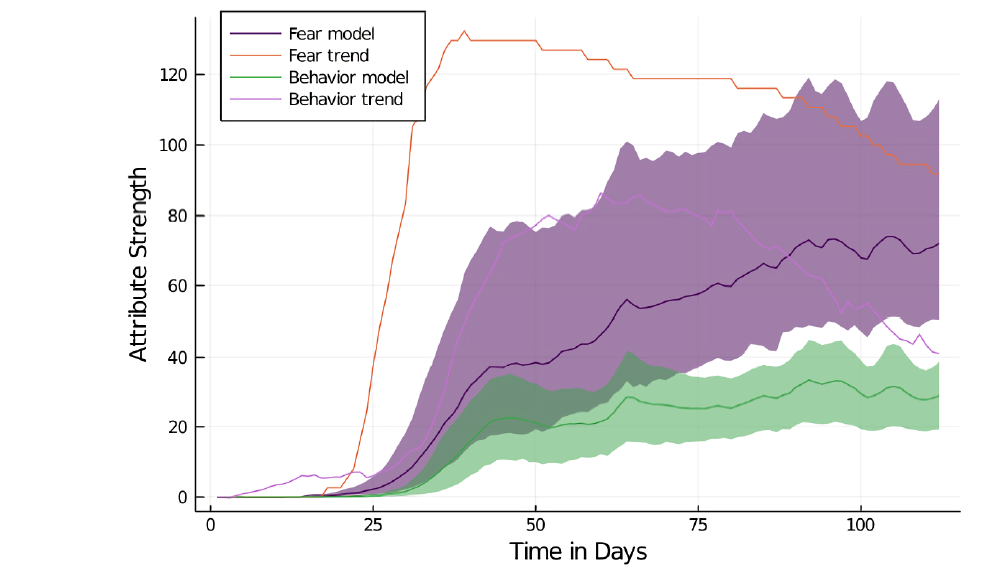
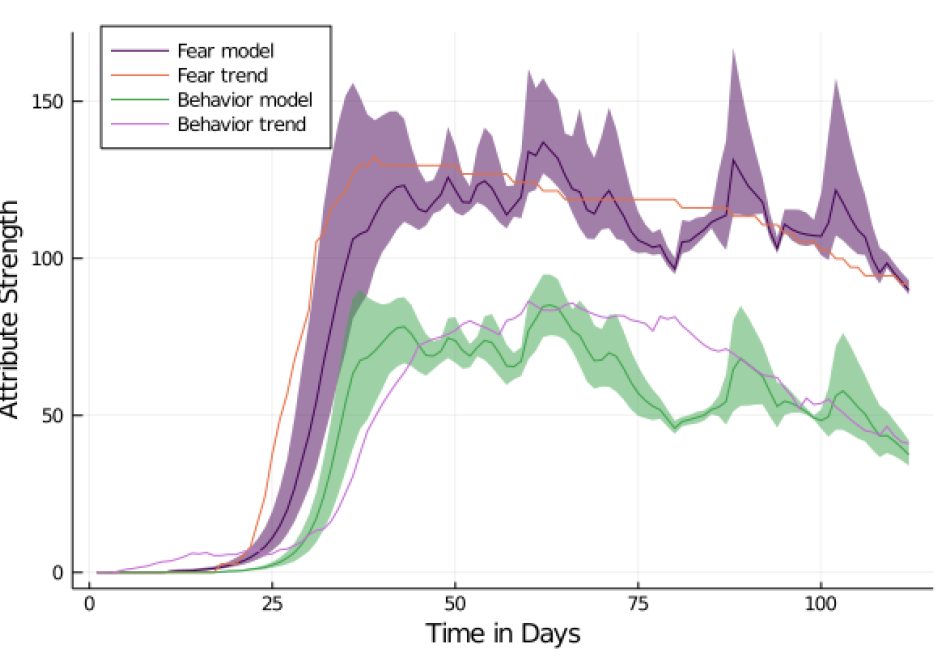
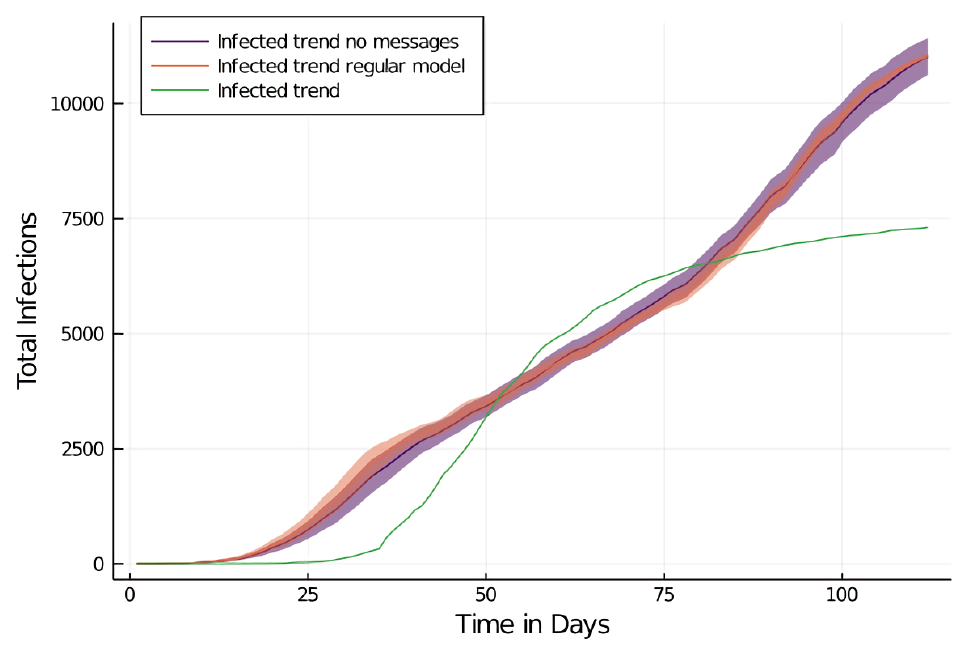
| Model Property | Calibrated Value | Min | Max | Increment |
|---|---|---|---|---|
| Contact Rate | \(\displaystyle Contacts*0.7\) | 0.5 | 1.5 | 0.1 |
| General Infection Risk Modifier | \(\displaystyle Risk*0.8\) | 0.1 | 1.5 | 0.1 |
| General Infection Risk (Behavior) | 0.0366 | 0.001 | 0.1 | 0.1-0.001 |
| General Infection Risk (No Behavior) | 0.095 | 0.001 | 0.1 | 0.1-0.001 |
| Infection Risk Quarantine (Behavior) | 0.0063 | 0.001 | 0.1 | 0.1-0.001 |
| Infection Risk Quarantine (No Behavior) | 0.0163 | 0.001 | 0.1 | 0.1-0.001 |
| Infection Risk Travel (Behavior) | 0.0366 | 0.001 | 0.1 | 0.1-0.001 |
| Infection Risk Travel (No Behavior) | 0.095 | 0.001 | 0.1 | 0.1-0.001 |
| Fear Growth | \(\displaystyle 100*2.2*\) | 0.5 | 2 | 0.1 |
| 1-e-(newcases*perscases) | ||||
| Fear Decay | fear*e-(time/150) | 0 | 5 | 0.1 |
| Fear Decay Trigger | If 3 days growth < 104% | 100 | 120 | 1 |
| Fear Decay Delay | 3 days | 0 | 5 | 1 |
| Behavior Activation Threshold | \(\displaystyle Behavior > 60\) | 50 | 120 | 5 |
| Modifier Fear Influence on Behavior | \(\displaystyle Fear*1\) | 0.5 | 1.5 | 0.1 |
| Attitude/Norms Growth | \(\displaystyle property*\) | |||
| 1+e-scaledproperty | ||||
| Attitude/Norms Growth Scale | \(\displaystyle Scale(0,170,0,3)\) | (0,2) | (0,6) | 1 |
| Attitude Decay | \(\displaystyle attitude*\) | 6 | 1 | 1 |
| e-difference(oldatt,newatt)/2 | ||||
| Attitude/Norms Decay Scale | \(\displaystyle Scale(0,158,0,2)\) | (0,1) | (0,6) | 1 |
| Norm Decay | norm * e-(time/340) | 500 | 10 | 10 |
A table with the results is shown at Table 4. By increasing and decreasing the amount of contacts per agent, the model reacts with mostly linear changes to the percentages of infected agents.
| Parameter | Day 25 | Day 50 | Day 75 | Day 100 | |
|---|---|---|---|---|---|
| Baseline | 7.68 | 21.2 | 52.29 | 86.94 | |
| Contacts | 0.45 | 3.38 | 21.2 | 39.63 | 67 |
| 0.6 | 4.97 | 25.62 | 42.83 | 70.1 | |
| 0.65 | 4.62 | 25.5 | 42.82 | 72.11 | |
| 0.75 | 6.37 | 34.53 | 54.9 | 82.83 | |
| 0.8 | 6.24 | 35.43 | 55.93 | 86.77 | |
| 0.95 | 9.74 | 43.44 | 66.6 | 93.53 | |
| Infection Risk | 0.55 | 4.07 | 23.23 | 40.14 | 68.15 |
| 0.7 | 7.73 | 28.4 | 46.84 | 75.92 | |
| 0.75 | 7.92 | 30.16 | 48.68 | 82.17 | |
| 0.85 | 6.18 | 31 | 50.44 | 81.47 | |
| 0.9 | 9.05 | 36.32 | 55.83 | 87.58 | |
| 1.05 | 11.48 | 44.81 | 68.77 | 95.31 | |
| Add Infected | 5 | 14.61 | 37.05 | 57.1 | 89.49 |
| 10 | 16.91 | 38.78 | 60.51 | 90.97 | |
| 15 | 24.28 | 44.24 | 67.51 | 93.71 | |
| 25 | 26.9 | 45.31 | 68.05 | 93.95 | |
| 50 | 33.68 | 50.42 | 71.76 | 95.89 | |
References
ALA’A, B., Tarhini, Z., & Akour, A. (2021). A swaying between successive pandemic waves and pandemic fatigue: Where does Jordan stand? Annals of Medicine and Surgery, 65.
ALETA, A., Martín-Corral, D., Pastore Piontti, A., Ajelli, M., Litvinova, M., Chinazzi, M., Dean, N. E., Elizabeth Halloran, M., Longini Jr, I. M., Merler, S., Pentland, A., Vespignani, A., Moro, E., & Moreno, Y. (2020). Modelling the impact of testing, contact tracing and household quarantine on second waves of COVID-19. Nature Human Behaviour, 4(2020), 964–971. [doi:10.1038/s41562-020-0931-9]
APPLE. (2020). COVID-19 - Mobility Trends Reports - Apple. Availble at: https://web.archive.org/web/20210610142926/https://covid19.apple.com/mobility.
BADHAM, J. M., & Gilbert, N. (2015). TELL ME design: Protective behaviour during an epidemic. Centre for Research in Social Simulation Working Paper, University of Surrey. Available at: https://cress.soc.surrey.ac.uk/web/publications/working-papers/tell-me-design-protective-behaviour-during-epidemic.
BAUA. (2013). Bundesministerium für Arbeit und Soziales - Technische Regeln für Arbeitsstätten Raumabmessungen und Bewegungsflächen. GMBI, 2013(46), 910–918.
BETSCH, C. (2021). COSMO COVID-19 Snapshot Monitoring | Zusammenfassung und Empfehlungen Welle 39. Available at: https://web.archive.org/web/20210610143128/https://dfncloud.uni-erfurt.de/s/8bFzRd7WTS53FRX.
BEZANSON, J., Edelman, A., Karpinski, S., & Shah, V. B. (2017). Julia: A fresh approach to numerical computing. SIAM Rev, 59(1), 65–98. [doi:10.1137/141000671]
BHATTACHARYA, P., Kuhlman, C. J., Lebiere, C., Morrison, D., Wilson, M. L., & Orr, M. G. (2019). The Matrix: An agent-Based modeling framework for data intensive simulations. Proceedings of the 18th International Conference on Autonomous Agents and MultiAgent Systems.
BLOM, A. G., Wenz, A., Rettig, T., Reifenscheid, M., Naumann, E., Möhring, K., Lehrer, R., Krieger, U., Juhl, S., Friedel, S., Fikel, M., & Cornesse, C. (2020). Die Mannheimer Corona-Studie: Das Leben in Deutschland im Ausnahmezustand. Universität Mannheim, Working Paper. Available at: https://web.archive.org/web/20200809085719/https://madoc.bib.uni-mannheim.de/55482/. [doi:10.1111/rssa.12749]
BOUCHNITA, A., & Jebrane, A. (2020). A hybrid multi-scale model of COVID-19 transmission dynamics to assess the potential of non-pharmaceutical interventions. Chaos, Solitons & Fractals, 138, 109941. [doi:10.1016/j.chaos.2020.109941]
BÖNISCH, S., Wegscheider, K., Krause, L., Sehner, S., Wiegel, S., Zapf, A., Moser, S., & Becher, H. (2020). Effects of coronavirus disease (COVID-19) related contact restrictions in Germany, March to May 2020, on the mobility and relation to infection patterns. Frontiers in Public Health, 8, 619.
CHU, D. K., Akl, E. A., Duda, S., Solo, K., Yaacoub, S., Schünemann, H. J., El-harakeh, A., Bognanni, A., Lotfi, T., Loeb, M., Hajizadeh, A., Bak, A., Izcovich, A., Cuello-Garcia, C. A., Chen, C., Harris, D. J., Borowiack, E., Chamseddine, F., Schünemann, F., … Reinap, M. (2020). Physical distancing, face masks, and eye protection to prevent person-to-person transmission of SARS-CoV-2 and COVID-19: a systematic review and meta-analysis. The Lancet, 1973–1987. [doi:10.1016/s0140-6736(20)31142-9]
DATSERIS, G., Vahdati, A. R., & DuBois, T. C. (2021). Agents.jl: A performant and feature-full agent based modelling software of minimal code complexity. arXiv Preprint. Available at: https://arxiv.org/abs/2101.10072. [doi:10.1177/00375497211068820]
DEHNING, J., Zierenberg, J., Spitzner, F. P., Wibral, M., Neto, J. P., Wilczek, M., & Priesemann, V. (2020). Inferring change points in the COVID-19 spreading reveals the effectiveness of interventions. Science, 369(6500). [doi:10.1126/science.abb9789]
DICKIE, R., Rasmussen, S., Cain, R., Williams, L., & MacKay, W. (2018). The effects of perceived social norms on handwashing behaviour in students. Psychology, Health and Medicine, 23(2), 154–159. [doi:10.1080/13548506.2017.1338736]
D’ORAZIO, M., Bernardini, G. & Quagliarini, E. (2020). How to restart? An agent-based simulation model towards the definition of strategies for COVID-19 "second phase" in public buildings. arXiv Preprint. Available at: https://arxiv.org/abs/2004.12927v1.
EPSTEIN, J. M. (2014). Agent Zero: Toward Neurocognitive Foundations for Generative Social Science. Princeton, NJ: Princeton University Press.
ESRI Deutschland GmbH. (2020). RKI COVID-19 Germany Dashboard. Availble at: https://web.archive.org/web/20210610142625/.
ESTRADA, E. (2020). COVID-19 and SARS-CoV-2. Modeling the present, looking at the future. Physics Reports, 869, 1–51. [doi:10.1016/j.physrep.2020.07.005]
FERRETTI, L., Wymant, C., Kendall, M., Zhao, L., Nurtay, A., Abeler-Dörner, L., Parker, M., Bonsall, D., & Fraser, C. (2020). Quantifying SARS-CoV-2 transmission suggests epidemic control with digital contact tracing. Science, 368(6491). [doi:10.1126/science.abb6936]
FISHER, H., Lambert, H., Hickman, M., Yardley, L., & Audrey, S. (2021). Experiences of the coronavirus disease-19 (COVID-19) pandemic from the perspectives of young people: Rapid qualitative study. Public Health in Practice, 2, 100162. [doi:10.1016/j.puhip.2021.100162]
FUNK, S., Gilad, E., Watkins, C., & Jansen, V. A. A. (2009). The spread of awareness and its impact on epidemic outbreaks. Proceedings of the National Academy of Sciences, 106(16), 6872–6877. [doi:10.1073/pnas.0810762106]
FUNK, S., Salathé, M., & Jansen, V. A. A. (2010). Modelling the influence of human behaviour on the spread of infectious diseases: A review. Journal of the Royal Society Interface, 7(50), 1247–1256. [doi:10.1098/rsif.2010.0142]
FÜR. ARBEIT, Gesundheit und Soziales des Landes Nordrhein-Westfalen, M. für. (2020). Nachbarschaftshilfe in der Corona-Pandemie. Ergebnisse einer repräsentativen Befragung in Nordrhein-Westfalen. Availble at: https://broschuerenservice.mags.nrw/mags/shop/Nachbarschaftshilfe_in_der_Corona-Pandemie./21#image-0.
GAUDOU, B., Huynh, N. Q., Philippon, D., Brugière, A., Chapuis, K., Taillandier, P., Larmande, P., & Drogoul, A. (2020). COMOKIT: A modeling kit to understand, analyze, and compare the impacts of mitigation policies against the COVID-19 epidemic at the scale of a city. Frontiers in Public Health, 8. [doi:10.3389/fpubh.2020.563247]
GDELT Project. (2020). The GDELT Project. Availble at: https://www.gdeltproject.org/.
GOVERNING.COM. (2012). Who Uses Public Transportation in Your City? Availble at: https://www.governing.com/archive/public-transportation-demographics-ridership-data-for-cities.html.
GÖTZ, T., & Heidrich, P. (2020). Early stage COVID-19 disease dynamics in Germany: Models and parameter identification. Journal of Mathematics in Industry, 10, 20.
GUASTAFIERRO, E., Toppo, C., Magnani, F. G., Romano, R., Facchini, C., Campioni, R., Brambilla, E., & Leonardi, M. (2021). Older adults’ risk perception during the COVID-19 pandemic in Lombardy Region of Italy: A cross-sectional survey. Journal of Gerontological Social Work, 0(0), 1–14. [doi:10.1080/01634372.2020.1870606]
GUERCAN, O., Dikenelli, O., & Bernon, C. (2013). A generic testing framework for agent-based simulation models. Journal of Simulation, 7(3), 183–201.
GUERRERO, N., De Leon, C. F., Evans, D. A., & Jacobs, E. A. (2015). Determinants of trust in health care in an older population. Journal of the American Geriatrics Society, 63(3), 553–557. [doi:10.1111/jgs.13316]
HARPER, C. A., Satchell, L. P., Fido, D., & Latzman, R. D. (2020). Functional fear predicts public health compliance in the COVID-19 pandemic. International Journal of Mental Health and Addiction, 1–21. [doi:10.31234/osf.io/jkfu3]
HARRIS, C. L., Cobbold, C. A., Brummitt, N., & Reeve, R. (2019). Dynamic virtual ecosystems as a tool for detecting large-scale responses of biodiversity to environmental and land-use change. arXiv Preprint. Available at: https://arxiv.org/abs/1911.12257v1.
HART, P. S., Chinn, S., & Soroka, S. (2020). Politicization and polarization in COVID-19 news coverage. Science Communication, 42(5), 679–697. [doi:10.1177/1075547020950735]
HE, J., Guo, Y., Mao, R., & Zhang, J. (2021). Proportion of asymptomatic coronavirus disease 2019: A systematic review and meta-analysis. Journal of Medical Virology, 93(2), 820–830. [doi:10.1002/jmv.26326]
HEATH, B. L. (2010). The History , Philosophy , and Practice of Agent-Based Modeling and the Development of the Conceptual Model for Simulation Diagram A dissertation submitted in partial ful llment of the requirements for the degree By. Practice.
HEGSELMANN, R., & Krause, U. (2002). Opinion dynamics and bounded confidence: Models, analysis and simulation. Journal of Artificial Societies and Social Simulation, 5(3), 2: https://www.jasss.org/5/3/2.html.
HETHCOTE, H. W. (1989). 'Three basic epidemiological models.' In S. A. Levin, T. G. Hallam, & L. J. Gross (Eds.), Applied Mathematical Ecology (pp. 119–144). Berlin Heidelberg: Springer. [doi:10.1007/978-3-642-61317-3_5]
HETHCOTE, H. W. (2000). The mathematics of infectious diseases. SIAM Review, 42(4), 599–653. [doi:10.1137/s0036144500371907]
HOERTEL, N., Blachier, M., Blanco, C., Olfson, M., Massetti, M., Rico, M. S., Limosin, F., & Leleu, H. (2020). A stochastic agent-based model of the SARS-CoV-2 epidemic in France. Nature Medicine, 26(9), 1417–1421. [doi:10.1038/s41591-020-1001-6]
HUBNER, A. (2021). How did we get here? A framing and source analysis of early COVID-19 media coverage. Communication Research Reports, 38(2), 112–120. [doi:10.1080/08824096.2021.1894112]
INFRATEST Dimap. (2020). Corona und die Medien. Eine Studie im Auftrag des NDR – Magazin zapp - Mai 2020. Availble at: https://www.ndr.de/fernsehen/sendungen/zapp/infratestdimapcorona100.pdf.
INSTITUT der Deutschen Wirtschaft. (2016). Kaufkraftbereinigtes Medianeinkommen. Availble at: https://iw.carto.com/viz/71f414f4-ad68-4c60-aad8-0e4af400080c/public_map
INTERNATIONAL Labour Organization. (2020). ILO Monitor: COVID-19 and the world of work. Second edition. Updated estimates and analysis. Availble at: https://www.ilo.org/wcmsp5/groups.
JARYNOWSKI, A., Semenov, A., & Belik, V. (2020). Protest perspective against COVID-19 risk mitigation strategies on the German Internet. In S. Chellappan, K. K. R. Choo, & N. Phan (Eds.), Computational Data and Social Networks (pp. 524–535). Springer International Publishing. [doi:10.1007/978-3-030-66046-8_43]
JIANG, X., Hwang, J., Shah, D. V., Ghosh, S., & Brauer, M. (2021). News attention and social-Distancing behavior amid COVID-19: How media trust and social norms moderate a mediated relationship. Health Communication, 0(0), 1–10. [doi:10.1080/10410236.2020.1868064]
JØRGENSEN, F., Bor, A., & Petersen, M. B. (2021). Compliance without fear: Individual‐level protective behaviour during the first wave of the COVID-19 pandemic. British Journal of Health Psychology, 26(2), 679–696.
KERMACK, W. O., & McKendrick, A. G. (1927). A contribution to the mathematical theory of epidemics. Proceedings of the Royal Society of London. Series A, Containing Papers of a Mathematical and Physical Character, 115(772), 700–721.
KHALIL, K. M., Abdel-Aziz, M., Nazmy, T. T., & Salem, A. B. M. (2012). An agent-Based modeling for pandemic influenza in Egypt. Intelligent Systems Reference Library, 33, 205–218. [doi:10.1007/978-3-642-25755-1_11]
KREMER, H. J., & Thurner, W. (2020). Age dependence in Covid-19 mortality in Germany. Deutsches Arzteblatt International. [doi:10.3238/arztebl.2020.0432]
LEE, J. S., Filatova, T., Ligmann-Zielinska, A., Hassani-Mahmooei, B., Stonedahl, F., Lorscheid, I., Voinov, A., Polhill, G., Sun, Z., & Parker, D. C. (2015). The complexities of agent-based modeling output analysis. Journal of Artificial Societies and Social Simulation, 18(4), 4: https://www.jasss.org/18/4/4.html. [doi:10.18564/jasss.2897]
LI, W., Zhang, B., Lu, J., Liu, S., Chang, Z., Cao, P., Liu, X., Zhang, P., Ling, Y., Tao, K., & Chen, J. (2020). The characteristics of household transmission of COVID-19. Clinical Infectious Diseases, 71(8), 1943–1946. [doi:10.1093/cid/ciaa450]
LIU, X., Huang, J., Li, C., Zhao, Y., Wang, D., Huang, Z., & Yang, K. (2021). The role of seasonality in the spread of COVID-19 pandemic. Environmental Research, 195. [doi:10.1016/j.envres.2021.110874]
LONG, Q., Tang, X., Shi, Q., Li, Q., Deng, H., Yuan, J., Hu, J. L., Xu, W., Zhang, Y., Lv, F. J., Su, K., Zhang, F., Gong, J., Wu, B., Liu, X., Li, J., Qiu, J., Chen, J., & Huang, A. (2020). Clinical and immunological assessment of asymptomatic SARS-CoV-2 infections. Nature Medicine, 26(2020), 1200–1204. [doi:10.1038/s41591-020-0965-6]
LORIG, F., Johansson, E., & Davidsson, P. (2021). Agent-Based social simulation of the Covid-19 pandemic: A systematic review. Journal of Artificial Societies and Social Simulation, 24(3), 5: https://www.jasss.org/23/4/5.html. [doi:10.18564/jasss.4601]
MAHDIZADEH Gharakhanlou, N., & Hooshangi, N. (2020). Spatio-temporal simulation of the novel coronavirus (COVID-19) outbreak using the agent-based modeling approach (case study: Urmia, Iran). Informatics in Medicine Unlocked, 20, 100403. [doi:10.1016/j.imu.2020.100403]
MIRZAEI, S., Mohtashami Borzadaran, G. R., Amini, M., & Jabbari, H. (2019). A new generalized Weibull distribution in income economic inequality curves. Communications in Statistics - Theory and Methods, 48(4), 889–908. [doi:10.1080/03610926.2017.1422754]
MOSSONG, J., Hens, N., Jit, M., Beutels, P., Auranen, K., Mikolajczyk, R., Massari, M., Salmaso, S., Tomba, G. S., Wallinga, J., Heijne, J., Sadkowska-Todys, M., Rosinska, M., & Edmunds, W. J. (2008). Social contacts and mixing patterns relevant to the spread of infectious diseases. PLoS Medicine, 5(3), 381–391. [doi:10.1371/journal.pmed.0050074]
MUMMERT, A., Weiss, H., Long, L. P., Amigó, J. M., & Wan, X. F. (2013). A perspective on multiple waves of influenza pandemics. PLoS ONE, 8(4), 1–12. [doi:10.1371/journal.pone.0060343]
MURRAY, D. R., & Schaller, M. (2012). Threat(s) and conformity deconstructed: Perceived threat of infectious disease and its implications for conformist attitudes and behavior. European Journal of Social Psychology, 42(2), 180–188. [doi:10.1002/ejsp.863]
MÜLLER, M. (2021). Necessity, norm and missing knowledge. Zeitschrift für Literaturwissenschaft und Linguistik.
MÜLLER, S. A., Balmer, M., Neumann, A., & Nagel, K. (2020). Mobility traces and spreading of COVID-19. Technische Universität Berlin, Working Paper. Available at: http://dx.doi.org/10.14279/depositonce-9835.
MYERS, K. M., & Davis, M. (2007). Mechanisms of fear extinction. Molecular Psychiatry, 12(2), 120–150. [doi:10.1038/sj.mp.4001939]
NAEEM, S. B., Bhatti, R., & Khan, A. (2021). An exploration of how fake news is taking over social media and putting public health at risk. Health Information & Libraries Journal, 38(2), 143–149. [doi:10.1111/hir.12320]
NISHIURA, H. (2007). Time variations in the transmissibility of pandemic influenza in Prussia, Germany, from 1918-19. Theoretical Biology and Medical Modelling, 4, 1–9. [doi:10.1186/1742-4682-4-20]
NIVETTE, A., Ribeaud, D., Murray, A., Steinhoff, A., Bechtiger, L., Hepp, U., Shanahan, L., & Eisner, M. (2021). Non-compliance with COVID-19-related public health measures among young adults in Switzerland: Insights from a longitudinal cohort study. Social Science and Medicine, 268, 113370. [doi:10.1016/j.socscimed.2020.113370]
OPENSTREETMAP Foundation. (2020). OpenStreetMap. Availble at: https://www.openstreetmap.org/#map=7/51.330/10.453.
OSF. (2020). OSF - COVID19-ABM Repo. Available at: https://osf.io/axv6q/.
PARKER, J., & Epstein, J. M. (2011). A distributed platform for global-scale agent-based models of disease transmission. ACM Transactions on Modeling and Computer Simulation, 22(1), 2. [doi:10.1145/2043635.2043637]
PASTOR-SATORRAS, R., Castellano, C., van Mieghem, P., & Vespignani, A. (2015). Epidemic processes in complex networks. Reviews of Modern Physics, 87(3), 925–979. [doi:10.1103/revmodphys.87.925]
PEREZ, L., & Dragicevic, S. (2009). An agent-based approach for modeling dynamics of contagious disease spread. International Journal of Health Geographics, 8(1), 1–17. [doi:10.1186/1476-072x-8-50]
PERROTTA, D., Grow, A., Rampazzo, F., Cimentada, J., Del Fava, E., Gil-Clavel, S., & Zagheni, E. (2020). Behaviors and attitudes in response to the COVID-19 pandemic: Insights from a cross-national Facebook survey. medRxiv Preprint. Available at: http://medrxiv.org/content/early/2020/05/15/2020.05.09.20096388.abstract. [doi:10.1101/2020.05.09.20096388]
REICHER, S., & Drury, J. (2021). Pandemic fatigue? How adherence to Covid-19 regulations has been misrepresented and why it matters. British Medical Journal, 372(137). [doi:10.1136/bmj.n137]
RESCORLA, R. A., & Wagner, A. R. (1972). 'A theory of Pavlovian conditioning: Variations in the effectiveness of reinforcement and nonreinforcement.' In A. H. Black & W. F. Prokasy (Eds.), Classical Conditioning II: Current Research and Theory (pp. 64–99). New York, NY: Appleton-Century-Crofts.
ROBERT Koch Institut. (2020a). Covid-19 Lagebericht 30.03.2020. Availble at: https://www.rki.de/DE/Content/InfAZ/N/Neuartiges_Coronavirus.
ROBERT Koch Institut. (2020b). RKI - Coronavirus SARS-CoV-2 - SARS-CoV-2 Steckbrief zur Coronavirus-Krankheit-2019 (COVID-19). Availble at: https://www.rki.de/DE/Content/InfAZ/N/.
RODRIGUES, H. S. (2016). Application of SIR epidemiological model: New trends. International Journal of Applied Mathematics and Informatics, 10, 92–97.
SCOTTISH COVID-19 Response Consortium. (2020). ScottishCovidResponse/Simulation.jl. Available at: https://github.com/ScottishCovidResponse/Simulation.jl.
SILVA, P. C. L., Batista, P. V. C., Lima, H. S., Alves, M. A., Guimarães, F. G., & SILVA, R. C. P. (2020). COVID-ABS: An agent-based model of COVID-19 epidemic to simulate health and economic effects of social distancing interventions. Chaos, Solitons & Fractals, 139, 110088. [doi:10.1016/j.chaos.2020.110088]
SINUS-INSTITUT. (2018). Studie: Offene Kommunikation und Fürsorge sind in einer Freundschaft am wichtigsten.
STANGIER, U., Kananian, S., & Schüller, J. (2021). Perceived vulnerability to disease, knowledge about COVID-19, and changes in preventive behavior during lockdown in a German convenience sample. Current Psychology, 1–9. [doi:10.1007/s12144-021-01456-6]
STATISTISCHES Bundesamt. (2011). ZENSUS2011 - Bevölkerungs- und Wohnungszählung 2011. Available at: https://www.sinus-institut.de/media-center/presse/studie-zum-internationalen-tag-der-freundschaft.
STATISTISCHES Bundesamt. (2019). Wochenendarbeit - Statistisches Bundesamt. Availble at: https://www.zensus2011.de/DE/Home/home_node.html.
STOTTROP, D. (2007). Büroflächen - Bestand - Grundlagen, Daten und Methoden. Availble at: .https://www.destatis.de/DE/Themen/Arbeit/.
TANNENBAUM, M. B., Hepler, J., Zimmerman, R. S., Saul, L., & Jacobs, S. (2018). Appealing to fear: A meta-Analysis of fear appeal effectiveness and theories. Psychological Bulletin, 141(6), 1178–1204. [doi:10.1037/a0039729]
TUKACHINSKY Forster, R. R., & Vendemia, M. A. (2021). Effects of news and threat perceptions on Americans’ COVID-19 precautionary behaviors. Communication Reports, 34(2), 65–77. [doi:10.1080/08934215.2021.1907428]
UMWELTBUNDESAMT Bundesrepublik Deutschland. (2017). Zahl der Haushalte von 2000 bis 2016 nach Haushaltsgröße 2000. 2017.
VAN Bavel, J. J., Baicker, K., Boggio, P. S., Capraro, V., Cichocka, A., Cikara, M., Crockett, M. J., Crum, A. J., Douglas, K. M., Druckman, J. N., Drury, J., Dube, O., Ellemers, N., Finkel, E. J., Fowler, J. H., Gelfand, M., Han, S., Haslam, S. A., Jetten, J., … Willer, R. (2020). Using social and behavioural science to support COVID-19 pandemic response. Nature Human Behaviour, 4(5), 460–471. [doi:10.31234/osf.io/y38m9]
VANDEPUT, N. (2019). Forecast KPI: RMSE, MAE, MAPE & Bias. Data Science for Supply Chain Forecast, 15.
VAN Doremalen, N., Bushmaker, T., Morris, D. H., Holbrook, M. G., Gamble, A., Williamson, B. N., Tamin, A., Harcourt, J. L., Thornburg, N. J., Gerber, S. I., Lloyd-Smith, J. O., Wit, E. de, & Munster, V. J. (2020). Aerosol and surface stability of SARS-CoV-2 as compared with SARS-CoV-1. New England Journal of Medicine, 382(16), 1564–1567. [doi:10.1056/nejmc2004973]
VILLANI, L., McKee, M., Cascini, F., Ricciardi, W., & Boccia, S. (2020). Comparison of deaths rates for COVID-19 across Europe during the first wave of the COVID-19 pandemic. Frontiers in Public Health, 8, 620416. [doi:10.3389/fpubh.2020.620416]
WANG, Y., Li, B., Gouripeddi, R., & Facelli, J. C. (2021). Human activity pattern implications for modeling SARS-CoV-2 transmission. Computer Methods and Programs in Biomedicine, 199, 105896. [doi:10.1016/j.cmpb.2020.105896]
WILENSKY, U., & Rand, W. (2015). An Introduction to Agent-Based Modeling: Modeling Natural, Social, and Engineered Complex Systems with Netlogo. Cambridge, MA: MIT Press.
WORBY, C. J., & Chang, H. H. (2020). Face mask use in the general population and optimal resource allocation during the COVID-19 pandemic. Nature Communications, 11(1), 1–9. [doi:10.1038/s41467-020-17922-x]
XIANG, X., Kennedy, R., & Madey, G. (2005). Verification and Validation of Agent-based Scientific Simulation Models. Agent-Directed Simulation Conference, 47–55. http://www.nd.edu/~nom/Papers/ADS019_Xiang.pdf
YOUGOV. (2020a). Maßnahmen in der krise: Vertrauen in die deutsche regierung wächst. Available at: https://yougov.de/news/2020/04/01/.
YOUGOV. (2020b). YouGOV COVID-19 tracker: Fear of catching.Availble at: https://yougov.co.uk/topics/international/articles-reports/2020/03/17/fear-catching-covid-19.