Identifying Personal and Social Drivers of Dietary Patterns: An Agent-Based Model of Dutch Consumer Behavior

, ,
and
aUtrecht University, Netherlands; bVrije Universiteit Amsterdam, Netherlands; cWageningen University & Research, Netherlands
Journal of Artificial
Societies and Social Simulation 27 (1) 4
<https://www.jasss.org/27/1/4.html>
DOI: 10.18564/jasss.5020
Received: 10-May-2022 Accepted: 27-Jun-2023 Published: 31-Jan-2024
Abstract
Understanding the drivers of dietary decisions is crucial for encouraging and facilitating environmentally sustainable consumption patterns. Previous work has focused on the utility that consumers place on factors such as price, quality, and ethics when making dietary decisions, or on the effects of personal values and peer influence on consumption of individual products. However, less attention has been paid to the interacting roles of values, perceptions, and social networks in dietary decision-making, and how these relate to mismatches between values and diet choice. Here, we develop an agent-based model of individual consumers making choices between five possible diets: omnivore, flexitarian, pescatarian, vegetarian, or vegan. Each consumer makes decisions based on personal constraints and values, and their perceptions of how well each diet matches with those values. Consumers can also be influenced by each other’s perceptions via interaction across three social networks: household members, friends, and acquaintances. We show that consumers primarily make decisions based on cost and taste, even when they value ethics and health, and illustrate three potential causes of the ‘attitude-behavior gap’ between ethical motivations and diet choice. This highlights the potential for both policy-driven changes to pricing structures, and increased awareness around sustainability and health attributes of different diets, in overcoming constraints and misperceptions to facilitate transitions to sustainable diets.Introduction
Diet has a considerable impact on individual and public health, as well as land and resource use across the wider food system. The food system is becoming increasingly unsustainable, with problems including deforestation, biodiversity loss, water and soil pollution, and greenhouse gas emissions (FAO 2020; Springmann et al. 2018a). The public health burden of chronic diseases linked to diet has also increased in recent years, leading many to argue for a dietary shift to improve health and mitigate climate change and other environmental impacts (Aleksandrowicz et al. 2016; Himics et al. 2022; Springmann et al. 2016). While the complexity of the food system necessitates that these challenges be approached from multiple angles (Hoek et al. 2021), relying exclusively on supply-side measures is insufficient and undesirable (Creutzig et al. 2018). However, there are dietary patterns with considerably lower environmental impacts, such as predominantly plant-based flexitarian, pescatarian, vegetarian, and vegan diets (Springmann et al. 2018a; Springmann et al. 2018b). Therefore, clearer understanding is needed of both the underlying drivers of current dietary patterns and related leverage points to shift consumers toward healthier and more sustainable diets.
Food choice encompasses a range of factors including personal values and constraints, social interactions, and habit (Geurts et al. 2017). In this context, values specifically refer to the intrinsic and extrinsic importance that an individual places on aspects of food items or dietary categories, such as price, taste, ethical considerations, and health. However, these values are often juxtaposed against one another and other personal and contextual factors, such as accessibility and affordability. Such trade-offs may limit or even prevent some individuals or groups from changing their diets. This phenomena of conflicting motivations and priorities causing consumers with pro-environmental attitudes or intentions to continue following unsustainable consumption patterns is commonly referred to as the ‘attitude-behavior gap’ or ‘intention-behavior gap’ (Hoek et al. 2019). Additionally, as eating is a socio-cultural practice (Brons & Oosterveer 2017; Olstad & Kirkpatrick 2021; Warde 2016), people are often sensitive to the norms and preferences of their dining partners and wider social circle (Cruwys et al. 2015; Geurts et al. 2017), and social norms have been shown to have a stronger effect in driving dietary change than factual information (Eker et al. 2019).
Individuals have been shown to self-categorize based on multiple personal and social identities, and to mostly conform to the behaviors and attitudes of whichever identity is most salient in the given context (Hogg & Reid 2006; Spears 2021). For example, someone may be influenced by both their identity as a family member of a family who does eat meat, and their identity as a vegetarian and alignment with others who do not eat meat, and they may make behavioral or attitudinal changes to fit with the social context in which they find themselves. Additionally, while individuals often use their perceptions to evaluate those of others, the perceptions of others can also be used to validate one’s own views (Higgs 2015; Spears 2021; Turner 1991).
While previous empirical work on dietary behavior and its drivers can highlight how different attributes of products or situations may influence choice (Cruwys et al. 2015; Prinsen et al. 2013), agent-based models (ABMs) allow for research options that are difficult, impractical, or even ethically or logistically impossible in experimentation. In ABMs, heterogeneous agents follow behavioral rules that guide their actions and interactions with one another and their environment. In ABMs of human systems, it is therefore possible to thoroughly investigate effects of changes in personal, social, and contextual factors simultaneously, and how these may interact to shape decisions. Within the context of diets, this could take the form of analyzing the potentially juxtaposed values and constraints, introduced above, that influence food choices. These models can effectively combine the controlled environment of choice experiments, with the contextual embeddedness of more sociological experiments, while also incorporating insights from a broad range of related theories and data in model design and parameterization. They can then be applied to test larger and potentially more disruptive changes – hypothetical or real – across the entire modelled population, while monitoring consumer perceptions, values, and behavior over time. ABMs are also particularly suitable for explicitly representing human interactions to incorporate social network dynamics and influence. As agent-based modeling can incorporate the multiple sources of influence and iterative processes of evaluation and updating of perceptions, it is useful for exploring the spread of influence (such as changes in diet) through a social network, and how that intersects with more group-based identity processes (Spears 2021).
Given these strengths, it is perhaps surprising that ABMs have only recently started being used to explore drivers of dietary choices, with most models to date focusing on decisions about single products such as meat (Scalco et al. 2019), milk (Gibson et al. 2021, 2022), sugar-sweetened beverages (Lee et al. 2018), or wine (Taghikhah et al. 2020), or on the food environment and inequalities therein (Blok et al. 2015; Li et al. 2018; Widener et al. 2013; Zhang et al. 2014).
In this paper, we focus on larger-scale dietary change motivated by the urgent need to transition our consumption patterns to be more sustainable. To do so, we develop an ABM of consumers making decisions about their diet. The model incorporates personal and social influences and constraints on dietary choices, with the aim of illustrating and clarifying different causes of the attitude-behavior gap around sustainable consumption. This will provide a basis for identifying possible ways to overcome this gap and facilitate more sustainable food consumption patterns. Widening the focus to generalized dietary patterns, rather than at the level of choice between individual food products, is useful for exploring how constraints and changing perceptions, mediated by social networks, can give rise to large scale dietary change necessary for sustainable food systems. Additionally, the shifts in diet that are necessary to establish sustainable food systems go far beyond shifts in individual product choices (Springmann et al. 2016; Springmann et al. 2018b), but these dietary changes could also pose larger cost burdens and therefore inequities. While healthy and sustainable diets can be less expensive (Springmann et al. 2021), the overall dietary composition must be considered to ensure that nutrient needs are met and all costs are included. Hence, models at the dietary scale can better inform policies aimed at shifting dietary patterns toward healthy, sustainable, and affordable diets for all.
Methods
The model is described here following the convention of the Overview, Design concepts, Details, and Decision-making (ODD+D) protocol (Müller et al. 2013): the model purpose, entities and state variables, process overview, and theoretical and empirical background are below; design concepts, sub-models, and other implementation details are in Appendix 1.
Overview
Purpose (purpose of study, audience of model)
The purpose of the model is to explore transition dynamics and potential leverage points related to consumer behavior that would lead to sustainable diets, and to identify policy options that could facilitate and accelerate this transition. In this paper, the model is presented, and its structure is analyzed. The audience of the model is scientists interested in food systems and dietary patterns and changes, as well as policy makers.
Entities, state variables, and scales
What kinds of entities are in the model? The model focuses on the decisions and interactions of consumer agents, who represent adult individuals making decisions about what diet to follow. The consumers make their dietary decisions based on financial constraints (income and household size), social influences, motivations, and perceptions of how well each diet matches these motivations. Here, the Capability, Opportunity, and Motivation model of Behavior (or COM-B, Michie et al. 2011) is used to structure these dimensions. In the COM-B, capability and opportunity relate to internal and external factors, respectively, that are linked to behavior: capability describes whether someone is personally able to manifest a certain behavior, while opportunity describes whether the context permits or prevents them from doing so. Motivation then relates to personal intrinsic and instrumental values, or whether an individual wants to take an action. In this model, motivations represent stable personal values, while perceptions are more dynamic opinions linking these motivations to specific courses of action – here, dietary choices.
Consumers are linked in a three-layer social network. The links between consumers include fixed networks of household members who share a food budget, fixed networks of friends, and dynamic networks of acquaintances, whose link strength and existence can change over the course of the simulation based on (in)frequency of contact. Consumers interact with those in their social networks, as well as new contacts, to exchange information about health and ethics perceptions; they can adapt their perceptions to be more similar to those of other consumers with similar motivations, or with whom they have a strong social link, or to distinguish themselves from dissimilar others.
The diets are represented by a collection of products conforming to a general dietary pattern. These are defined as omnivore (including meat, fish, eggs, and dairy), flexitarian (including the same foods as omnivores, but not eating meat daily or eating less than the average consumption of meat; Verain et al. 2022), pescatarian (including fish but not meat), vegetarian (including eggs and dairy, but not meat or fish), and vegan (excluding all animal products). The final price of each diet is the product of the cost of the goods it includes (calculated to feed one person for a week, based on Dutch consumption data, see Appendix 1) and the consumer’s household size. For the timescales of the model exploration here, the prices are assumed fixed.
Since the focus is on generalized diets, rather than specific foods or recipes, the consumers are assumed to know of the existence of all diets and have formed perceptions about the food groups and items included in each (and therefore the overall diet), as this information is widely available for the case study population. These perceptions can change over time due to frequency of purchase and social influences.
By what attributes are these entities characterized?
| Parameter | Description | Data type and values | Symbol |
|---|---|---|---|
| Cost motivation (\(M\)) | How motivated the consumer is by saving money/not spending much money on food. | Numeric [0, 1] | \(M_C\) |
| Taste motivation (\(M\)) | How much importance the consumer places on ‘taste,’ encompassing both sensory and perceived quality of the food. | Numeric [0, 1] | \(M_T\) |
| Ethics motivation (\(M\)) | How motivated the consumer is by sustainability-related concerns (e.g., environmental impact) | Numeric [0, 1] | \(M_E\) |
| Health motivation (\(M\)) | How motivated the consumer is to eat healthily | Numeric [0, 1] | \(M_H\) |
| Social information adherence (\(M\)) | How much weight the consumer gives to social information about health and ethics | Numeric [0, 1] | \(A_S\) |
| Satisfaction threshold (\(M\)) | How high the consumer’s diet utility must be for them to be satisfied and not consider choosing another diet in that timestep | Numeric [0, 1] | \(T\) |
| Household income (\(O\)) | The total weekly income of the adult members of the consumer’s household (EUR) | Numeric (0, unbounded) | \(I\) |
| Household size (\(C\)) | The number of people in the consumer’s household, including themselves. | Integer [1, 10] | \(H\) |
| Maximum willingness to spend (\(C\)) | The maximum percentage of household income the consumer is willing to spend on food | Numeric [0, 1] | \(S\) |
| Parameter | Description | Data type and values | Symbol |
|---|---|---|---|
| Diet name | The name of the diet, describing the dietary pattern it represents. | Categorical [omnivore, pescatarian, flexitarian, vegetarian, vegan] | \(d\) |
| Cost (\(C\)) | How much the diet costs (in EUR/person/week) | Numeric [0, unbounded] | \(C\) |
| State variable | Description | Data type and values | Symbol |
|---|---|---|---|
| Perceived taste/familiarity (\(M\)) | How much the consumer likes the taste of the products in the diet and finds them familiar | Numeric [-1, 1] | \(P_{T}\) |
| Perceived ethical impact (\(M\)) | How much environmental and animal welfare impact the consumer thinks the diet has | Numeric [-1, 1] | \(P_{E}\) |
| Perceived health (\(M\)) | How healthy the consumer thinks the diet is | Numeric [-1, 1] | \(P_{H}\) |
| Times consumed (\(O\)) | How many times the diet has been consumed | Numeric [0, timesteps] | \(\tau\) |
| Parameter | Description | Data type and values | Symbol |
|---|---|---|---|
| Financial feasibility (\(O\)) | Whether it is financially feasible for the consumer to purchase this diet (based on diet cost, household size and income, and maximum willingness to spend, assuming all household members follow this diet) | Binary | \(F\) |
| Perceived cost (\(M\)) | How expensive the consumer perceives this diet to be, based on their food budget and household size. | Numeric [-1, 1] | \(P_{C}\) |
| State variable | Description | Data type and values | Symbol |
|---|---|---|---|
| Link strength (\(O\))1 | How strong the link is between the two consumers (network is assumed symmetrical) | Numeric [0, 1] | \(L\) |
| Contacted this timestep? (\(O\)) | Whether the two consumers have interacted in this timestep | Binary (0, 1) | \(x\) |
| Number of interactions (\(O\)) | How many times the consumers have been in contact | Integer [0, timesteps] | \(V\) |
| Parameter | Description | Data type and values | Symbol |
|---|---|---|---|
| Is household member? (\(O\)) | Whether two consumers are residing in the same household and sharing a food budget (e.g. partners, other adult family members living at home) | Binary | \(\zeta\) |
| Is friend? (\(O\)) | Whether two consumers are friends, as opposed to acquaintances (link strength is assumed fixed) | Binary | \(\psi\) |
| Similarity (\(O\)) | The demographic similarity between two consumers, based on household size and income | Numeric [0, 1] | \(Q\) |
What are the exogenous factors/drivers of the model? There are no exogenous drivers in the model occurring during simulations – all parameters and state variables are initialized with data relevant to the case study or specific scenario.
How is space included in the model? Space is not explicitly included in the model. Given the density of food vendors in the case study area, and the similar product combinations available at most of them, food availability likely has a minor effect on overall dietary pattern choices, which is the focus of the model here.
What are the temporal and spatial resolutions and extents of the model? One timestep represents one week. The model is not intended to be run for timescales exceeding a few years (e.g. 5 years), as the assumptions of fixed networks of household members and closer friends would be less realistic, and other socioeconomic variables (e.g. incomes, food prices) are more likely to change qualitatively over that time.
To address the question of thematic resolution, a sensitivity analysis of population size was performed (see ‘Sensitivity Analysis’ below). As only minimal qualitative differences were observed across population sizes tested, it is assumed that the baseline population size chosen is adequate for the initial model exploration presented here.
Process overview and scheduling: What entity does what, and in what order?
Design concepts
Theoretical background
Food choice has been linked to individual factors, including constraints, such as budget and access; real and perceived health attributes; and personal preferences and motivations, such as taste and ethical considerations (Geurts et al. 2017; Hoek et al. 2019; Rosenfeld 2018). Social factors, including influence via perceived norms or direct pressure, also play a role in determining diet (Higgs 2015). In the model presented here, the individual factors are included in the cognitive architecture of the consumers, which is structured around the COM-B framework (Michie et al. 2011), as introduced. This framework was chosen as it includes contextual factors linked to both the individual agent and the situation, which have been shown to be important in driving food-related behavior (de Boer et al. 2007; Hoek et al. 2021; Rosenfeld 2018) along with factors related to personal values. The framework therefore allows for interactions and trade-offs to occur across different enabling and constraining variables, rather than assuming a direct relationship between any one potential driver of behavior and a behavioral outcome.
The consumers’ dietary decision itself is modeled with a utility function. These have been used widely in both models and empirical choice experiments (Hanley et al. 1998; van der Pol et al. 2014; Zhang & Vorobeychik 2019) to represent individuals making decisions by considering multiple, possibly juxtaposed criteria, which may include non-economic factors. Additionally, the utility function can represent consumers making decisions that are more (or less) driven by different types of values: altruistic (ethics), personal (health and cost), hedonic (taste), or social (popularity, via adapting perceptions to be more similar to those of contacts). After calculating the expected utility of each option, the option with the highest utility can be selected, which is the optimal outcome under the constraints and criteria included (Zhang & Vorobeychik 2019). In this model, the utility of a diet is assumed to be based on how the consumer perceives the cost, taste, ethics, and health of the diet, combined with how strongly they weigh each of these attributes. The final decision contains an element of stochasticity (see ‘stochasticity’ subsection below), but the result of this stochastic variable depends on the strengths of the different utilities: in case the utility of one diet is much larger than the others, the probability that this diet is chosen is large as well.
While utility maximization could be criticized for oversimplifying decision-making, weighing factors in this manner may play a role in decision-making, especially where consumers make conscious choices. However, habit and practice are likely also driving factors in dietary decision-making specifically (Hoek et al. 2017; van’t Riet et al. 2011). To capture this habitual factor, the model assumes that consumers follow a ‘satisficing’ behavior (Jager et al. 2000); they are more likely to continue to follow a diet that is mostly satisfactory based on previous evaluations, rather than re-evaluating all diets each timestep and changing as soon as another diet would be perceived as a closer match to their motivations. Therefore, a consumer may continue to follow a sub-optimal diet, in terms of utility, for some time before changing.
The social interactions in the model are formulated based on social identity theory, which posits that individuals categorize themselves into social groups that maximize in-group homogeneity and out-group heterogeneity (Hogg & Reid 2006; Nezlek & Forestell 2020; Terry et al. 1999). Here, this occurs when consumers are more likely to accept influence on their perceptions from those with whom they have stronger social links, similarly motivated others, or both (the ‘in-group’), or to move in the opposite direction of influence from very differently motivated others with weaker link strength or no link between them (the ‘out-group’). Additionally, individuals have been shown to have different levels of susceptibility to social influence (see review in Falk & Scholz 2018), which is represented here by the consumer-level parameters determining how much a consumer will change toward or away from a peer’s perceptions during interactions. A consumer is unlikely to be able to perfectly perceive a social contact’s motivations, however, to determine whether they are open to influence from the contact. Therefore, the stochasticity in accepting or rejecting influence also represents otherwise non-modeled aspects, such as the influence of imperfect information, emotional state, purposeful misrepresentation of motivations, or other contextual factors making the consumer temporarily more or less open to influence.
The social influence on individual consumers occurs across the social network connecting them. This is represented by a small-world network (Watts & Strogatz 1998) with consumers more likely to be socially connected with those who are demographically similar to them. This allows for a diversity of individuals who share some connection, but higher likelihood of interaction between more similar consumers (McPherson et al. 2001). Similarity is calculated based on household size and annual income, as it is assumed that consumers would be most likely to interact around similar jobs, children’s schools and activities, neighborhoods with similar-sized homes and price ranges, or events and locations that focus less on families.
Each consumer has a three-layer social network: a static layer of household members (‘household network’), a second static layer of close friends (‘friends network’), and a dynamic layer of other friends and acquaintances (‘acquaintances network’). This is a simplified representation, following Conti et al. (2011), of the multi-layer network structure proposed by Hill & Dunbar (2003). Throughout the simulation, the links in the acquaintances network can form, strengthen, weaken, or be dissolved based on contact (Arentze & Timmermans 2008; Fehr 1996; Rose & Serafica 1986). The other two networks are fixed during the simulation, under the assumption that these are likely to be more stable (Rose & Serafica 1986), especially over the shorter timescales (\(\sim\) 2-5 years) of interest for this model. The inclusion of both demographic homophily and potential for network structural change following a clear and evidence-based rule is a potential improvement over previous models using static networks or stochastic rewiring. Adult household members influence each other’s perceptions at each timestep, but do not necessarily adhere to the same diet. Children in a household are not modeled explicitly but are assumed to eat an equal combination of what the adults eat (Savage et al. 2007), and are included in cost calculations.
Individual decision-making
The individual decision-making focuses on consumers’ decisions around broad dietary categories, abstracting out the detail of decisions between individual products (e.g. apples versus celery). This simplification still allows the model to produce an overall picture of dietary behavior and its relationship to personal values and different sources of information and influence, while reducing the data and computation requirements. The consumers make their decisions based on the match between their individual motivations and their perception of the relevant attributes of each diet, with the aim of choosing a diet that maximizes the overall satisfaction of their motivations. As the consumers’ final choices are probabilistic, with more satisfactory diets having a higher probability of being chosen (see ‘Stochasticity’ below), there is an element of uncertainty included to cover the unpredictability of human decision-making, and events and considerations not explicitly modeled. As such, the basic rationality is bounded – while consumers use a utility function for their decision-making, the utility is not purely economic, and the ultimate outcome also includes probabilistic satisficing. The consumers’ perceptions and motivation-related variables can also change through interaction with other consumers.
Spatial and temporal aspects are not assumed to play a role in the decision process, given the high spatial density of food suppliers in the study area of the Netherlands, and the abstraction of details related to specific products that would change convenience and preparation time (e.g. choosing ready-made food or prepared ingredients). While there are likely spatiotemporal aspects to social network structures and dynamics, data on this is not readily available and therefore this is not included.
Learning
The process of taste change, based on experience, could be conceptualized as a process of individual learning: as consumers (repeatedly) buy a given diet, they increase their liking for it, which represents greater familiarity with the taste (Aldridge et al. 2009; Birch 1999; Pliner et al. 1993), as well as preparation considerations such as learning new recipes. This more positive perception of a given diet increases their likelihood of buying it again.
Collective learning is not directly implemented in the model, apart from the potential for a social network to shift toward a subset of diets about which they have developed and exchanged positive perceptions.
Individual sensing
Sensing is represented in the model by the consumers’ perceptions of different diets. These are the “criteria” used in the multi-criteria algorithm for choosing a diet. They are initialized with price and survey data, and include both objective criteria such as feasibility, which is a function of diet cost and consumer income, and subjective criteria such as tastiness. These perceptions are heterogeneous across consumers, and health and ethics perceptions can be erroneous. There is no cost for the cognition that is related to sensing; it is assumed to be part of the cognitive demands of buying and eating food (e.g. budgeting, reading price tags and ingredient labels, preparing and eating food) and interacting with social contacts. The sensing processes are not explicitly modeled, apart from social influences on perceptions.
In addition, consumers can be conceptualized as ‘sensing’ the health and ethics perceptions and motivations of their social contacts, at least enough to identify whether their motivations are similar. This process is not explicitly modeled beyond the modeling of the interaction (see ‘interactions’ below), but it is assumed to occur through the conversations and time spent with these contacts. The stochasticity in accepting influence on perceptions is assumed to cover any error in assessing social contacts’ motivations (i.e. misjudgment of similarity).
Individual prediction
Consumers do not attempt to predict future conditions.
Interactions
Interactions between the consumers take place both directly, between social contacts, and indirectly, through the influence of current contacts’ previous contacts. Two consumers have a higher probability of interacting if they have a stronger link between them, are demographically similar, or both. The process of updating perceptions and during interactions is modeled explicitly, but the details of the exchange (i.e. how the consumers sense one another’s motivations and perceptions) is not (see ‘sensing’ above). The communication is simply represented through the updating of health and ethics perceptions of the contacts’ current diets.
The structure of the social network is initially imposed, but as links in the acquaintances network can change, the structure becomes an emergent outcome of the simulation.
Collectives
The consumers belong to a social network (see ‘interactions’ above) that is dynamic and is modeled as influencing the probability of interactions. The network is represented by links of differing strength between consumers.
Heterogeneity
The consumers are potentially heterogeneous across all variables (Table 1) and social network links. As consumer variables are initialized based on distributions from empirical data, there is a possibility that consumers may share some variable values (e.g. household size). Additionally, consumers who are household members have the same household income and size.
Consumers follow the same overall strategy for diet selection, interaction, and changes to perceptions due to this interaction. However, given the differences in state variables and parameters, the exact outcome of these decisions will vary considerably across consumers. Additionally, the stochastic elements present in decision-making and influence mean that even identical consumers in the same situation could make different decisions, and consumers may influence each other differently.
Stochasticity
Stochasticity is present in the model at initialization, dietary decision-making, interaction, and updates to taste preferences. First, at initialization, consumers are assigned a household size, income, motivations, and perceptions based on distributions and ranges from empirical data (see ‘initialization’ below). Therefore, the precise motivation assigned for each attribute to a given consumer is not fixed. Throughout the simulation, interaction itself is also stochastic, both in terms of occurrence and outcomes: consumers have a probability of interacting based on connection strength and demographic similarity, but there is no fixed threshold or other guarantee that any two consumers will interact in a timestep (apart from consumers who are part of the same household). Moreover, the consumers each have a probability of accepting or distancing themselves from the other’s perceptions, based on the similarity of their relevant motivations. Finally, there is a stochastic error term in the updating of consumer’s taste preferences of a diet they have tried in that timestep, to represent different experiences with cooking, context, and other aspects not modeled here that may influence taste.
Additionally, the satisfaction a consumer has with their current diet determines both the probability of a consumer choosing to re-evaluate all possible diets, and the probability that they will choose that diet (again). Therefore, while consumers have a high probability of acting in line with their preferences, there is a non-zero probability that a consumer may buy a diet that does not fit with their preferences (due to factors not modeled here, such as the presence of guests at meals, or spontaneity and unpredictability).
Observation
At each timestep, the current diet and perceptions of each consumer are recorded, along with the structure of the social network.
The diets chosen by the consumers, and their perceptions, are the main emergent phenomena of interest. The structure of the dynamic acquaintances network, which partially determines processes of social influence, is a secondary emergent outcome that can influence this.
Implementation details
The model is implemented in NetLogo v6.2.1 and is available on CoMSES.
Initialization
The model is initialized using food price, motivations, perceptions, and demographic data for the Netherlands from 2012 - 2016 (see Appendix 1). Initial diet frequencies were not calibrated to data directly, but resulted from the same choice submodel used throughout the simulation runs. Therefore, modeled frequencies could be compared to data and used for validation. The social network connections are assigned stochastically, then rewired to form a small-world network with the probability of a tie forming between agents based on demographic homophily. Household members and friends are connected at initialization and remain connected for the duration of the simulation. Some acquaintances are connected, but these connections can increase or decrease in tie strength or cease to exist, or new acquaintance-level connections may form.
The behavioral rules of the model are not explicitly linked to the study area as they are based on general theories on human behavior, but using a case study area constrains the initial parameterization for easier analysis and validation. Several data sources were used to parameterize the consumer attributes, diets, and social interaction frequency to reflect the Dutch case study population (see Appendix 1). These included demographic data on incomes and household sizes, dietary recall survey data and associated price information, consumer surveys on motivations and perceptions, and the European Social Survey questions related to attitudes and beliefs.
Input data
The model does not use input data after initialization – all processes occur endogenously.
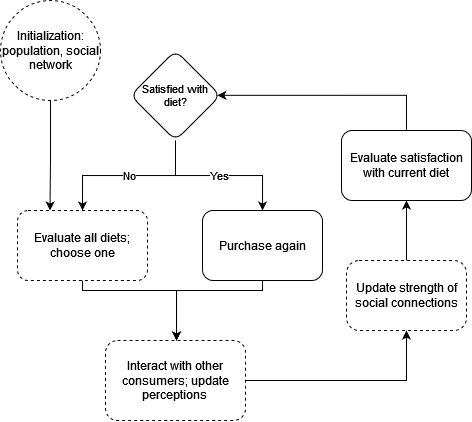
Submodels
Evaluate satisfaction with current diet: At the beginning of each timestep, consumers evaluate their satisfaction with their current diet \(d\), considering their potentially changed perceptions from the previous timestep. Their satisfaction is calculated as the utility of their current diet, which includes financial feasibility \(F\) and how well their perceptions of it (\(P\)) match with their motivations \(M\), or food-related values. These include (low) cost \(C\), taste \(T\), health \(H\), and ethical \(E\) dimensions \(\delta\). The utility of a given diet \(d\) is calculated as:
| \[ U_{d} = F_{d}\frac{(\sum_{\delta \in C, T, H, E} M_{\delta}P_{\delta, d}) + 1}{2}\] | \[(1)\] |
The normalization rescales the diet utility to within [0, 1]. This utility is then compared to their satisfaction threshold to determine whether they will evaluate other diets or keep their current diet. While they may still choose the same diet if they evaluate other options, they only have the possibility of changing their diets if they are dissatisfied and therefore go through the evaluation process.
Evaluate diets and choose one: The probability of a consumer choosing a given diet is then calculated as the normalized utility across all diets,
| \[ prob(U_{d}) = \frac{U_{d}}{\sum_{d}U_{d}}\] | \[(2)\] |
The financial feasibility of a diet is calculated assuming that all members of the household follow that diet:
| \[ F_{d}= \begin{cases} 0; \; \xi_{d} > IS\\ 1; \; \xi_{d} \leq IS \end{cases}\] | \[(3)\] |
| \[\xi_{d} = HC_{d} - 0.1(HC_{d}(H -1))\] | \[(4)\] |
Identify and interact with contacts: At each timestep, consumers can interact with one another, which provides both interaction partners with information about the others’ perceptions, motivations, and diet choices. The probability of any two consumers interacting is a function of the social network size (total strength of all links) of the contacting consumer, the strength of the connection between them \(L\), or if this is zero, their demographic similarity \(Q\),
| \[ prob(interact)= \begin{cases} \frac{L_{i,j}}{\sum_{k \neq j}L_{i,k}}; \; L_{i,j} > 0\\ \frac{Q_{i,j}}{\sum_{k \neq j}L_{i,k}}; \; L_{i,j} = 0\\ Q_{i,j}; \; \sum_{k \neq j}L_{i,k} = 0 \end{cases}\] | \[(5)\] |
Here, the similarity is calculated across household income and size using a loss function modified from Beckman et al. (1996),
| \[ Q_{i,j} = (1 - |\frac{I_{i} - I_{j}}{I_{max} - I_{min}}|) (1 - |\frac{H_{i} - H_{j}}{H_{max} - H_{min}}|)\] | \[(6)\] |
This rescales the household income and size, such that similarity is bounded to [0, 1].
Consumers test each of their social contacts (except household members) in order of link strength, or similarity if not directly connected, to identify those with whom they will interact in each timestep. This is done using a random number compared to the probability calculated above. They can only interact with a maximum number of other consumers each timestep (determined by a model parameter, see Table 7). Household members then interact each timestep by default.
Update perceptions: During interactions, consumers update their taste perceptions based on their experiences, and their health and ethics perceptions of the diets their social contacts follow based on interactions. As the cost perception of each diet is based on its actual cost discounted for that household size \(\xi_{d}\) (see Equation 3), as well as consumer income \(I\), and willingness to spend \(S\), all of which are fixed, the cost perception does not change. It is calculated as:
| \[ P_{C,d}^{'} = max (-1, min(1, -2\frac{\xi_{d}}{IS} + 1))\] | \[(7)\] |
Of potential influences on taste, such as context, emotion, and exposure (Capaldi 1992; Capaldi & Van den Bos 1991), only the latter is explicitly modeled here. Therefore, it is assumed that consumers only incorporate their own experience in their taste perception, with more frequently consumed diets being preferred. Here, taste is conceptualized as representing the overall flavor profile of a given diet, rather than the individual foods within it, so preferences are not changed by consuming a similar diet (e.g., consuming a vegetarian diet does not also make a vegan one more liked, as the vegetarian could be particularly fond of eggs and therefore not find an otherwise similar diet to be as tasty).
At the end of each timestep \(t\), consumers therefore update their perception of taste \(P_{T}\) of each diet \(d\) as the following,
| \[ P_{T,d,t}= \begin{cases} P_{T,d,t - 1} + \frac{1 - P_{T,d,t - 1}}{1 + \phi e^{\epsilon - k\tau}}; \; c = 1\\ -1 + \frac{P_{T,d,t - 1} + 1}{1 + \phi^{-1} e^{- k(t - \tau)}}; \; c = 0 \end{cases}\] | \[(8)\] |
In contrast, consumers can update their health and ethics perception based on social information from other consumers. The probability that a consumer will accept influence on these perceptions from another consumer is proportional to the similarity in their motivations, and the strength of their social connection, if applicable. Specifically, the probability that consumer \(i\) would accept influence from consumer \(j\) about the health perception \(h\) of \(j\)’s current diet \(d\) is:
| \[ prob(accept) = \frac{L_{i,j} + |M_{H,i} - M_{H,j}|}{2}\] | \[(9)\] |
| \[ prob(reject) = \frac{2 - L_{i,j} - |M_{H,i} - M_{H,j}|}{2}\] | \[(10)\] |
Consumers who neither accept or reject the influence ignore it and their perceptions remain unchanged. This assumes that if a link between them and the contacted consumer is not strong enough, the motivational difference is not large enough, or both, consumers can simply not care.
If consumer \(i\) chooses to accept the influence, they update their perception as:
| \[ P_{H,d,i}^{'} = max(-1, min(1, P_{H,d,i} + A_{S,i}(P_{H,d,j} - P_{H,d,i})))\] | \[(11)\] |
Alternatively, if consumer \(i\) rejects the influence, they update their perception to diverge from that of \(j\):
| \[ P_{H,d,i}^{'} = max(-1, min(1, P_{H,d,i} - A_{S,i}(P_{H,d,j} - P_{H,d,i})))\] | \[(12)\] |
In each interaction, \(i\) and j update separately but synchronously, so their updates do not affect each other, and it is possible for them to influence each other in opposite directions.
Update social connections: At each timestep, consumers can create new social connections (links) with other consumers with whom they have interacted, if these were not already part of their social network. These new social connections then become part of their acquaintances network – the networks of household members and friends are assumed fixed. The link strength \(L\) between two consumers \(i\) and \(j\) at time \(t\) is updated as:
| \[ L_{i,j,t}= \begin{cases} L_{i,j,t - 1} + \frac{1 - L_{i,j,t - 1}}{1 + \gamma e^{-\Delta v}}; \; x = 1\\ \frac{L_{i,j,t - 1}}{1 + \gamma^{-1} e^{- \Delta(t - v)}}; \; x = 0 \end{cases}\] | \[(13)\] |
What are the model parameters, their dimensions and reference values?
| Variable | Description | Symbol | Data type and range | Baseline value | Range for sensitivity analysis |
|---|---|---|---|---|---|
| No. of consumers | The population size in the simulation run | \(N\) | Integer [1, unbounded) | 250 | [125, 375] |
| Initial rewiring probability | The probability of rewiring when setting up the network initially | \(p(r)\) | Integer [0, 1] | 0.5 | [0.25, 0.75] |
| Initial mean ‘friends’ network node degree | The average number of friends a consumer is connected to initially | \(\mu(d_{F})\) | Integer [0, unbounded) | 5 | [2, 11] |
| Initial mean node degree | The total number of close friends and acquaintances a consumer is connected to initially | \(\mu(d)\) | Integer [1, 200] | 50 | [25, 75] |
| Mean household network link strength | Mean link strength among social contacts in the same household | \(\mu(L_{H})\) | Numeric (0, 1] | 0.925 | [0.879, 0.971] |
| SD of household network link strength | Standard deviation of link strength among household contacts | \(\sigma(L_{H})\) | Numeric (0, 1] | 0.025 | [0.024, 0.026] |
| Mean ‘friends’ network link strength | Mean link strength among friends in the network | \(\mu(L_{F})\) | Numeric (0, 1] | 0.825 | [0.784, 0.866] |
| SD of ‘friends’ network link strength | Standard deviation of link strength among friends | \(\sigma(L_{F})\) | Numeric (0, 1] | 0.025 | [0.024, 0.026] |
| Mean ‘acquaintances’ network link strength | Mean link strength among acquaintances in the network | \(\mu(L_{A})\) | Numeric (0, 1] | 0.350 | [0.175, 0.525] |
| SD of ‘acquaintances’ link strength | Standard deviation of link strength among acquaintances | \(\sigma(L_{A})\) | Numeric (0, 1] | 0.05 | [0.025, 0.075] |
| Max. number of contacts per step | Maximum number of contacts a consumer can make in each timestep | \(X_{max}\) | Integer [0, No. of consumers] | 10 | [5, 15] |
| Social information adherence scaling factor | Multiplier of social information adherence input data | \(\alpha\) | Numeric [0, 1] | 0.025 | [0.001, 0.1] |
| Mean satisfaction threshold | Mean of consumer satisfaction thresholds across the population | \(\mu(T)\) | Numeric [0, 1] | 0.50 | [0.25, 0.75] |
| SD of satisfaction threshold | Standard deviation of consumer satisfaction thresholds across the population | \(\sigma(T)\) | Numeric [0, 1] | 0.05 | [0.025, 0.075] |
| Mean max. % of income spent on food | Mean of the percent of income consumers consider feasible maximum to spend on food | \(\mu(S)\) | Numeric [0.1, 0.2] | 0.16 | [0.08, 0.24] |
| SD of max % of income spent on food | Standard deviation of percent of income considered feasible maximum | \(\sigma(S)\) | Numeric [0.01, 0.05] | 0.01 | [0.005, 0.015] |
| Taste perception change rate | Rate of taste perception change with exposure | \(k\) | Numeric [0,1] | 0.01 | [0.005, 0.015] |
| Taste perception change gradient | Gradient of taste perception change from previous value | \(\phi\) | Numeric (0, Inf) | 50 | N/A2 |
| Taste perception change error | Stochastic error applied to taste perception change when a diet is consumed | \(E\) | Numeric [0, 1] | 0.001 | [0.0005, 0.0015] |
| Link strength change rate | Rate of link strength change with interaction | \(\gamma\) | Numeric [0, 1] | 0.001 | [0.0005, 0.0015] |
| Link strength change gradient | Gradient of link strength change from previous value | \(\Delta\) | Numeric (0, Inf) | 50 | N/A3 |
How were submodels designed or chosen, and how were they parameterized and then tested?
Given the multiple, interacting sources of influence on perceptions and diets in the model, the submodels were designed to facilitate testing of each separately before the full model was run. This clarified that the basic food choice submodels were operating as intended, then identified how social influence and network structure changes influenced food choice, and each other. It also allowed for the establishment of a reasonable set of baseline parameters that generated expected behavior for each submodel individually and together.
First, food choice alone (with no social influence or network changes) was tested, by setting the maximum number of social contacts to 0 and removing the code for the default interaction between household members. The sensitivity of outcomes to both parameters and structural changes to the submodel was then tested: first, by only including price and taste motivations and perceptions, then including health in the utility function, and finally also including ethics.
Next, a one-factor-at-a-time (OFAT) sensitivity analysis was performed for the parameters defining the mean and standard deviation of maximum percent of income that consumers were willing to spend on food, and the rate of taste perception change (and related error term) based on exposure. As social influence and network structural change were not included, parameters for initial rewiring probability, and average number of other consumers in each ‘friends’ and ‘acquaintances’ networks were set to 0 for faster network set up.
Testing social influence occurred in two stages: first, without network structural changes (i.e. all three network layers were fixed), then with network structural changes in the ‘acquaintances’ social networks. An OFAT sensitivity analysis was performed for the parameters of population size, initial rewiring probability during network formation, average number of other consumers in each ‘friends’ and ‘acquaintances’ networks, means and standard deviations of link strength for each social network, and maximum number of social contacts per timestep (for runs without structural change), as well as link change rate (for runs with structural change). Runs with baseline parameters were also performed for the three conditions of (1) without influence, (2) with influence and without structural change, and (3) with influence and structural change, to compare the influence of the submodels themselves.
Validation
In addition to unit testing to ensure that the model code produced the expected behavior (Appendix 1), model outcomes were validated at both the population level and the connection between individual and population levels, using model runs with baseline parameters and all submodels included. First, the frequencies of each diet across the modeled population were compared to empirical diet frequency data from the Netherlands across the same time period as diet price parameterization data (2012-2016). The frequency of diet changes and the duration of each diet followed of individual consumers were also calculated. This showed the stability of the consumer-level outcomes, and how this related to the overall population-level diet frequencies.
Sensitivity analysis
Determining parameter ranges for sensitivity analysis
For the sensitivity analysis, baseline values for global parameters were sourced from data where possible, or were estimated from initial testing of the model. For the sensitivity analysis, the maximum and minimum values for most variables were set at 50% higher and lower than this ‘baseline’ value, respectively. For variables such as mean and standard deviation link strength of family, friends, and acquaintances networks, where using a range of \(\pm\) 50% would considerably exceed the bounds of the variable (i.e., [0, 1]), the range was \(\pm\) 5%.
Diet calibration
Using the baseline parameters, but without social interaction or network structural change, the mean frequencies of each diet during the first 10 timesteps across 10 replicates were calculated. These were compared to observed distributions of diets in the Dutch population around the years of the data used for initialization (Appendix 1).
Model stability
To test whether the model reached a quasi-stable state within a run or across a parameterization, 50 runs were performed with baseline parameters and both social interaction and network structural change submodels included. The coefficient of variation (ratio of standard deviation to mean) for each outcome variable was calculated across the runs at each timestep, to determine the necessary number of replicates to account for the stochasticity in the model, following Lorscheid et al. (2012). A final value of ten replicates was identified as sufficient to cover the stochasticity in the baseline parameterization (Appendix 1).
One-factor-at-a-time sensitivity analysis
A one-factor-at-a-time (OFAT) sensitivity analysis was performed to identify first-order relationships, following ten Broeke et al. (2016). Here, all parameters were set at their baseline except the one being tested, which was set at 10 values spanning its entire range. The parameters were tested within the testing of the submodel to which they belonged (see ‘Submodel testing’ above). Ten replicates for each parameterization were used throughout for simplicity, despite decreased levels of stochasticity in runs not including all submodels.
Sensitivity of model to input data
Using the full model (with social interaction and network structural change) with the baseline parameterization, runs were performed to test the effect of changing the price of one diet at a time by -10%, -5%, 5%, and 10%. This is considerably higher than the variability during the period from which price data was obtained, and more in line with more recent price increases which have been shown to change dietary patterns somewhat (e.g., Statistics Netherlands 2022; Rtl Nieuws 2021), allowing this exploration to be a preliminary scenario analysis as well as an extension to the sensitivity analysis.
Results
Overall, the model demonstrated that cost and taste were major drivers of dietary choice, but that changing the prices of individual diets by up to 10%, as done here, did not considerably affect the frequency of diets within the population. Social influence did affect health and ethics perceptions, but it had a limited effect on observed dietary frequencies due to the lesser role of health and ethics perceptions in determining dietary choice in the model. Model outcomes were robust to changes in model structure and parameterization.
Factors determining dietary choice
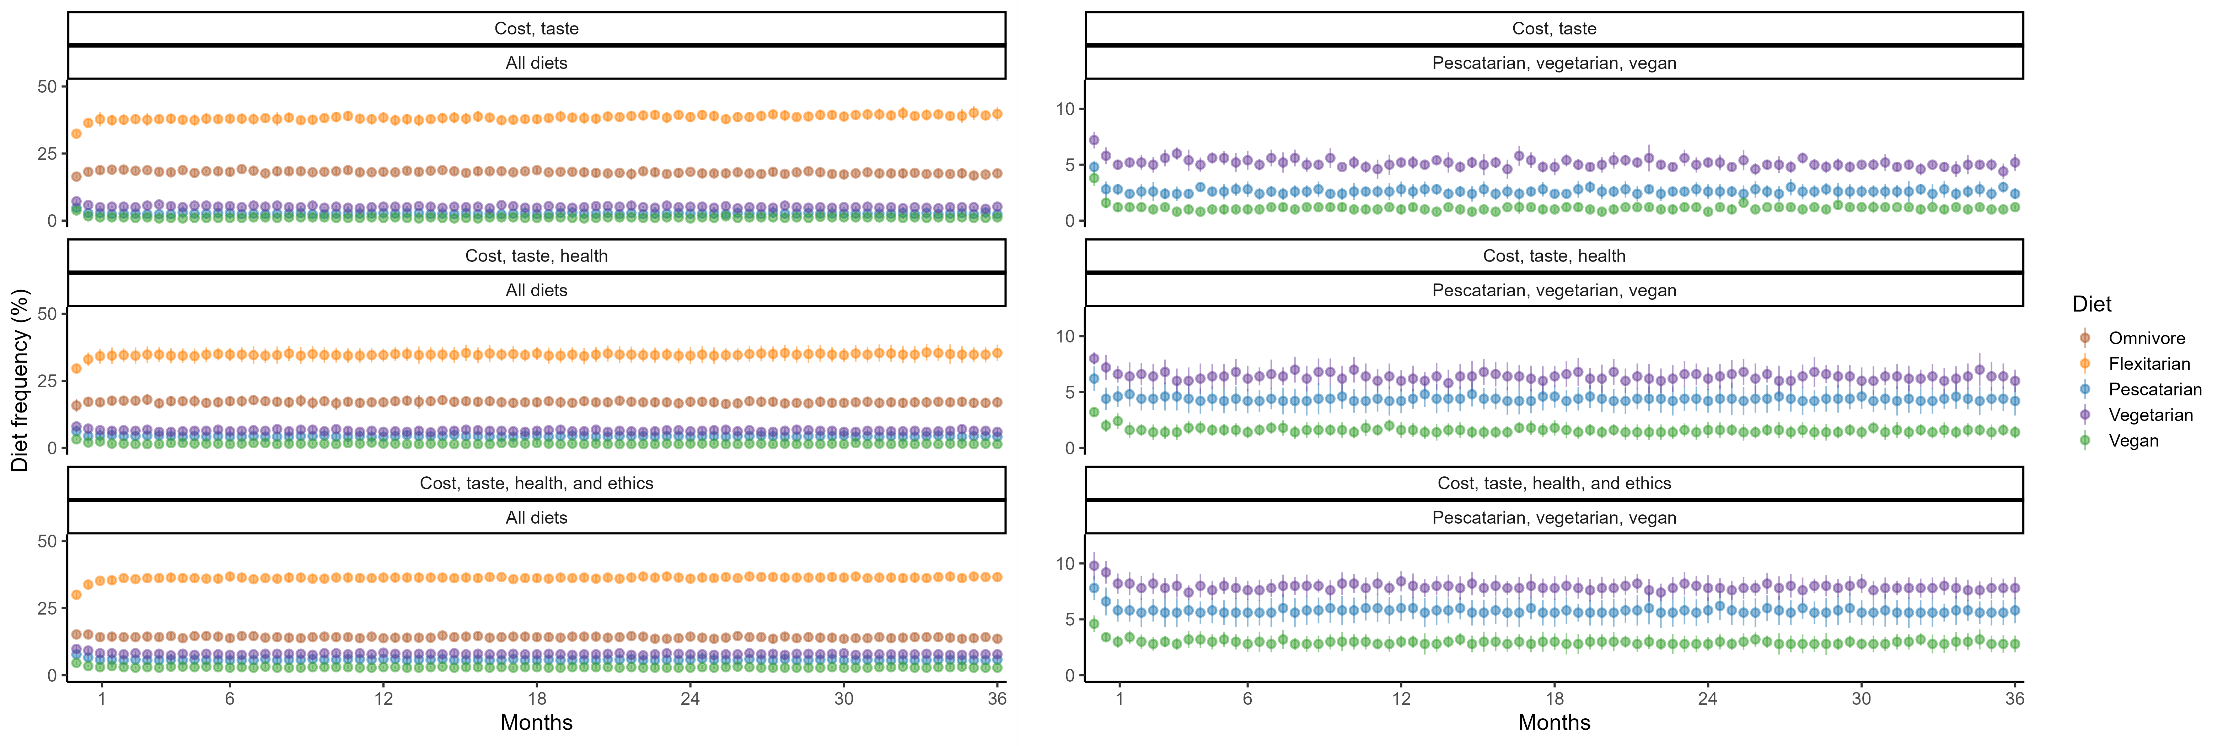
Figure 2 shows the frequency of different diets over time, for model runs where consumers evaluated their dietary options with a utility function including either cost and taste; cost, taste, and health; or cost, taste, health, and ethics. For the utility functions including health or health and ethics, the proportion of omnivores decreases, while the proportion of plant-based diets increases slightly. However, the overall pattern is similar across utility functions. The overall frequency of diets stabilizes after approximately the first month (4 - 5 timesteps).
While diet frequencies were stable at the population level, individual consumers varied in the duration with which they followed a given diet, and the frequency with which they changed diets. Many consumers changed diets infrequently, maintaining a single diet for long time periods, but also briefly trying one or two other diets (Appendix 3). Consumers following flexitarian diets were the most stable in their choice, followed by vegetarians and omnivores, and the most frequent dietary changes occurred from flexitarian to vegetarian (Appendix 3).
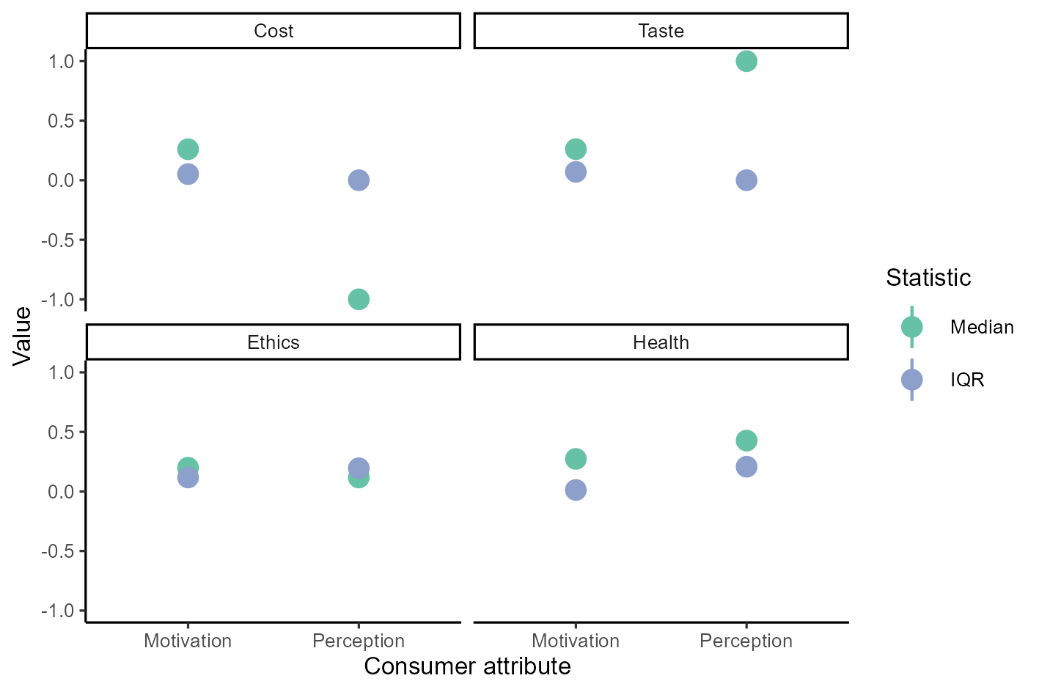
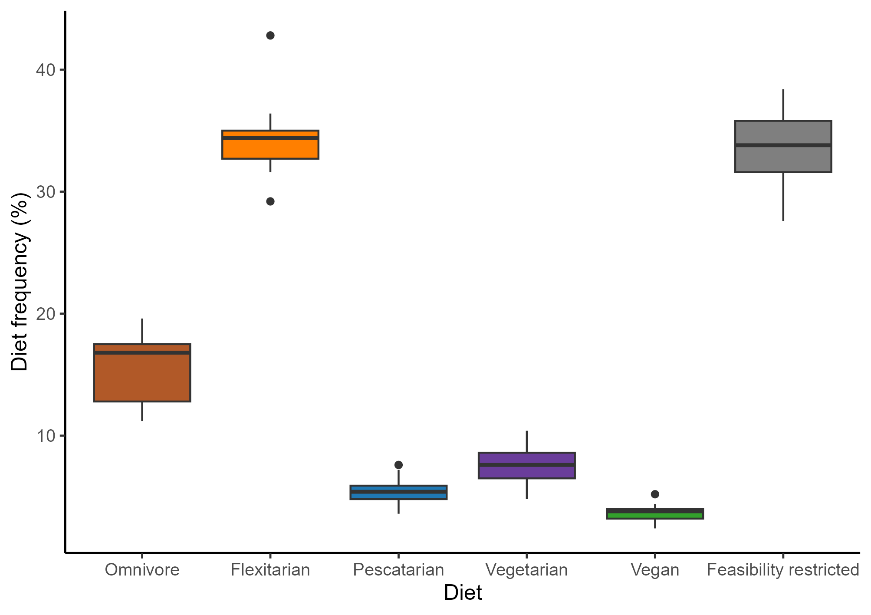
Consumers with low incomes or willingness to spend on food, large household sizes, or both, who perceived all diets as financially infeasible, defaulted to the least expensive diet (see Submodels), which was flexitarian (Appendix 1). These consumers had similar medians of motivations for all four diet attributes of cost, taste, ethics, and health (Figure 3). Their ethics perceptions of the diet they were assigned by default, however, were slightly lower than their taste and health perceptions, with a slightly higher interquartile range (IQR), indicating that some consumers could have perceived the diet to have similar levels of ethics and health, while others found it less ethical.
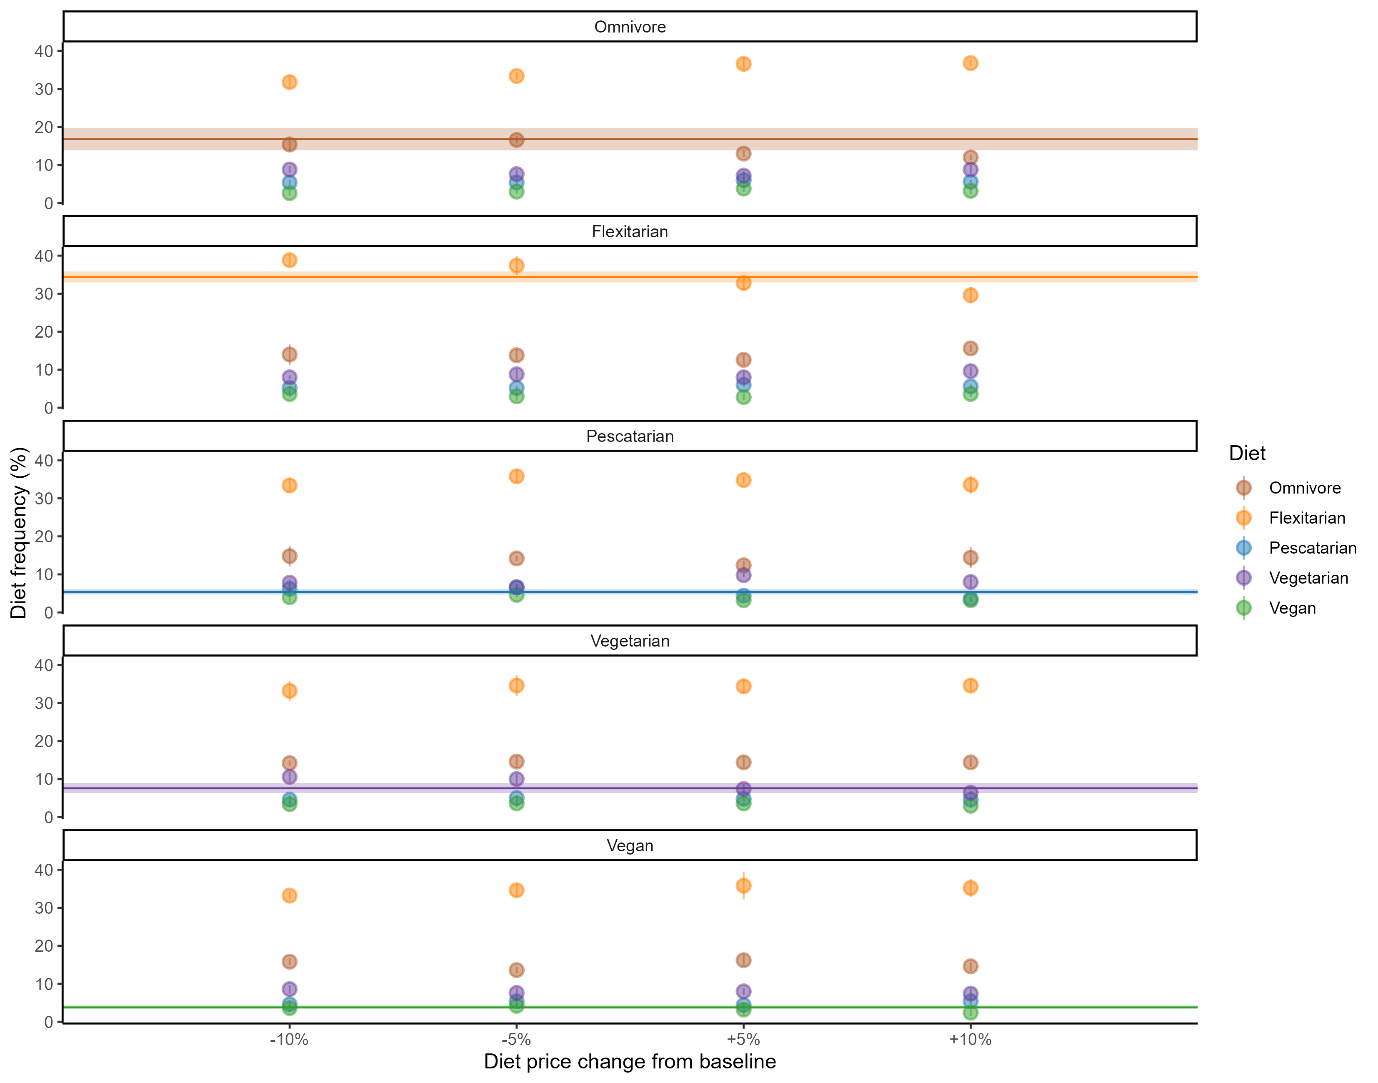
To test the sensitivity of the model to input data on the costs of the diets, runs were also performed where the price of a single diet was increased or decreased, while other diets’ prices remained constant (see Methods).
Diets were largely stable to changes in price, with flexitarian and vegetarian diets becoming slightly more popular when their prices were decreased (Figure 4). Omnivore, pescatarian, and vegan diets did not show changes in popularity with price change. As the baseline price of these diets was higher than others, decreasing the price by up to 10% was not enough to make them attractive to consumers based on cost alone, and not many consumers perceived their other attributes favorably enough to be willing to pay even the reduced cost.
The impact of social networks on dietary perceptions and choices
Across all levels of model complexity, flexitarian and omnivore diets were the most popular, followed by vegetarian, with very few vegans and pescatarians. There was a similar pattern to the utility function comparison (Figure 5) of increase in frequency of flexitarian diets over time, and slight decrease in frequency of all other diets (Appendix 3), in line with observations (Sijtsema et al. 2021).
As each submodel was added, a One Factor at a Time (OFAT) sensitivity analysis was also performed for model parameters relevant to that submodel (see Methods). No clear patterns were identified for different parameter levels, apart from linear increases in the frequency of each diet with linear increases in population size and the amount consumers were willing to spend on food (Appendix 2).
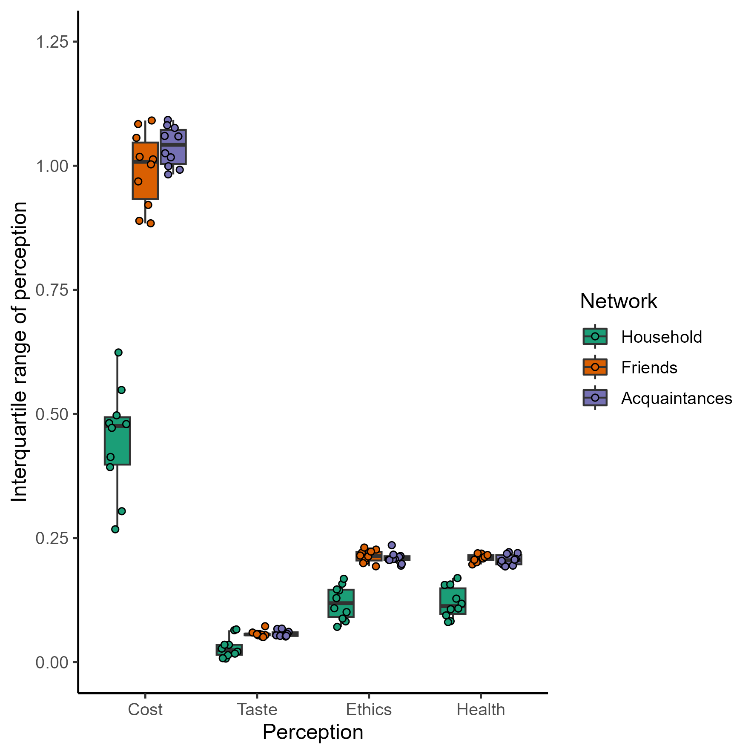
The homophily of perceptions for household members, friends, and acquaintances networks is shown in Figure 6. Household networks showed more similarity (lower interquartile range) for all perceptions, likely due to more frequent interaction among members of these networks. Ethics and health perceptions were also similar across networks. In contrast, the heterogeneity of cost perceptions was higher across all networks, possibly due to lack of social influence on this attribute, as well as the tendency for the difference in this perception to be much higher between diets that one could afford compared to those that they considered infeasible. Taste perceptions were quite similar across networks, despite lack of social influence on this perception, due to all consumers following the same process of habituating to a repeatedly chosen diet.
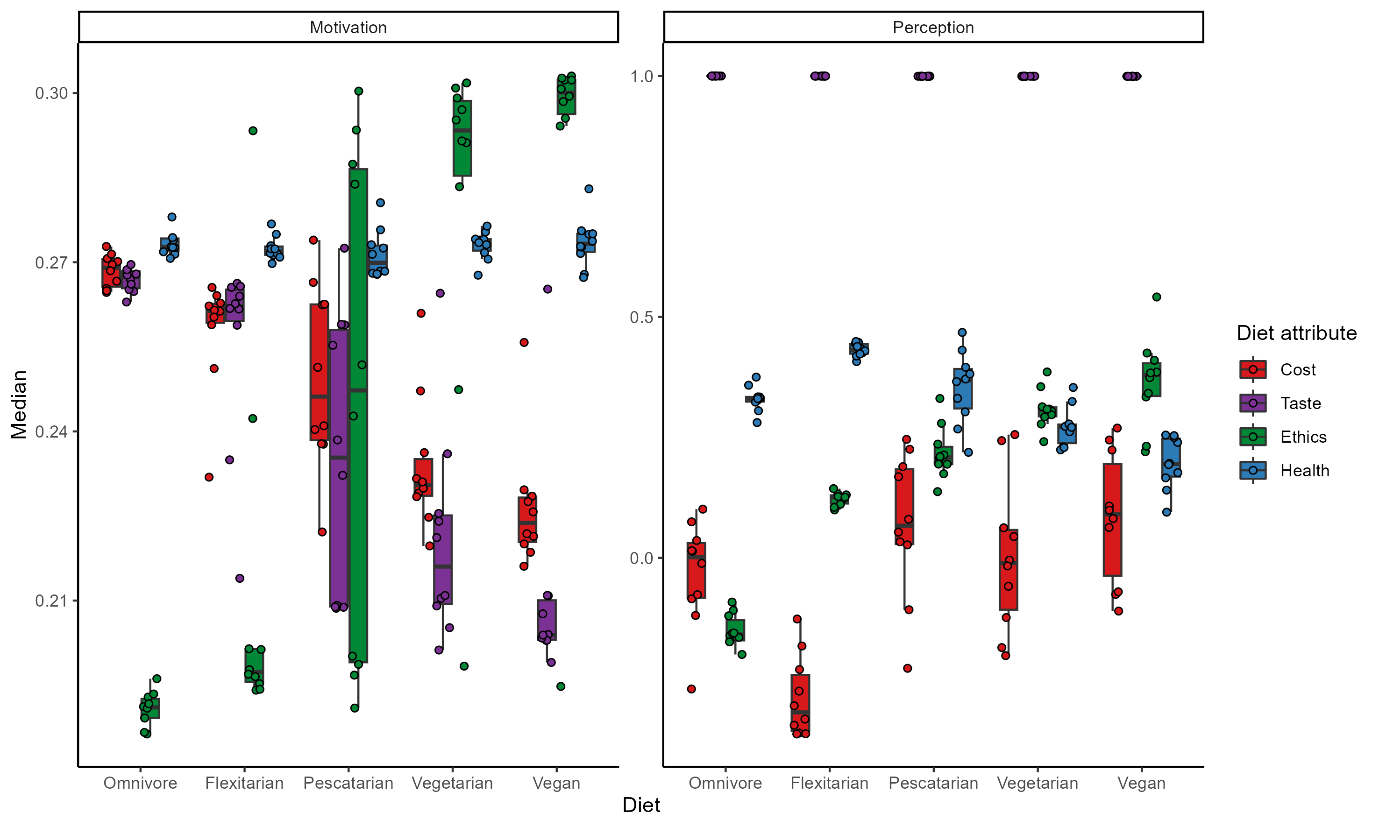
The perceptions and motivations across consumers sharing the same diet was also explored (Figure 7). Here, omnivores and flexitarians had higher cost and taste motivations, while vegetarians and vegans, and to a lesser extent, pescatarians, had higher ethics motivations and perceptions. Increasing model complexity through adding network structural change did not change the overall pattern of homophily among network members or consumers following the same diet (Appendix 3).
Discussion
Our study aims to understand how different individual factors and social influences contribute to dietary choice, particularly any potential misalignment between motivations and diet choice, and to capture key sensitivities to model structural assumptions and first-order parameter effects. In the following, main findings, model limitations, and implications for policy and future work will be discussed.
Dietary choice
The first analysis tested the frequency of diets across the population under different utility functions: one with consumers only considering cost and taste, one with consumers considering cost, taste, and health, and a third with consumers considering cost, taste, ethics, and health (Figure 2). The observed distribution of diets in the Dutch population (van Rossum et al. 2016) more closely resembles the distributions under the first two utility functions, with a high prevalence of omnivores and flexitarians, and far fewer pescatarians and plant-based consumers. The model here assumed that consumers who could not afford any of the diets, given their income, household size, and maximum willingness to spend on food, followed the least expensive diet by default, which was flexitarian (see Appendix 1 for steps in diet cost calculations). While increasing granularity of diet options and prices may create less expensive omnivore options that would allow more consumers to opt for this choice even when financially constrained, the high and increasing prevalence of flexitarians in the modeled population may be accurate for the Netherlands (Dagevos 2014; Verain et al. 2022), especially when a broad definition of flexitarian is assumed. The similarity in overall pattern across utility functions suggests that cost and taste are predominantly driving dietary frequencies. Furthermore, the decreased accuracy of the model when health, and even more so ethics, are included as motivations, is in line with previous work that suggests these are secondary considerations, which are seen as important but longer-term and therefore occurring on a higher level of conceptualization, while short- and medium-term food choices are driven by more immediate considerations of affordability and taste (Hoek et al. 2019).
The stability of the distribution of diets over time in the population demonstrates how diets quickly become habitual (van’t Riet et al. 2011), especially those with a high, positive taste perception due to familiarity. For consumers who repeatedly chose the same diet, their taste perception of that diet would increase, eventually outweighing the consideration of other perceptions such as health or ethics. In the current food system, many product innovations such as ‘plant-based meat’ are attempting to capture this familiar taste in more sustainable products, to facilitate consumers transitioning to more plant-based diets (Herrero et al. 2020).
Social influence
While social influence does affect perceptions of individual consumers in the model, these perception changes did not translate as clearly to population-level outcomes such as overall diet frequencies: simulations without social influence showed qualitatively similar results to those with social influence, including those with both social influence and network structural change. While the population size could have limited the effect of social influence, increasing population size in the OFAT analysis did not qualitatively change outcomes (Appendix 2), nor did any other parameter values explored in the sensitivity analysis. Instead, social influence was likely less influential at the population scale as it was modeled as only affecting health and ethics perceptions. Given the proportionally higher taste perception for consumers who had followed their current diet for longer, and the fixed cost perception, it would be unlikely that social influence would be enough by itself to cause a consumer to change to another diet, at least over the shorter timescales explored here. Previous work has mostly found an effect of social influence on immediate food choices, such as when eating a meal together (Cruwys et al. 2015). For personal choices such as long-term dietary pattern, social pressure and short-term normative influence in individual relationships may have less effect than longer-term influence, wider societal pressure, unidirectional group influence, and informational influence (Abrams & Hogg 1990; Spears 2021), such as the growing awareness and media coverage of climate change and dietary impacts on it.
Limitations
Three key limitations should be considered when assessing the results.
First, the current model is only intended for short-term explorations (e.g. three years, as done here), as it focuses on the immediate potential for dietary change, given the urgency of transitioning to sustainable food systems. All sociodemographic and economic variables are therefore assumed fixed, including the cost of each diet, household size and structure, and income. The utility function also does not include phenomena such as discounting to account for different weightings of aspects such as health or ethics in the future, or societal-level accumulation of more accurate information on health, environmental, and social impacts of diets. Social influence may also have stronger effects over longer timescales, especially when intergenerational value shifts and heterogeneous effects of inter- and intra-generational influence are considered. Finally, structural factors underlying price dynamics, such as demand feedbacks, would be more relevant to include as endogenous over longer timescales, and linked to changing social norms and networks as explored here. While we argue that the assumptions made are reasonable for the short-term explorations done here, future work with scenarios over longer timescales would require modifying these design aspects.
In addition to different effects over time, there may be heterogeneity in the magnitude and mechanism of social influence across subpopulations, particularly if different network structures are assumed, or if both social and non-social sources of information are included. While the current model focuses only on the role of personal factors and more generalized social processes in dietary decisions, future work is planned to explore the effects of additional types and sources of dietary information (e.g., Banyte et al. 2022), and heterogeneous social influences. As the model here represents perceptual errors through stochastic aspects, further work could also include the effects of perceptual errors and misinformation through social and non-social channels more explicitly, and introduction of greater uncertainty around perceptions of diets that a consumer has not yet tried.
Finally, the current model exploration only incorporated first order effects and interactions, through a One-Factor-at-a-Time (OFAT) sensitivity analysis. As the work presented here is intended as an initial exploration and understanding of model dynamics, and the model’s robustness to parameter changes suggests that any higher-order interactions are likely also limited, this could be explored through a more global sensitivity analysis in further work.
Implications for modeling and understanding diet-related values
In the model presented here, consumers’ motivations represent personal values attached to food attributes, such as perceived cost and ethical properties. These motivations were fixed, to represent the largely stable aspect of individuals’ values over time (Schwartz 1994), especially at the relatively shorter timescales explored here. However, their behavior could still change, and the routes by which this change could occur suggest key areas for policy interventions to facilitate transitions to sustainable and healthy diets. Often, a lack of behavioral change is discussed as being driven by an ‘attitude-behavior gap’ (Hoek et al. 2019), which refers to the dissonance between positive attitudes about protecting the environment or living a healthy lifestyle and actual consumption patterns. This is usually attributed to the effect of conflicting values (e.g., hedonistic-taste – versus altruistic-environmental protection), or habit, the latter of which is captured in the model presented here through the satisficing behavior of consumers. However, this model also highlights three potential cognitive, contextual, and motivational causes for this gap in any given consumer.
First, perceptions of diet impacts and attributes (such as environmental impact or healthiness) can be inaccurate. This can cause a consumer to behave in a way that they perceive as consistent with their values, but not consistent when viewed from the outside. For example, consumers in the model who chose omnivore or flexitarian diets typically had lower ethical motivations than consumers who chose vegetarian or vegan diets (Figure 7), with pescatarians showing a wider range of ethics motivations. These consumers typically still perceived their diets as approximately neutral (omnivore) or positive (flexitarian, pescatarian). This is consistent with that of the general Dutch population, where there is a limited understanding of the environmental impact of meat (Geurts et al. 2017). While flexitarian and pescatarian diets can be made healthier and more sustainable by limiting animal protein (Sijtsema et al. 2021), it is still inaccurate to perceive them as similar in sustainability to more plant-based diets (Springmann et al. 2016; Willett et al. 2019).
On a more contextual level, constraints such as cost can prevent consumers from making choices in line with their values. The consumers in the model who were financially limited to the least expensive diet typically perceived their diets as less ethical than healthy, despite having similar motivations for ethics and health, suggesting they may have chosen another diet that they considered more ethical (but equally healthy) if cost were not a concern. Moreover, when prices of flexitarian and vegetarian diets decreased, the popularity of these diets increased. While the increase was not large, this indicates that alleviating cost constraints does facilitate consumers choosing diets in line with their motivations. While other aspects of food environment and consumption, such as accessibility, and time and knowledge required for preparation, were not modeled here, these can also be considerable barriers to change. Policy aimed at making switching to a sustainable diet as feasible as possible across a range of aspects will thus increase the likelihood that individuals are able to make this change (Trudel 2019).
Finally, values can be brought into conflict with each other by perceptions or constraints: while the four motivations considered here are not intrinsically conflicting, how products are priced or perceived can mean that an option that is sustainable is not perceived as healthy, or is not considered affordable, as discussed above. For example, the consumers who chose vegan diets had lower perceptions of health for their diet, suggesting that they considered this to be a trade-off against how highly they perceived the diet’s ethics (Aschemann-Witzel 2015). Vegans and vegetarians also had lower taste motivations (Figure 7), which may have helped them choose a diet that they initially would not have considered as being as palatable as other options. In contrast, consumers who maintained their choice of a given diet developed a high perception of its tastiness and decreased in their perception of the tastiness of other diets, such that they would choose it repeatedly over another diet which may have otherwise been a better match for their ethical or health motivations. Therefore, the model illustrates how the attitude-behavior gap can arise from conflicts in the perceived attributes of the diets, such as ethics and health. This contrasts with how the attitude-behavior gap is typically portrayed as resulting from intrinsically conflicting motivations, but with relatively accurate perceptions underlying them.
Implications for transitioning to sustainable diets
To transition to healthy and sustainable diets, the model presented here demonstrated that there will need to be a considerable shift in perceptions, such as increased awareness of those around the negative environmental impacts of meat (Springmann et al. 2018a; Willett et al. 2019) and health benefits of plant-based diets (Biesbroek et al. 2018; Springmann et al. 2016). This shift will need to occur in a large enough part of the population to create higher, more consistent social influence, and will also need to be coupled with price changes to make sustainable and healthy diets broadly affordable and perceived as such, and unhealthy consumption patterns less so. While dynamics such as demand feedbacks entail that perception changes and price changes are somewhat linked, as discussed above, the price changes may need to be introduced first through policy changes to accelerate this transition. This could be accomplished through so-called ‘true pricing,’ whereby negative externalities are included in the price of products to represent environmental and social costs of their production and consumption (Hendriks et al. 2021), thus incentivizing uptake of sustainable production practices and supply chains. In the long run, such increased uptake likely also leads to a reduction in prices of healthy and sustainable food through learning and economies of scale and scope, thus ensuring that these diets are affordable for all consumers.
Combined with the three causes of attitude-behavior gaps outlined above, the necessary shifts in perceptions and pricing highlight a key role for policy in facilitating transition. First, there needs to be more widespread, impactful, and trusted information to better align perceptions with reality when it comes to healthy, sustainable diets, and potential negative impacts of not following these. Secondly, product innovations and pricing structures should be implemented to create tasty, affordable, accessible options that fall within healthy and sustainable dietary patterns, and new norms should be encouraged that highlight these, such as making them the default in food service. Future work with the model is planned to explore the impacts of non-social information and price signals, both individually and in combination, to better inform these policy suggestions. Together, the combination of information-based and pricing strategies could help overcome the misperceptions, constraints, and underlying causes of conflicting values, which have been demonstrated here to limit the consumption of more sustainable diets.
Conclusions
This work presents and analyzes a model of consumers choosing broad dietary patterns, based on a combination of personal constraints, motivations, and perceptions of each diet, with the latter also influenced by their social network. The model was developed to investigate the role of personal and social influences on dietary choices, and to elucidate reasons for and possible mechanisms to overcome the identified ‘attitude-behavioral gap’ for consumers with positive attitudes toward sustainability, and actual diets that do not reflect this. The analysis demonstrated that including only cost and taste motivations in evaluating diets best matched the observed dietary frequencies in the Netherlands, with cost also constraining which diets were even considered, and taste perception changes representing the habitual aspect of consumption choices. In contrast, social influence, which affected only health and ethics perceptions, was not as influential on diet choice, at least over the timescales explored here. Overall, the model highlighted three possible causes for an individual consumer’s attitude-behavioral gap: inaccurate perceptions, feasibility constraints, or perceptions which bring motivations into conflict. This illustrates the potential role of policy to overcome misperceptions and create pricing structures to close the attitude-behavioral gap and facilitate transitions to sustainable and healthy diets.
Acknowledgements
This work benefited greatly from comments and discussions with Anke Brons, Jonas House, and Anne van Veen regarding consumer behavior, empirical approaches, and practice theory, and with Els Weinans on conceptualizing and modeling values. ND acknowledges funding from the Dutch Research Council (NWO) as part of the project NWA: Transitie naar een Duurzaam Voedselsysteem. MK acknowledges funding from the European Union’s Horizon 2020 research and innovation programme under grant agreement No 101000640 (CITIES2030). GvV acknowledges funding from the 4TU DeSIRE programme.
The authors thank the teams responsible for the RIVM dietary survey and the Dutch Food Price database for sharing their data with us, and Sander Biesbroek for help in identifying data sources. The Dutch Food Price database was constructed by Mary Nicolaou, Coosje Dijkstra and Joreintje Mackenbach, who were funded to do so by the Health Behaviors and Chronic Diseases (HBCD) program of the Amsterdam Public Health research institute (MN, CD and JM) and the Netherlands Organisation for Scientific Research (JM).
Author Contribution
Conceptualization: ND, BJD; Methodology: ND, GvV; Software: ND; Formal analysis: ND; Writing - Original Draft: ND; Writing - Review & Editing: ND, MK, BJD, GvV; Visualization: ND; Supervision: MK, BJD, GvV; Project administration: BJD; Funding acquisition: BJD, MK, GvV.
Appendices
The file containing Appendix 1, 2 and 3 can be found here: https://www.jasss.org/27/1/4/Appendix.pdf.
Notes
- For household members and friends (see Table 6), this is a parameter↩︎
- These parameters were fixed at values that maintained a smooth rate of change in taste perception and link strength, respectively, between updates (i.e. the first update would be similar in magnitude to future updates).↩︎
- These parameters were fixed at values that maintained a smooth rate of change in taste perception and link strength, respectively, between updates (i.e. the first update would be similar in magnitude to future updates).↩︎
References
ABRAMS, D., & Hogg, M. A. (1990). Social identification, self-Categorization and social influence. European Review of Social Psychology, 1(1), 195–228. [doi:10.1080/14792779108401862]
ALDRIDGE, V., Dovey, T. M., & Halford, J. C. G. (2009). The role of familiarity in dietary development. Developmental Review, 29(1), 32–44. [doi:10.1016/j.dr.2008.11.001]
ALEKSANDROWICZ, L., Green, R., Joy, E. J. M., Smith, P., & Haines, A. (2016). The impacts of dietary change on greenhouse gas emissions, land use, water use, and health: A systematic review. PLoS One, 11(11), e0165797. [doi:10.1371/journal.pone.0165797]
ARENTZE, T., & Timmermans, H. (2008). Social networks, social interactions, and activity-Travel behavior: A framework for microsimulation. Environment and Planning B: Planning and Design, 35(6), 1012–1027. [doi:10.1068/b3319t]
ASCHEMANN-WITZEL, J. (2015). Consumer perception and trends about health and sustainability: Trade-offs and synergies of two pivotal issues. Current Opinion in Food Science, 3, 6–10. [doi:10.1016/j.cofs.2014.08.002]
BANYTE, A., Di Lauro, I. V., Mitova, A., Schauman, C., Simoniello, E., & Perez-Cueto, F. J. A. (2022). Why do men choose and adhere to a meatless diet? International Journal of Gastronomy and Food Science, 27(10044), 6. [doi:10.1016/j.ijgfs.2021.100446]
BECKMAN, R. J., Baggerly, K. A., & McKay, M. D. (1996). Creating synthetic baseline populations. Transportation Research Part A: Policy and Practice, 30(6), 415–429. [doi:10.1016/0965-8564(96)00004-3]
BIESBROEK, S., Monique Verschuren, W. M., van der Schouw, Y. T., Sluijs, I., Boer, J. M. A., & Temme, E. H. M. (2018). Identification of data-driven Dutch dietary patterns that benefit the environment and are healthy. Climatic Change, 147(3), 571–583. [doi:10.1007/s10584-018-2153-y]
BIRCH, L. L. (1999). Development of food preferences. Annual Review of Nutrition, 19, 41.
BLOK, D. J., De Vlas, S. J., Bakker, R., & Van Lenthe, F. J. (2015). Reducing income inequalities in food consumption: Explorations with an agent-based model. American Journal of Preventive Medicine, 49(4), 605–613. [doi:10.1016/j.amepre.2015.03.042]
BRONS, A., & Oosterveer, P. (2017). Making sense of sustainability: A practice theories approach to buying food. Sustainability, 9(3), 3. [doi:10.3390/su9030467]
CAPALDI, E. D. (1992). Conditioned food preferences. Psychology of Learning and Motivation, 28, 1–33. [doi:10.1016/s0079-7421(08)60486-7]
CAPALDI, E. D., & Van den Bos, G. R. (1991). Taste, food exposure, and eating behavior. Psychiatric Services, 42(8), 787–789. [doi:10.1176/ps.42.8.787]
CONTI, M., Passarella, A., & Pezzoni, F. (2011). A model for the generation of social network graphs. 2011 IEEE International Symposium on a World of Wireless Mobile and Multimedia Networks, 1–6. Available at: https://doi.org/10.1109/WoWMoM.2011.5986141 [doi:10.1109/wowmom.2011.5986141]
CREUTZIG, F., Roy, J., Lamb, W. F., Azevedo, I. M. L., Bruine De Bruin, W., Dalkmann, H., Edelenbosch, O. Y., Geels, F. W., Grubler, A., Hepburn, C., Hertwich, E. G., Khosla, R., Mattauch, L., Minx, J. C., Ramakrishnan, A., Rao, N. D., Steinberger, J. K., Tavoni, M., Ur̈ge-Vorsatz, D., & Weber, E. U. (2018). Towards demand-side solutions for mitigating climate change. Nature Climate Change, 8, 268–271. [doi:10.1038/s41558-018-0121-1]
CRUWYS, T., Bevelander, K. E., & Hermans, R. C. J. (2015). Social modeling of eating: A review of when and why social influence affects food intake and choice. Appetite, 86, 3–18. [doi:10.1016/j.appet.2014.08.035]
DAGEVOS, H. (2014). Flexibility in the frequency of meat consumption - Empirical evidence from the Netherlands. EuroChoices, 13(2), 40–45. [doi:10.1111/1746-692x.12062]
DE Boer, J., Hoogland, C. T., & Boersema, J. J. (2007). Towards more sustainable food choices: Value priorities and motivational orientations. Food Quality and Preference, 18(7), 985–996. [doi:10.1016/j.foodqual.2007.04.002]
EKER, S., Reese, G., & Obersteiner, M. (2019). Modelling the drivers of a widespread shift to sustainable diets. Nature Sustainability, 2(8), 8. [doi:10.1038/s41893-019-0331-1]
FALK, E., & Scholz, C. (2018). Persuasion, influence, and value: Perspectives from communication and social neuroscience. Annual Review of Psychology, 69(1), 329–356. [doi:10.1146/annurev-psych-122216-011821]
FAO. (2020). The state of food security and nutrition in the world 2020: Transforming food systems for affordable healthy diets (Vol. 2020). Available at: https://www.fao.org/documents/card/en?details=ca9692en
FEHR, B. (1996). Friendship Processes. Thousands Oaks, CA: Sage.
GEURTS, M., van Bakel, A., van Rossum, C., Boer, E. de, & Ocké, M. (2017). Food consumption in the netherlands and its determinants. Background report to ’What is on our plate? Safe, healthy and sustainable diets in the Netherlands’.
GIBSON, M., Portugal Pereira, J., Slade, R., & Rogelj, J. (2022). Agent-Based modelling of future dairy and plant-Based milk consumption for UK climate targets. Journal of Artificial Societies and Social Simulation, 25(2), 3. https://www.jasss.org/25/2/3.html [doi:10.18564/jasss.4801]
GIBSON, M., Slade, R., Pereira, J. P., & Rogelj, J. (2021). Comparing mechanisms of food choice in an agent-based model of milk consumption and substitution in the UK. Journal of Artificial Societies and Social Simulation, 24(3), 9. https://www.jasss.org/24/3/9.html [doi:10.18564/jasss.4637]
HANLEY, N., Wright, R. E., & Adamowicz, V. (1998). Using choice experiments to value the environment. Environmental and Resource Economics, 11(3), 413–428. [doi:10.1023/a:1008287310583]
HENDRIKS, S., de Groot Ruiz, A., Acosta, M., Baumers, H., Galgani, P., Mason-D’Croz, D., Godde, C., Waha, K., Kanidou, D., von Braun, J., Benitez, M., Blanke, J., Caron, P., Fanzo, J., Greb, F., Haddad, L., Herforth, A., Jordaan, D., Masters, W., Sadoff, C., Soussana, J. C., Tirado, M. C., Torero, M. & Watkins, M. (2021). The true cost and true price of food. United Nations Food Systems Summit. Available at: https://sc-fss2021.org/wp-content/uploads/2021/06/UNFSS_true_cost_of_food.pdf [doi:10.1007/978-3-031-15703-5_32]
HERRERO, M., Thornton, P. K., Mason-D’Croz, D., Palmer, J., Benton, T. G., Bodirsky, B. L., Bogard, J. R., Hall, A., Lee, B., Nyborg, K., Pradhan, P., Bonnett, G. D., Bryan, B. A., Campbell, B. M., Christensen, S., Clark, M., Cook, M. T., de Boer, I. J. M., Downs, C., Dizyee, K., Folberth, C., Godde, C. M., Gerber, J. S., Grundy, M., Havlik, P., Jarvis, A., King, R., Loboguerrero, A. M., Lopes, M. A., McIntyre, L., Naylor, R., Navarro, J., Obersteiner, M., Parodi, A., Peoples, M. B., Pikaar, I., Popp, A., Rockström, J., Robertson, M. J., Smith, P., Stehfest, E., Swain, S. M., Valin, H., van Wijk, M., van Zanten, H. H. E., Vermeulen, S., Vervoort, J. & West, P. C. (2020). Innovation can accelerate the transition towards a sustainable food system. Nature Food, 1, 266–272. [doi:10.1038/s43016-020-0074-1]
HIGGS, S. (2015). Social norms and their influence on eating behaviours. Appetite, 86, 38–44. [doi:10.1016/j.appet.2014.10.021]
HILL, R. A., & Dunbar, R. I. M. (2003). Social network size in humans. Human Nature, 14(1), 53–72. [doi:10.1007/s12110-003-1016-y]
HIMICS, M., Giannakis, E., Kushta, J., Hristov, J., Sahoo, A., & Perez-Dominguez, I. (2022). Co-benefits of a flexitarian diet for air quality and human health in Europe. Ecological Economics, 191(10723), 2. [doi:10.1016/j.ecolecon.2021.107232]
HOEK, A. C., Malekpour, S., Raven, R., Court, E., & Byrne, E. (2021). Towards environmentally sustainable food systems: Decision-making factors in sustainable food production and consumption. Sustainable Production and Consumption, 26, 610–626. [doi:10.1016/j.spc.2020.12.009]
HOEK, A. C., Pearson, D., James, S. W., Lawrence, M. A., & Friel, S. (2017). Shrinking the food-print: A qualitative study into consumer perceptions, experiences and attitudes towards healthy and environmentally friendly food behaviours. Appetite, 108, 117–131. [doi:10.1016/j.appet.2016.09.030]
HOEK, A., O’Kane, G., & Worsley, T. (2019). Food Consumption: Food, People, and Contexts. London: Routledge.
HOGG, M. A., & Reid, S. A. (2006). Social identity, self-Categorization, and the communication of group norms. Communication Theory, 16(1), 7–30. [doi:10.1111/j.1468-2885.2006.00003.x]
HUISHOUDELIJKE uitgaven. (2022). Nibud. Available at: https://www.nibud.nl/onderwerpen/uitgaven/huishoudelijke-uitgaven/
JAGER, W., Janssen, M. A., De Vries, H. J. M., De Greef, J., & Vlek, C. A. J. (2000). Behaviour in commons dilemmas: Homo economicus and homo psychologicus in an ecological-economic model. Ecological Economics, 35(3), 357–379. [doi:10.1016/s0921-8009(00)00220-2]
LEE, B. Y., Ferguson, M. C., Hertenstein, D. L., Adam, A., Zenkov, E., Wang, P. I., Wong, M. S., Gittelsohn, J., Mui, Y., & Brown, S. T. (2018). Simulating the impact of sugar-Sweetened beverage warning labels in three cities. American Journal of Preventive Medicine, 54(2), 197–204. [doi:10.1016/j.amepre.2017.11.003]
LI, Y., Du, T., & Peng, J. (2018). Understanding out-of-home food environment, family restaurant choices, and childhood obesity with an agent-based Huff model. Sustainability, 10, 5. [doi:10.3390/su10051575]
LORSCHEID, I., Heine, B. O., & Meyer, M. (2012). Opening the “black box” of simulations: Increased transparency and effective communication through the systematic design of experiments. Computational and Mathematical Organization Theory, 18(1), 22–62. [doi:10.1007/s10588-011-9097-3]
MCPHERSON, M., Smith-Lovin, L., & Cook, J. (2001). Birds of a feather: Homophily in social networks. Annual Review of Sociology, 27, 415–444. [doi:10.1146/annurev.soc.27.1.415]
MICHIE, S., van Stralen, M. M., & West, R. (2011). The behaviour change wheel: A new method for characterising and designing behaviour change interventions. Implementation Science, 6(1), 42. [doi:10.1186/1748-5908-6-42]
MÜLLER, B., Bohn, F., Dreßler, G., Groeneveld, J., Klassert, C., Martin, R., Schlüter, M., Schulze, J., Weise, H., & Schwarz, N. (2013). Describing human decisions in agent-based models - ODD + D, an extension of the ODD protocol. Environmental Modelling & Software, 48, 37–48.
NEZLEK, J. B., & Forestell, C. A. (2020). Vegetarianism as a social identity. Current Opinion in Food Science, 33, 45–51. [doi:10.1016/j.cofs.2019.12.005]
OLSTAD, D. L., & Kirkpatrick, S. I. (2021). Planting seeds of change: Reconceptualizing what people eat as eating practices and patterns. International Journal of Behavioral Nutrition and Physical Activity, 18(1), 32. [doi:10.1186/s12966-021-01102-1]
PLINER, P., Pelchat, M., & Grabski, M. (1993). Reduction of neophobia in humans by exposure to novel foods. Appetite, 20(2), 111–123. [doi:10.1006/appe.1993.1013]
PRINSEN, S., de Ridder, D. T. D., & de Vet, E. (2013). Eating by example. Effects of environmental cues on dietary decisions. Appetite, 70, 1–5. [doi:10.1016/j.appet.2013.05.023]
ROSE, S., & Serafica, F. C. (1986). Keeping and ending casual, close and best friendships. Journal of Social and Personal Relationships, 3(3), 275–288. [doi:10.1177/0265407586033002]
ROSENFELD, D. L. (2018). The psychology of vegetarianism: Recent advances and future directions. Appetite, 131, 125–138. [doi:10.1016/j.appet.2018.09.011]
RTL Nieuws. (2021). Vlees geen dagelijkse kost voor 8 op de 10 Nederlanders. Available at: https://www.cbs.nl/nl-nl/nieuws/2021/23/vlees-geen-dagelijkse-kost-voor-8-op-de-10-nederlanders
SAVAGE, J. S., Fisher, J. O., & Birch, L. L. (2007). Parental influence on eating behavior: Conception to adolescence. Journal of Law, Medicine & Ethics, 35(1), 22–34. [doi:10.1111/j.1748-720x.2007.00111.x]
SCALCO, A., Macdiarmid, J. I., Craig, T., Whybrow, S., & Horgan, G. W. (2019). An agent-based model to simulate meat consumption behaviour of consumers in Britain. Journal of Artificial Societies and Social Simulation, 22(4), 8. http://jasss.soc.surrey.ac.uk/22/4/8.html [doi:10.18564/jasss.4134]
SCHWARTZ, S. H. (1994). Are there universal aspects in the structure and contents of human values? Journal of Social Issues, 50(4), 19–45. [doi:10.1111/j.1540-4560.1994.tb01196.x]
SIJTSEMA, S. J., Dagevos, H., Nassar, G., van Haaster de Winter, M., & Snoek, H. M. (2021). Capabilities and opportunities of flexitarians to become food innovators for a healthy planet: Two explorative studies. Sustainability, 13(20), 20. [doi:10.3390/su132011135]
SPEARS, R. (2021). Social influence and group identity. Annual Review of Psychology, 72(1), 367–390. [doi:10.1146/annurev-psych-070620-111818]
SPRINGMANN, M., Clark, M. A., Rayner, M., Scarborough, P., & Webb, P. (2021). The global and regional costs of healthy and sustainable dietary patterns: A modelling study. The Lancet Planetary Health, 5(11), 797–807. [doi:10.1016/s2542-5196(21)00251-5]
SPRINGMANN, M., Clark, M., Mason-D’Croz, D., Wiebe, K., Bodirsky, B. L., Lassaletta, L., de Vries, W., Vermeulen, S. J., Herrero, M., Carlson, K. M., Jonell, M., Troell, M., DeClerck, F., Gordon, L. J., Zurayk, R., Scarborough, P., Rayner, M., Loken, B., Fanzo, J., Godfray, H. C. J., Tilman, D., Rockström, J. & Willett, W. (2018a). Options for keeping the food system within environmental limits. Nature, 562, 519–525. [doi:10.1038/s41586-018-0594-0]
SPRINGMANN, M., Godfray, H. C. J., Rayner, M., & Scarborough, P. (2016). Analysis and valuation of the health and climate change cobenefits of dietary change. Proceedings of the National Academy of Sciences, 113(15), 4146–4151. [doi:10.1073/pnas.1523119113]
SPRINGMANN, M., Wiebe, K., Mason-D’Croz, D., Sulser, T. B., Rayner, M., & Scarborough, P. (2018b). Health and nutritional aspects of sustainable diet strategies and their association with environmental impacts: A global modelling analysis with country-level detail. The Lancet Planetary Health, 2(10), 451–461. [doi:10.1016/s2542-5196(18)30206-7]
STATISTICS Netherlands. (2022). Food prices up by over 11 percent. Available at: https://www.cbs.nl/en-gb/news/2022/28/food-prices-up-by-over-11-percent
TAGHIKHAH, F., Voinov, A., Shukla, N., & Filatova, T. (2020). Exploring consumer behavior and policy options in organic food adoption: Insights from the Australian wine sector. Environmental Science & Policy, 109, 116–124. [doi:10.1016/j.envsci.2020.04.001]
TEN Broeke, G., van Voorn, G., & LigTENberg, A. (2016). Which sensitivity analysis method should I use for my agent-Based model? Journal of Artificial Societies and Social Simulation, 19(1), 5. http://jasss.soc.surrey.ac.uk/19/1/5.html [doi:10.18564/jasss.2857]
TERRY, D. J., Hogg, M. A., & White, K. M. (1999). The theory of planned behaviour: Self-identity, social identity and group norms. British Journal of Social Psychology, 38(3), 225–244. [doi:10.1348/014466699164149]
TRUDEL, R. (2019). Sustainable consumer behavior. Consumer Psychology Review, 2(1), 85–96. [doi:10.1002/arcp.1045]
TURNER, J. C. (1991). Social Influence. New York, NY: Thomson Brooks Cole.
VAN der Pol, M., Currie, G., Kromm, S., & Ryan, M. (2014). Specification of the utility function in discrete choice experiments. Value in Health, 17(2), 297–301. [doi:10.1016/j.jval.2013.11.009]
VAN Rossum, C., Buurma-Rethans, E., Vennemann, F., Beukers, M., Brants, H. A., de Boer, E., & Ocké, M. C. (2016). The diet of the Dutch: Results of the first two years of the Dutch National Food Consumption Survey 2012-2016. RIVM Letter Report 2016-0082 [doi:10.1017/s0029665120003067]
VAN’T Riet, J., Sijtsema, S. J., Dagevos, H., & de Bruijn, G. J. (2011). The importance of habits in eating behaviour. An overview and recommendations for future research. Appetite, 57(3), 585–596. [doi:10.1016/j.appet.2011.07.010]
VERAIN, M. C. D., Dagevos, H., & Jaspers, P. (2022). Flexitarianism in the Netherlands in the 2010 decade: Shifts, consumer segments and motives. Food Quality and Preference, 96(10444), 5. [doi:10.1016/j.foodqual.2021.104445]
WARDE, A. (2016). The Practice of Eating. Hoboken, NJ: John Wiley & Sons.
WATTS, D. J., & Strogatz, S. H. (1998). Collective dynamics of small-world networks. Nature, 393(6684), 440–442. [doi:10.1038/30918]
WIDENER, M. J., Metcalf, S. S., & Bar-Yam, Y. (2013). Agent-based modeling of policies to improve urban food access for low-income populations. Applied Geography, 40, 1–10. [doi:10.1016/j.apgeog.2013.01.003]
WILLETT, W., Rockström, J., Loken, B., Springmann, M., Lang, T., Vermeulen, S., Garnett, T., Tilman, D., DeClerck, F., Wood, A., Jonell, M., Clark, M., Gordon, L. J., Fanzo, J., Hawkes, C., Zurayk, R., Rivera, J. A., De Vries, W., Sibanda, M., Afshin, A., Chaudhary, A., Herrero, M., Agustina, R., Branca, F., Lartey, A., Fan, S., Crona, B., Fox, E., Bignet, V., Troell, M., Lindahl, T., Singh, S., Cornell, S. E., Reddy, K. S., Narain, S., Nishtar, S. & Murray, C. J. L. (2019). Food in the Anthropocene: The EAT - Lancet Commission on healthy diets from sustainable food systems. The Lancet, 393(10170), 447–492. [doi:10.1016/s0140-6736(18)31788-4]
ZHANG, D., Giabbanelli, P. J., Arah, O. A., & Zimmerman, F. J. (2014). Impact of different policies on unhealthy dietary behaviors in an urban adult population: An agent-based simulation model. American Journal of Public Health, 104(7), 1217–1222. [doi:10.2105/ajph.2014.301934]
ZHANG, H., & Vorobeychik, Y. (2019). Empirically grounded agent-based models of innovation diffusion: A critical review. Artificial Intelligence Review, 52(1), 707–741. [doi:10.1007/s10462-017-9577-z]