© Copyright JASSS

  JASSS logo ----

Derek Gatherer (2002)

Identifying cases of social contagion using memetic isolation: comparison of the dynamics of a multisociety simulation with an ethnographic data set

Journal of Artificial Societies and Social Simulation vol. 5, no. 4
<https://www.jasss.org/5/4/5.html>

To cite articles published in the Journal of Artificial Societies and Social Simulation, please reference the above information and include paragraph numbers if necessary

Received: 21-Aug-2002      Accepted: 26-Oct-2002      Published: 31-Oct-2002


* Abstract

A simulation is presented of a grid of connected societies of reproducing agents. These agents are capable of horizontal and vertical transmission of non-genetic cultural traits (memes). This simulation exhibits the theoretically predicted effect that horizontally transmitted memes are less likely, overall, to be encountered in geographical isolation than strictly vertically transmitted ones. Furthermore, when horizontal memes are under cultural selection, and thus behave 'contagiously', their likelihood of geographical isolation is virtually eliminated. By contrast, natural selection has far weaker effects than cultural selection in reducing geographical isolation. Thus it should be possible to identify contagious memes by an examination of their geographical distribution. The degree of geographical isolation of 17 categories of postulated cultural traits in an ethnographic data set of 863 societies is then examined, and compared with the simulations, using z-tests. Using this method, the empirical data can be sorted into four broad categories, each with a different spectrum of probabilities of mode of transmission and contagion.

Keywords:
Allomeme; Axelrod's Cultural Model; Contagion; Cultural Evolution; Cultural Selection; Cultural Trait; Evolutionary Epidemiology Of Culture; Meme; Murdockís Ethnographic Atlas; SIM.; Social Interaction Model

* Introduction

1.1
On a trivial level, cultural isolates may be defined as human cultures surrounded by rather different human cultures. Geographical separation of cultures by physical obstacles such as mountain ranges, rivers or seas can be a major factor allowing a previously homogeneous culture, perhaps of common ancestry, to drift apart into two genetically and culturally distinct groups (e.g. Gonzalez Jose et al. 2002). Alternatively, geographical obstacles may serve to prevent the integration of two cultures that are of different origin but located in close proximity, that might otherwise be expected to gradually homogenize (e.g. De Silvestri and Guglielmino 2000). Once achieved, cultural isolation may reinforce genetic isolation, if cultural differences can impose barriers to gene flow as effective as those of geographical obstacles (Sokal et al. 1989; Barbujani and Sokal 1990). For instance, in Bali, an Hindu culture exists in the midst of the Islamic culture that spread to the rest of the Indonesian archipelago in the Middle Ages. However, genetically, both the Balinese population and the surrounding Javanese and other Indonesian populations are descended from a common Austronesian ancestor originating possibly in Taiwan in Neolithic times (Gray and Jordan 2000). Although many aspects of Balinese and Javanese cultures are now different, the populations are still linguistically similar. By contrast, Vona et al. (1996) have shown how a southern Sardinian immigrant population is both culturally and genetically isolated from surrounding populations. These examples serve to illustrate how different aspects of culture may evolve in ways that are essentially independent.

1.2
This paper examines memetic isolation, that is the situation in which any cultural trait of a society is different to the corresponding mutually exclusive cultural trait, the 'allomeme' (Durham 1991), of any of its surrounding cultures. For each cultural trait under consideration, one may partition the totality of the world's cultures into those that are memetic isolates for that trait, and those that are not. Thus, a culture that is not sufficiently isolated to be considered a true cultural isolate, may nevertheless exhibit memetic isolation for several cultural traits.

1.3
The subject of memetic isolates is of relevance to the study of social contagion. Cavalli-Sforza and Feldman (1981) define 'horizontal transmission' as the process of cultural exchange between non-familial individuals. This contrasts with 'vertical transmission' and 'oblique transmission', which are forms of memetic interaction between related individuals. Horizontal transmission permits the sharing of culture between different societies, whereas exclusively vertical and/or oblique transmission will confine cultural traits within groups of related individuals in the same society, unless individuals migrate out of their society and become members of another. A strictly vertically transmitted trait will behave in a manner essentially identical to that of a gene in a haploid organism (i.e. an organism with only a single allele at each genetic locus). When a horizontal trait has more than one allomeme, and one of the allomemes has more likelihood than the others of being transmitted, the trait is said to be under 'cultural selection'. Similarly when one allomeme confers a survival or reproductive advantage on the individual exhibiting that behaviour, the trait is said to be under 'natural selection' (Cavalli-Sforza and Feldman 1981). Cultural selection, even when slight, results in the spread of a meme to fixation in the population, provided the cultural selection pressure is maintained for a sufficient time. The meme is then said to be 'contagious' (Rashevsky 1949). Gatherer (2002) provides diagrams of the dynamics of meme incidence in a single population under conditions of no selection (a 'random walk': Gatherer 2002: Fig. 2) and conditions of cultural selection (a sigmoid curve, the 'contagionist paradigm': Gatherer 2002: Fig. 1).

1.4
Classic mathematical memetic theory demonstrates that traits with more than one means of transmission have a greater tendency to homogeneity within populations, and also that horizontally transmitted traits are more likely to be spatially clustered (Cavalli-Sforza and Feldman 1973, Uyenoyama et al. 1979, reviewed by Cavalli-Sforza 1979). This theory provides the basis of part of Guglielmino et al. 's (1995) analysis of Sub-Saharan African culture. These authors examined the distribution of 47 groups of cultural traits in 277 sub-Saharan African populations, deriving correlations for their co-distribution with climate and language and also measuring their tendency to memetic isolation. In order to quantify isolation they derived a statistic, r = d/dS, where dS is the distance to the nearest neighbouring society sharing the same class of a trait, and d is the distance to the nearest neighbour of any kind. Three a priori models of cultural distribution were devised, based on:
  1. environmental determinism
  2. descent from common ancestor
  3. social contagion

1.5
Descent from a common ancestor was tested by correlation of cultural trait with linguistic group, as populations with the same language tend to be genetically related. They were thus able to classify cultural traits into groups consistent with each of the three models. Whereas those authors scanned sub-Saharan African empirical data distributions for correlations and then made deductions concerning their three hypotheses, the present work compares the results of agent-based simulations with global cultural trait distribution data. As in Guglielmino et al. (1995), data are extracted from Murdock's Ethnographic Atlas (Murdock 1967).

1.6
The simulation presented in this paper analyses a memetic process within and between societies, defining its dynamics with a set of three simple parameters:
  1. the rate at which teaching/learning occurs
  2. the rate at which that teaching/learning occurs between societies
  3. the rate at which individuals migrate to neighbouring societies

1.7
Two questions are asked:
  1. What is the mean tendency to memetic isolation for traits, under different modes of transmission and selection, in the simulation?
  2. What is the global tendency to memetic isolation for a wide range of traits in the real world?

1.8
From the answers to these questions, inferences are made concerning the modes of transmission and selection for the traits in the real world. Since the simulation demonstrates the range of tendencies to isolation achievable over a range of parameters for transmission within and between societies, as well as migration, the observed memetic isolation in a large dataset may be used to predict the relative contributions of horizontal and familial acquisition for those traits, and the possible selective conditions. The assumption is made that cultural change does occur by the process of teaching, learning or other imitational factors between individuals. The underlying philosophy of the work is therefore a diffusionist, rather than a structuralist one.

1.9
Before proceeding, a word should also be said concerning the use of the word 'drift', which is here used to describe a random walk in a trait's frequency within a population (in the spirit of Kimura 1979). This is a little different to some uses of the term 'cultural drift' within the anthropology literature, where it can often have more connotations of directional, and possibly wholesale, change in the traits within a culture.

* The Simulation

2.1
A grid of cells is used to simulate a network of connected societies. Each society is composed of agents, with genetic and memetic attributes, capable of migration, reproduction, and of behavioural imitation of memetic attributes from other individuals (here abbreviated to "teaching/learning" in the loosest possible sense of those words). Agents can learn from other agents in their own society, or from agents in neighbouring societies. Various parameters specifying reproduction, teaching/learning and migration can be entered by the user.

Agent Behaviour

2.2
The agents are described in the jargon of object-oriented programming, in order to make their functionality clear to those who wish to adapt the scripts provided (see Appendix) or to reprogram the simulation from scratch.

Object Attributes

2.3
Agents have 3 attributes:
  • Gene
  • Meme
  • Location

2.4
Agents are defined as haploid, with the single Gene having four alleles (i.e. four mutually exclusive states). Haploidy means that there is a single copy of each gene in each individual. Human beings are, of course, diploid, with duplicate copies of each of their several thousand genes, so their genetics in the real world is rather more complicated. However, it should be stressed that this simulation is not intended to represent the genetics of humans, but rather to make use of the classic memetic theoretical result that strictly vertically transmitted memes behave like haploid genes (Cavalli-Sforza and Feldman 1973, reviewed by Cavalli-Sforza 1979). This means that here an individual's "haploid genotype" can be defined as one of four mutually exclusive possibilities: 1, 2, 3 or 4. Each individual reproduces clonally to give a genetically identical individual. Each agent exhibits a single Meme, which can also be defined as one of four mutually exclusive 'allomemes' (Durham 1991): A, B, C or D. The genetic and memetic systems are thus structurally equivalent, except that the memetic system can make use of horizontal transmission to various degrees, whereas the genetic system is restricted to vertical transmission. There are thus 16 possible 'pheno-genotype' (Feldman and Cavalli-Sforza 1984) combinations. It should be noted that, for a haploid system of this sort, the Gene attribute is equivalent to a strictly vertically transmitted cultural trait, as mentioned above. Therefore the attributes could equally well have been named verticalMeme and horizontalMeme, respectively. Each agent also has a Location attribute indicating its position on a ten-by-ten grid. Each square on the grid represents a single society. An unlimited number of individuals can occupy each square.

Object Methods

2.5
Agents have five methods:
  • Reproduce
  • Teach Member of Own Society
  • Teach Member of Neighbouring Society
  • Migrate
  • Die

2.6
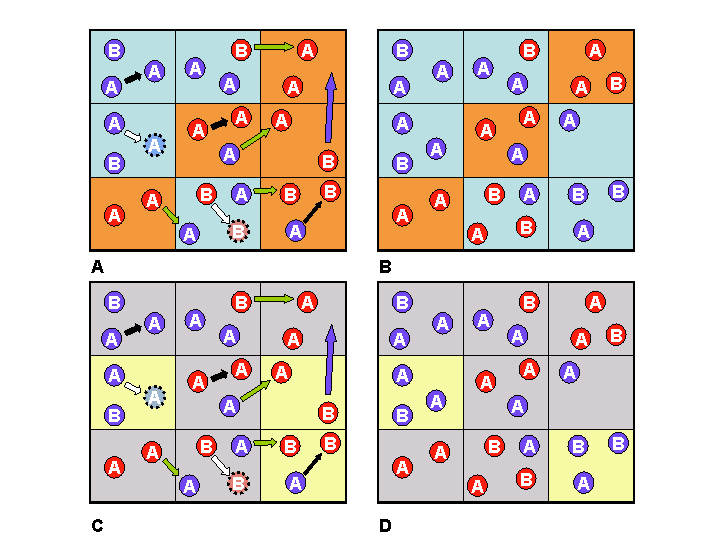
Reproduce and Die are invoked at each generation for each agent, which alone would of course maintain the population in a steady state. However, here a standard probability is used, r, allowing an agent to invoke Reproduce twice in a single generation. Thus the population grows slowly at a rate equal to 1+r per generation. Here r is set at 0.01, giving population growth of 1% per generation. Probabilities of the remaining three methods are user-specified. With probability, m, the agent may migrate. Migration allows the agent to move one square in any direction, limited by the edges of the grid, i.e. into any neighbouring society. The two Teach methods transfer the Meme attribute to another agent in the same square or to an agent in an adjacent square, as appropriate, with probabilities, o and n respectively. When an agent reproduces, it produces an identical copy of itself. Thus, if o and n are both set to zero, the Meme attribute behaves exactly as a Gene attribute, i.e. it is strictly vertically transmitted meme. However, where either o or n is non-zero, the Meme attribute is horizontal. The features of the model are summarized in Figures 1 and 2.

Figure 1
Figure 1. Diagram of how the model works. Two memes are represented as red and blue attributes for agents, and two haploid genes as A and B. In panels A and B, societies with a majority of "red" memes are coloured orange, and societies with a majority of "blue" memes are pale blue. In panels C and D, societies with a majority of gene A are coloured grey, and those with a majority of gene B are coloured yellow. The gene and meme states of societies are designated according to the voting system described in Figure 2. In panel A, "reproduction over simple self-replacement" (white arrows), "teaching members of own society" (black arrows), "teaching members of neighbouring societies" (green arrows), and "migration" (blue arrows) occur. In panels B and C, the results of the events in panels A and C can be seen: as well as several individuals having changed their memes, some cells can be seen to have changed their designation (by the voting system) from one colour to another. Since a strictly vertically transmitted meme behaves exactly like a haploid gene, the model can simulate strictly vertical transmission and contagion, simultaneously.

Figure 2
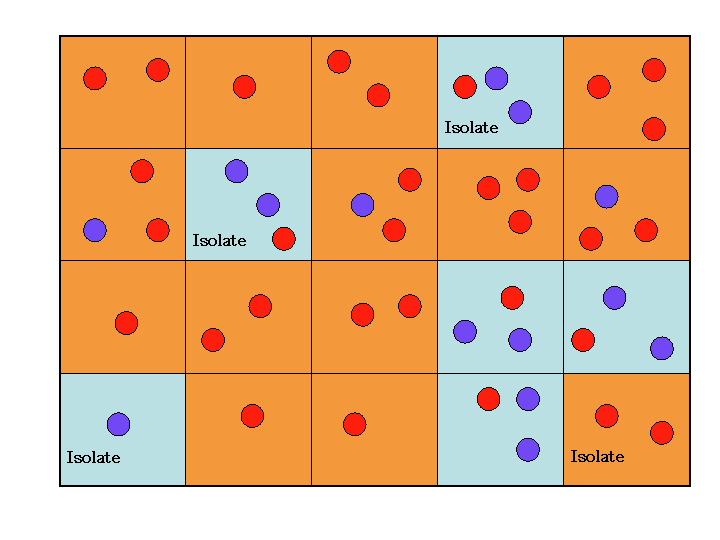
Figure 2. First-Past-the-Post-Voting. Societies are coloured according to the majority of the agents within them (where numbers are even societies conservatively retain their original designation). Societies with no neighbouring society of the same designation are deemed to be memetic isolates. The grid above contains three blue memetic isolates and one red one.

Initialization and Iteration

2.7
At the beginning of each simulation, the user need only provide the three probabilities, m, n, and o, as above. These are global probabilities, and apply to all agents in the simulation. Automatically, each square is initially filled with two individual agents, and each agent is randomly initialised for Gene and Meme attributes. There is thus no gene-meme 'linkage disequilibrium' (Feldman and Cavalli-Sforza 1984). The simulation is then allowed to run for 100 generations. The pseudo-code for the process is as follows:
 INITIALIZATION:
        For each of the 100 cells in the 10-by-10 array:
        {
                place two Agents in each cell
                randomly assign one of four Gene attributes to each individual
                randomly assign one of four Meme attributes to each individual
        }
ITERATION:
        For 100 generations do the following:
        {
                For each Agent:
                {
                        If Agent Meme attribute = "A" and CultSel = "Y"
                        {
                                Double parameters n and o for that agent
                        }
                        If Agent Meme attribute = "A" and NatSel = "Y"
                        {
                                Double parameter r for that agent
                        }
                        If a random number x < r
                        {
                                Reproduce Agent
                        }
                        If a different random number y < o
                        {
                                If same random number y is also < n
                                {
                                        Transmit Meme to any Agent in any adjacent cell
                                }
                                else
                                {
                                        Transmit Meme to any Agent in same cell
                                }
                        }
                        If a different random number z < m
                        {
                                Migrate Agent to adjacent cell
                        }
                }
        }
END.
Cultural and Natural Selection

2.8
The basic simulation has neither cultural nor natural selection. Following Cavalli-Sforza and Feldman (1981), a meme is considered to be naturally selected when agents with that attribute have a reproductive advantage over other agents (there is no survival advantage in this simulation, as all agents die at the end of each generation). Switching on of natural selection is achieved by having a global NatSel attribute. When this is toggled on, all agents with attribute Meme A have double the currently prevailing chance of reproducing twice per generation: r is doubled for those agents only, and remains constant for the rest of the population. Similarly Cavalli-Sforza and Feldman's (1981) definition of cultural selection is achieved by having a global CultSel attribute. When this is toggled on, it doubles both of the prevailing Teach probabilities: n and o are doubled for agents with Meme A only. Memes may simultaneously be naturally and culturally selected, in which case r, n and o are all doubled for agents with Meme A, and remain constant for the rest of the population. The process described here generalises the simulation system given in Gatherer (2002) from a single society to a grid of societies. Without either selection pressure, the memes will trace a random walk in frequency. With cultural selection, Meme A becomes contagious, and will exhibit the 'contagionist paradigm' of a sigmoid distribution in societies in which it enters.

Software Implementation

2.9
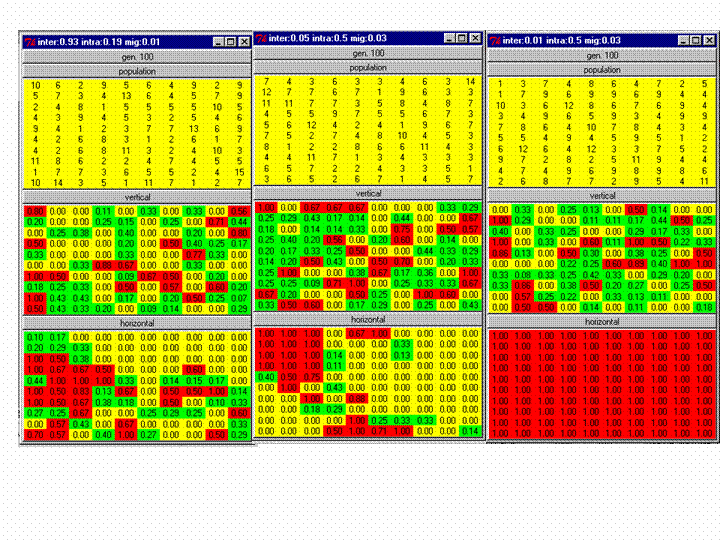
A Perl Tk script (Listing 1, see Appendix) runs the simulation. At each generation the simulator gives graphical output of the number of agents per square and the proportion of those agents that exhibit Gene 1 and Meme A respectively. Some screenshots are provided in Figure 3. Colour coding indicate societies that have a majority of agents of type Gene 1 or Meme A (red), societies with a minority of agents of type Gene 1 or Meme A (green), and societies without Gene 1 or Meme A (yellow). Cultural and genetic isolates can easily be seen as red squares with no adjacent red squares. These represent majority societies (whether genetic or memetic) existing in isolation from other majority societies. The 'first-past-the-post voting system' is used to decide on the cultural trait label for a society (Figure 2). Murdock's data is mostly qualitative and therefore comparison of the simulation with the empirical data requires a threshold at which a population frequency becomes a qualitative label. A voting system is fairly appropriate to the real world, as statements like "Italy is a Catholic country", or "The USA is an English-speaking nation" depend on just such counting of majorities.

Figure 3
Figure 3. Screenshots of three runs of Listing 1 after 100 generations. The upper panel shows the number of agents in each society/cell at the end of the 100 generations, the middle the frequency of Gene 1 and the lower the frequency of Meme A. Cells with a majority of Gene 1 or Meme A are coloured red. Those with a minority are green and those with none are coloured yellow. The figures for genetic isolation from left to right (second row) are, 2%, 1% and 5% respectively, and for cultural isolation (bottom row) are 3%, 1% and 0%. The right simulation had cultural selection operating on Meme A, resulting in its fixation.

Bulk simulation

2.10
As each individual run of the simulation is liable to stochastic variation, generalisation concerning the properties of the system requires averaging the results of hundreds of runs. A further script is provided below (Listing 2, see Appendix), that implements hundreds of single simulation runs of Listing 1 without graphical output. Output is provided as tab-delimited text that can be visualised in a spreadsheet. This second script initialises the three user-specified probabilities randomly, using a pseudo-random number generator. This is seeded by a "mix of difficult-to-predict, system-dependent values" (Siever et al 1998), thus ensuring that the regularities that are sometimes creep into list-based random number generators, is avoided. Each set of three probabilities is run twice, and the average number of genetic and cultural isolates for Gene attribute "1" and Meme attribute "A" is written to output for each pair of runs.

Comparison of Simulation Structure to the "Social Influence Model", and "Sugarscape"

2.11
Axelrod (1997) presents a similar model, the "Social Influence Model", (referred to henceforth as SIM) like the present model using a grid with limiting edges (i.e. the grid represents a square and is not a toroidal projection of a sphere). The size of the grid is also ten by ten (although this is later varied by Axelrod to test the effects of size). Again like the model presented here, the starting state is random assignment, and the occurrence of interactions is determined using probabilistic methods. However, the following important differences may be listed:
  1. SIM agents have a larger set of cultural traits, whereas the models in the present simulation have a single meme.
  2. SIM agents are the societies, not individuals within them. There are thus one hundred agents only in SIM's initial ten by ten grid, and that number remains constant throughout the simulation. Interaction between two societies therefore changes the cultural profile of the entire society being taught.
  3. SIM's grid uses diamond-shaped cells, so the internal societies have only four neighbours, not eight as is the case with the present simulation's square-shaped cells. Likewise, edge sites in SIM have only two neighbours (rather than five) and corner sites have a single neighbour (rather than three)
  4. SIM uses the degree of similarity between the cultural trait profiles of its whole society agents to determine the likelihood that they will interact. In the present model, interaction is random, providing individuals are in the same or adjacent societies.
  5. SIM allows interaction with non-adjacent societies, over certain fixed ranges (these are also varied in some SIM experiments). In most cases however, SIM permits only interaction with adjacent societies, like the present simulation.
  6. SIM randomly selects the agents for processing, whereas the present model runs through a list containing each agent. This is because each iteration in the present model is considered to be equivalent to one generation, and each individual is required to invoke the Reproduce and Die methods. SIM, by contrast, treating societies rather than individuals as agents, has no such requirement for simulating discrete time.
  7. SIM does not allow for natural or cultural selection.

2.12
In summary, SIM treats cultures as homogeneous, whereas the present model allows internal heterogeneity, with the requirement of a voting system when generalities about a culture need to be made. SIM has a more complex cultural content, and uses similarity in this content to bias the probability that two cultures will interact. The models are further discussed below (see Discussion).

2.13
A yet more complex model is "Sugarscape" (Axtell et al. 1996). This is an artificial world in which the agents may compete for resources, fight, suffer disease, migrate, trade etc. Axtell et al. (1996) produced a version of Sugarscape designed to reproduce as closely as possible the features of SIM. This is achieved by eliminating migration and reducing the range within which interactions are permitted, to the immediate neighbourhood of the agents (corresponding to SIM with lowest ranges of interaction and to the present simulation). Since the generality and plasticity of Sugarscape allow it to replicate the behaviour of SIM, it would be possible to implement the present simulation as a Sugarscape version.

* Average Effects and Correlations Observed in Multiple Simulations

Average Effects of Selective Pressure on Genetic and Memetic Isolation

3.1
Two hundred and fifty simulations were performed as described above in Section 2, using the following alternative selective conditions:
  • no selective mechanisms, or
  • cultural selection of Meme A, or
  • natural selection of Meme A, or
  • simultaneous cultural selection and natural selection of Meme A

3.2
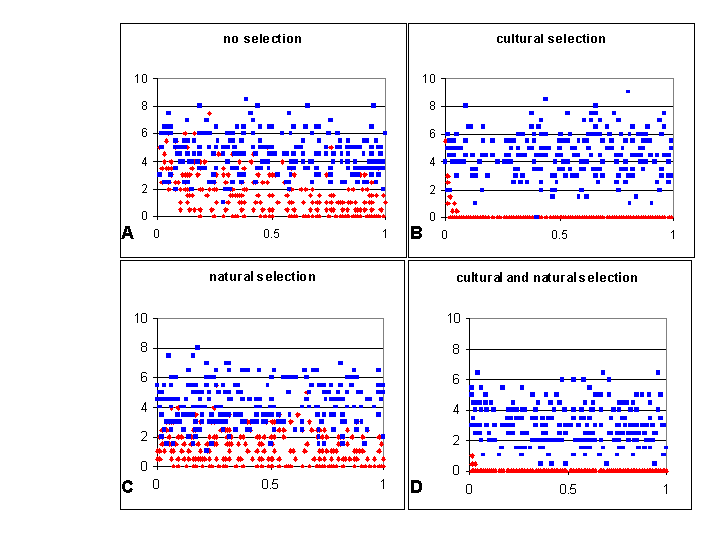
The number of genetic and memetic isolates, for Gene 1 and Meme A respectively, were recorded, and the averages calculated for each set of selective conditions (Table 1). Note that, because of the haploid nature of the system, 'genetic isolates' may equally well be taken to signify 'memetic isolates for strictly vertically transmitted memes'. Figure 4 plots the results graphically. For each data row of Table 1, all the differences between genetic and memetic isolation were tested using a t-test. All differences are highly statistically significant at levels of p tending to zero. Therefore, regardless of selective mechanisms, cultural isolation is, on average, very significantly rarer than genetic isolation under the same set of selective conditions. Again, as haploid genes behave like strictly vertical cultural traits, one may also say that memetic isolation for horizontal traits is always rarer than that for strictly vertical traits. This is in keeping with Feldman and Cavalli-Sforza's (1973) mathematical prediction.

3.3
The t-tests were also applied to the differences within columns of Table 1, starting with the column for memetic isolation. This shows that memetic isolation is also virtually eliminated by the presence of cultural selection (Table 1, comparing data rows 2 and 4 with rows 1 and 3, p tending to zero). This effect is illustrated graphically in Figure 4 (compare distribution of blue and red dots). Furthermore, natural selection of a meme also reduces memetic isolation (Table 1, data rows 3 and 4, compared to row 1, p<0.002).

3.4
For genetic isolation, the difference between rows 1 and 2 and row 3 is of borderline significance (p<0.03), indicating that natural selection of a meme even without synergistic cultural selection also reduces the tendency to genetic isolation, although not as much as when combined with cultural selection. it may be speculated that it is caused by the reproductive success of individuals exhibiting meme a (as meme a is under natural selection), which increases the success of their genes, thereby 'hitch-hiking' the gene on the meme. hitchhiking of one genetic trait on another is a well established phenomenon (e.g.. Wagener and Cavalli-Sforza 1975; Thomson 1977). Here we see rather the hitchhiking of a gene on a meme. The genetic effects of memetic selection have previously been modelled by Laland (1994) and Kumm et al. (1994).


Table 1: Mean percentage genetic and memetic isolation observed for 250 randomly initialised simulations (each simulation performed twice and results averaged), against the rate of teaching within societies, under the four conditions of no selective forces, natural selection alone, cultural selection alone or both. The individual values contributing to this summary are plotted graphically in Figure4.

Cultural SelectionNatural Selection% genetic isolation% memetic isolation
NoNo4.531.61
YesNo4.540.07
No Yes4.241.22
YesYes3.060.01

Figure 4
Figure 4. Percentage memetic isolation (red dots) and genetic isolation (blue dots) for 250 duplicated simulations, under each of the four selective conditions, plotted for convenience against the rate of teaching within societies (variable o in the model). Each data point is the average of two duplicate runs under the same randomly initialised m, n and o. Rate of overall reproduction (r in the model) was held at 0.01. This data is summarised in Table 1.

3.5
Figure 4 contains the plots the raw data that is summarised in Table 1. For convenience, the x-axis used is variable o, but any other variable could have been used. The effect of cultural and natural selection in combination on the probability of memetic isolation (Figure 4, panel D) is striking, and the effect of cultural selection alone (Figure 4, panel B) is nearly as strong.

3.6
These values for average tendency to genetic and memetic isolation may be put into perspective by considering the likely background level of isolation given a random distribution, which is in fact the starting state of the simulation. Since the populations are arranged on a grid, each square (excepting the edges and corners) has 8 neighbours, a total of 64 squares. The 4 corner squares have 3 neighbours, and the non-corner edges have 5 neighbours (32 squares). With 4 allomemes and 4 alleles, the background probability of genetic or memetic isolation is:
[(64*0.758) + (32*0.755) + (4*0.753)] /100 = 0.157
or just over 15% isolation in total for any set of 4 allomemes. Since the simulations here only examine isolation of 1 of 4 allomemes, the background level is just under 4%. Thus vertical inheritance gives a level of isolation only marginally above background, except where cultural and natural selection are working together on horizontally transmitted traits within the same population. By contrast, horizontal transmission drives memetic isolation below background regardless of the selective conditions, and virtually eliminates it when the meme is contagious by virtue of cultural selection.

Comparison of Results with Those of the Social Interaction Model

3.7
The most obvious contrast between the results above and those generated using SIM (Axelrod 1997), is that SIM does not achieve any cultural isolates. By contrast, SIM tends to equilibrium states of geographical 'blocs' of culture. The reason for this is principally that SIM uses cultural distance, measured as degree of similarity in the content of the cultural trait profile, as a probabilistic contribution to interaction. Thus, in SIM, interactions tend to occur between agents that already share similarity, and to be highly probable in agents that are highly similar. This produces a homogenization effect. The present simulation has no such bias. Although the degree of interaction is a variable parameter, the targets of the Teach methods are selected at random from the neighbouring and the same societies.

3.8
Although it would be possible to move the present simulation closer to SIM, by redesigning the grid from square blocks to diamond-shaped blocks, and by eliminating migration, there would be no way to recreate the biased interactional properties of SIM without introducing a further Meme attribute to the agents.

Average Correlations of Isolation with Parameters of the Model

3.9
In the above set of 1000 simulations (250 for each set of selective conditions, Figure 4), the parameters were randomly initialised at the start of each run. This means that the averages given in Table 1 reflect a wide range of possible social conditions. It also allows an examination of the relationship between individual parameters and the degree of isolation. Again it should be remembered that 'genetic isolation' can also be taken to mean 'memetic isolation for strictly vertical traits'. Correlation coefficients were calculated between each of the three variable parameters, m, n and o, and the resulting genetic and memetic isolations obtained. The significance of the correlation co-efficients was determined using a t-test. The results are presented in Table 2, where statistically significant correlations are highlighted in red.


Table 2: Correlation co-efficients between the degree of memetic and genetic isolation and the three variable parameters of the simulation. Those correlations determined to be statistically significant at p < 0.01 using a t-test are highlighted in red.

Cultural SelectionNatural SelectionCorrelation with memetic isolationCorrelation with genetic isolationParameter
NoNo0.12
-0.53
-0.18
0.10
-0.12
-0.01
Migration
Teach in own culture
Teach neighbour
YesNo0.06
-0.27
0.04
0.14
0.01
0.00
Migration
Teach in own culture
Teach neighbour
NoYes0.07
0.06
0.03
0.03
0.17
-0.10
Migration
Teach in own culture
Teach neighbour
YesYes-0.10
-0.19
0.08
0.06
-0.10
0.06
Migration
Teach in own culture
Teach neighbour

3.10
The most obvious fact that is apparent from Table 2, is that all of these correlations are relatively weak. Even among the statistically significant ones (highlighted in red), only a single one has an absolute magnitude above 0.5. Migration has no significant correlation with genetic or memetic isolation under any of the four sets of selective conditions. This is probably because migration is, in this simulation, primarily an individual activity. Concerted migration, with societies sending large groups of individuals to colonize adjacent societies, would clearly reduce both genetic and memetic isolation. However, this is not modelled here.

3.11
The negative correlation of -0.53, between the "Teach in Own Culture" parameter and the tendency to memetic isolation, merits some further discussion, partly because it is the strongest single correlation, and partly because it might at first inspection, seem a little counter-intuitive. In plainer language, the correlation states that memetic isolation becomes more likely with less overall cultural interaction within a society. The reason for this is that when cultural interaction drops towards zero, horizontal transmission effectively ceases, and the Meme attribute becomes essentially a vertically transmitted trait. Therefore, if the meme constitutes a minority within any society into which it has passed, the voting system (Figure 2) means it has little influence on the cultural designation of that society. The correlation is diminished by the introduction of contagion by cultural selection, because it doubles the tendency of one Meme to be transmitted, and is removed completely out of the range of statistical significance by the introduction of natural selection. This is because natural selection enables Meme attributes to increase in frequency without the requirement for cultural transmission (because the agents with those attributes leave more progeny).

Summary of the Simulation

3.12
The overall conclusions of the various simulations may be summarised as follows:
  1. Strictly vertically transmitted traits, e.g. genes or strictly vertically transmitted memes, have a tendency to isolation that is, on average, no different to a random background probability. This average tendency is essentially unaffected by the rate of migration between neighbouring societies.
  2. Strictly vertically transmitted traits have a slightly reduced tendency to isolation if there is simultaneous selection on a horizontal trait within the population. This effect is strongest when the horizontal trait is simultaneously naturally and culturally selected.
  3. Horizontal traits, by contrast, demonstrate far lower tendencies to isolation. In the presence of cultural selection, the traits behave contagiously and memetic isolation is virtually eliminated. Natural selection of memes also reduces their tendency to isolation, but not so markedly.
  4. The dynamics of the situation are very noisy. The correlation coefficients of the average tendency to isolation with the levels of the three input variables, m, n and o, although technically statistically significant, are unimpressive. Thus, although the fact that a meme is horizontally transmitted decreases its likelihood of isolation, the degree of social interaction and migration does not give any particularly strong predictive indication of its likely degree of isolation. Such prediction is best obtained by considering whether or not the meme is contagious.

* Empirical analysis of 863 societies

4.1
The simulation described above shows that memes that are to some degree horizontally transmitted are less likely to exist in isolation. This is especially true if those memes are naturally or culturally selected. By contrast those that are predominantly vertically transmitted, and behave in a manner analogous to haploid genes, will have a greater tendency to be found in conditions of geographical isolation. Several statistical properties of the simulation have also been discussed. In the second half of this paper, a comparison of these simulations with real ethnographic data on distribution of cultural traits is performed.

Source and nature of data

4.2
Data on the geographical distribution of memes is available in Murdock's classic Ethnographic Atlas (Murdock 1967). For each of the 863 societies, 41 categories of cultural data are listed. Within each category a variety of states are listed. Some data sets have several states (for instance category 64 "Linguistic Affiliation" has 128 options), others have few (for instance category 34 "High Gods" has only four options, namely "high god otiose", "high god supportive" "high god unsupportive", "high god absent"). Each state within each category can be regarded as allomemic to the others. In occasional instances, Murdock gives a double option, for instance for category 67 "Class stratification", the Tswana are listed as a hybrid of option D, "dual stratification" and E, "elite stratification". In such cases, the hybrid is treated as an allomeme in its own right.

4.3
In order to identify memetic isolates, a geographical distance matrix was prepared for the 863 societies using the latitude and longitude values given by Murdock (1967). From this distance, it is possible to calculate the nearest neighbour for each society. The process for determining the degree of geographical isolation for a given trait is:
  1. For each society, determine nearest geographical neighbour.
  2. Compare allomeme of society with that of nearest neighbour.
  3. If the same, score as match, if not, score as mismatch.
  4. Repeat for all societies.
  5. Determine the percentage of mismatch over all comparisons made.

4.4
The percentage mismatch is the degree to which the allomemes of a trait tend to be found in isolation. Three caveats must be admitted concerning the comparability of the empirical data with the simulation:
  1. The attributes of the agents in the simulation are 'known' to be cultural traits, since they are defined as such. However, the attributes in the empirical data set may be demographic or economic factors, that are not readily transmissible, and thus cannot realistically qualify as cultural traits in the sense of Cavalli-Sforza and Feldman (1981). The limited subset of attributes chosen from the empirical data set reflect caution concerning their plausibility as culturally transmissible entities.
  2. The simulation has societies arranged in a grid, with up to eight equidistant neighbours for each society. The empirical data, however, is arranged by geographical co-ordinates, so societies are distributed at widely differing densities (see Figure 5). The analysis, therefore, chooses a single neighbouring society for the assessment of memetic isolation. There is consequently perhaps a danger that the empirical analysis will overestimate the degree of cultural isolation. An alternative might well be to choose the nearest eight, or so, societies.
  3. The simulation uses four allomemes. The cultural traits in the empirical data can have as many as 128 allomemes (in the extreme case of language family). Even neglecting language family, the average number of allomemes for each trait is just over eight. Therefore a normalisation is performed to ensure that background chance of isolation is not distorted.

4.5
A Perl script for calculating the geographical distances, and detecting cultural isolates is given below (Listing 3, see Appendix)

* Results of empirical analysis

5.1
Seventeen cultural categories were selected from Murdock's data. Category 64 "Linguistic Affiliation" was chosen as it is felt by Guglielmino et al. (1995) to be the most 'vertically transmitted' cultural trait. It thus provides a degree of benchmarking for the other categories.

5.2
Since the greater the number of allomemes in a category, the greater the random chance of memetic isolation, the background level for isolation is calculated as (n-1)/n for n allomemes (see caveat c, above). This background level is then used to normalise the observed level, in order that traits with different numbers of allomemes may be compared, as if they all had four allomemes and were arrayed on a grid, as in the simulations. For instance, a trait with six allomemes has a background level of expected isolation of 5/6, or 83%. Thus with a random background level in the simulation of just under 4% (see section 3.1, above) a trait with six allomemes exhibiting isolation of, say, 50% (i.e. half of all societies do not share the same allomeme as their nearest neighbour), would have a normalised isolation of (50/83) × 4%, or 2.4%.

5.3
Since extensive runs of the simulations provide a large enough number of data points to apply normal distribution statistics, z-tests are used to compare the normalised isolation figure for each empirical trait against the distributions obtained for the simulations. The z-test score of 1.96 indicates exclusion from conformity to the simulation predictions, at the 5% significance level in a two-tailed significance test. The results are summarised in Table 3. Exclusion at the 5% level is indicated by orange shading.

5.4
Some salient points are immediately visible from Table 3.
  1. Z-test columns "NNm" (i.e. Meme with no selection) and "YYg" (i.e. Gene with cultural and natural selection on Meme) have no shaded cells. This means that no empirical data can be excluded from potentially corresponding to those models. This means that all the memes in the data set could be drifting horizontal traits (i.e. a Meme under neither kind of selection). Also, no empirical data can be excluded from being a vertical trait where horizontal traits in the same population are under conditions of both cultural and natural selection.
  2. By complete contrast, z-test column "YYm" (i.e. Meme under both cultural and natural selection) is completely shaded. This means that z-tests exclude any trait from being a naturally selected contagious horizontal trait. Note that the z-scores in this column are extremely high, thus excluding this hypothesis for all data at well beyond the 5% level (and indeed at p tending to zero). It seems that such aggressively spreading memes are indeed rare in the real world.

5.5
Since salient point 2 above excludes all data from being memes under simultaneous cultural and natural selection, the second part of salient point 1 is probably inconsequential, as the situation in that model would be rare (vertical trait where horizontal traits in the same population are under conditions of both cultural and natural selection.). Therefore column "YYg" is given a yellow stripe to indicate that although statistically possible in comparison with one simulation, results of other simulations render it highly unlikely.

5.6
Considering now the rows of Table 3, it is possible to see that there are 4 broad groups of traits.
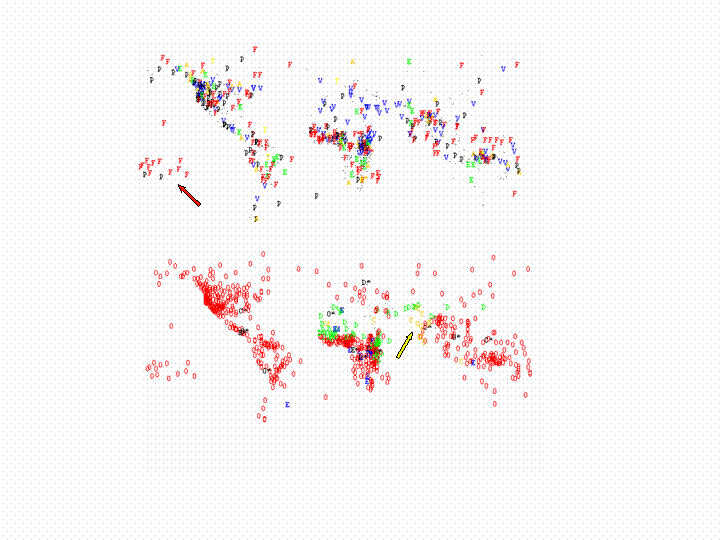
  1. "Caste Stratification". This trait sits alone at the foot of the table, and its pattern (permitted "NNm", "NYm", "YNm" and "YYg") suggests that it is most likely to be horizontal under either cultural or natural selective forces, but not both. It may be vertical, but only if the population contains a horizontal trait under both cultural and natural selection (which is shown to be rare in salient point 2 above - "YYg" is given a yellow stripe). Therefore, it is suggested that "Caste Stratification" is under horizontal dynamics, but the selective pressure may not be deduced from the distribution alone; it may be either naturally selected or contagious. See Figure 5 for a map of the geographical distribution of the allomemes in this trait.
  2. "Linguistic Affiliation", "Cognatic Kin Groups", "Male Genital Mutilations" and "Matrilineal Kin Groups and Exogamy". These have the same pattern as the above, but are also excluded from being horizontal traits under cultural selection ("YNm" excluded). Therefore, these four traits are also likely to be under horizontal dynamics, but are either drifting or naturally selected. The positioning of "Linguistic Affiliation" in this group is interesting and is further discussed below.
  3. "Succession to Office of Local Headman", "Jurisdictional Hierarchy", "High Gods", "Mode of Marriage", "Class Stratification", "Agriculture", "Segregation of Adolescent Boys", "Slavery", "Settlement Pattern", "Types of Games". From this point upwards the table admits hypotheses of vertical transmission. For this central block, the only excluded hypotheses are "YNm" and "YYm" (horizontal under cultural selection only or horizontal under both cultural and natural selection). Thus one might say that these are either drifting or naturally selected horizontal traits or vertical traits.
  4. "Post-partum Sex Taboos" and "Norms of Premarital Sex Behaviour". Here "NYm" (natural selection of horizontal traits) is also excluded. For this final group, which notably contains two traits associated with sexual behaviour, the emphasis must be on vertical transmission. However, the possibility of drifting horizontal dynamics is still allowed.

Table 3
Table 3. Summary of empirical data compared to simulations.
The columns are as follows:
Trait category: description and number taken from Murdock,
isol.: average degree of memetic isolation for allomemes in that category,
allo.: number of allomemes
norm: the normalised memetic isolation against the random background,
Z-tests: z-test comparing 8 models with the empirical data, cultural selection, natural selection and vertical or horizontal transmission, e.g. YN g = model of vertical trait where horizontal trait is under cultural selection; NY m = model of horizontal trait under natural selection etc. The orange shaded boxes are those where the z-test gives a value of > 1.96, thus indicating that the empirical data has p < 0.05 of conforming to the model. These are traits which are therefore unlikely to be explicable in terms of that model. The yellow stripe in column 7 indicates that this conformity to this simulation (drifting vertical trait, but with horizontal trait culturally and naturally selected in the same population) is improbable, although statistically possible (see text).

5.7
Geographical distribution of the traits among the most likely and least likely to be geographically clustered can be visualised in Figure 5.

Figure 5
Figure 5. Geographical distribution of cultural traits for two of Murdock's categories, chosen to contrast the upper and lower end of Table 3.. Above: "Norms of Premarital Sex Behaviour" (A: pregnancy avoidance, E: early marriage, F: "free love", T: trial marriage, P: weak prohibition, V: virginity). Below: "Caste Stratification" (C: complex, D: despised group, E: ethnic stratification, O: absent, dots are those societies for which no information is available in Murdock). Some well known features may be seen on the maps, such as Margaret Mead's focus of "free love" in the South Pacific (red arrow upper panel) and the presence of the caste system in the Indian subcontinent (yellow arrow lower panel).

* Discussion

Have the Original Questions Been Answered?

6.1
In Section 1, above, two questions were asked. These may now be answered, as follows:
  1. What is the mean tendency to memetic isolation for traits, under different modes of transmission and selection, in the simulation? Answer: the simulation demonstrates a large degree of noise in the model. The most important factors emerging through the noise are: horizontal traits do tend to be less likely to be isolated than vertical ones; and that selection, especially cultural selection, tends to eliminate memetic isolation.
  2. What is the global tendency to memetic isolation for a wide range of traits in the real world? Answer: no traits in the empirical data are more isolated than random chance, which also means that none are more isolated than drifting strictly vertical traits. One trait ("Caste Stratification") is sufficiently non-isolated to be compatible with a model of a horizontal trait under selection of some sort. At the other extreme, two traits ("Post-partum Sex Taboos" and "Norms of Premarital Sex Behaviour") are sufficiently isolated to be classifiable as primarily vertical traits. If they are horizontal, it is improbable that they are under selection of any kind.

6.2
These points permit the construction of falsifiable predictions concerning the model presented here, namely: that "Post-partum Sex Taboos" and "Norms of Premarital Sex Behaviour" are not contagious traits, conversely "Caste Stratification" is either a contagious trait, or under natural selection. A more detailed examination of the ethnological and sociological literature on these topics might reveal if this is the case.

Comparison with Axelrod's "Social Influence Model"

6.3
As discussed, above (Section 2.6), this model has some similarities to Axelrod's (1997) "Social Influence Model" (SIM). In SIM, cultural isolation hardly, if ever, occurs. This is due to the use in SIM of cultural similarity, in terms of several attributes, as a probabilistic factor in interaction. Thus SIM tends to homogenize interacting cultures, and distinguish them from non-interacting cultures, producing a multi-stable state. It is conceivable that SIM might generate, in its random initialization, a highly unusual culture that was rendered an isolate by virtue of an extremely low probability of taking part in any interactions with neighbours. This is not reported in Axelrod (1997), but Castellano et al. (2000) were able to derive conditions under which it would occur.

6.4
Since Murdock's data treats societies as having homogeneous cultures (although there are occasional footnotes indicating heterogeneity), it might be said that SIM is a more appropriate model for that kind of data set. An application of SIM to Murdock's data would certainly be interesting.

Possible Elaboration of the Model

6.5
Obviously any comparison of a model with empirical data is only as good as the quality of either component. Addition of some or all of the following may be performed in the future, in order to make the model more realistic:
  1. Making the global variables m, n and o, into agent attributes. Thus instead of single values pertaining to all individuals in the population, the tendency of an individual to learn, migrate or even reproduce (the latter held constant in these simulations, except when NatSel is toggled on, when it is doubled for meme A only) could become part of the evolving system.
  2. Making natural and cultural selection pressures spatially heterogeneous. Thus instead of CultSel and NatSel being global variables that only affect meme A, they could affect different memes to different degrees in different parts of the geographical distribution.
  3. Starting from a non-random state. Currently the population is initialised at random, but real human populations have histories of group migration and relatedness etc. Initialising four rather more homogeneous populations in four corners of the distribution and allowing them to diffuse into each other might more accurately simulate what is known to be the most general case in actual human history. This might be particularly appropriate for the analysis of geographical areas where a demic expansion (i.e. large-scale migration driven by population pressure) is known to have occurred.

Is the Empirical Data Set Adequate?

6.6
Likewise, one must acknowledge reservations concerning the data set. Although Murdock (1967) provides extensive annotations concerning caveats or inconsistencies in the data, it is often impossible to translate such comments into digital representation. In particular, the non-quantitative nature of much of Murdock's data is difficult to reconcile with an approach which takes individuals rather than populations as the agent units. Thus, as mentioned above, a 'first-past-the-post voting system' has had to be adopted to translate meme frequencies in the models into absolute qualitative values that are comparable with Murdock's data. A population that just falls below the 50% cut-off will be recorded as "not-A" and one that exceeds it by 1% will be recoded as "A".

6.7
Some lighter comparison is also possible with other data sets. Previous work on transmission mechanisms among Stanford undergraduates revealed that certain traits were more likely to be transmitted in the family, e.g.. religion and politics (Cavalli-Sforza et al. 1982). The relevant politico-religious traits here are "High Gods", "Jurisdictional Hierarchy", "Succession to Office of Local Headman", "Class Stratification" and "Slavery". These all fall into the central group that are consistent with being drifting or naturally selected horizontal traits or vertical traits. However, "Caste Stratification" is interestingly at one extreme end of the spectrum, looking rather more like a contagious or naturally selected trait (Table 3 and Figure 5).

The Unexpected Position of Linguistic Affiliation

6.8
It was previously noted that "Linguistic Affiliation" falls into a cluster where vertical transmission is unlikely. This appears to be counter-intuitive, as languages are primarily acquired within families, and indeed this is central to their use by Guglielmino et al. (1995) as markers of vertical transmission. Guglielmino et al. (1995) assume that any trait correlated with Linguistic Affiliation is primarily vertically transmitted.

6.9
There are two alternative possibilities that may account for this apparent discrepancy:
  1. There are factors missing from the model. In particular it suggests that some account must be taken of concerted migration patterns. The degree of clustering of Linguistic Affiliation can, given the known historical record, be a result of radiation of languages through mass migration. Migration is modelled here as essentially an individual activity, which may fail to capture what may be an essentially communal tendency of migration in human history.
  2. There has been some mass Linguistic Affiliation contagion event in the past, for example imposition through conquest, the effects of which are still being seen in the data set, even though the actual primary transmission method is vertical.

6.10
Murdock's data set is primarily one of indigenous cultures. Thus although there are entries for "New Englanders" and "Brazilians" as colonial groups, the majority of African, Australian and American cultures listed are pre-European incursion. Therefore the contagion/imposition of Spanish/Portuguese to South America and English to North America etc. are scarcely represented. However, it is possible that some pre-European linguistic contagion/imposition events are evident in the data. For instance the issue of Indo-European language diffusion versus demic expansion (i.e. large-scale migration driven by population pressure) is still a controversial archaeological issue (e.g. Renfrew 1987).

More Realistic Parameters

6.11
Finally, it should be remembered that the mean values for each set of simulations (Table 1), and hence the z-tests to the empirical data (Table 3), involve a randomised set of starting parameters for each simulation. Thus the empirical data is tested for consistency with all possible parameters of a simulation. Narrower parameter ranges could produce models with far tighter standard deviations. These could then permit more precise z-testing of the empirical data.

6.12
This paper is designed as an initial approach to the quantitative study of social contagion through the use of ethnological data and its comparison with computer simulations. It is hoped that some of the analyses presented here will stimulate more exact hypotheses concerning individual traits and their cultural evolutionary trajectories.

* Appendix: Code Listings

A recent version of ActivePerl (Build 6 series or more recent, freely available from http://www.activestate.com) provides all the necessary Perl library components. The scripts will run on any version of Perl later than 5.005, provided that both Perl and the Tk library are installed. All scripts provided have been tested on RedHat Linux running Gnome, and on Microsoft Windows 98.

Listing 1: - the graphical simulator

Listing 2: - bulk runs (without graphics)

Listing 3: - deriving estimates of cultural isolation from the empirical data set

Raw data from Murdock tabulated


* References

AXELROD, R. 1997. The dissemination of culture: a model with local convergence and global polarization. Journal of Conflict Resolution 41: 203-226.

AXTELL, R., AXELROD, R., EPSTEIN, J.M. and COHEN, M.D. 1996. Aligning simulation models: a case study and results. Computational and Mathematical Organization Theory 1: 123-141.

BARBUJANI, G. and SOKAL, R.R. 1990. Zones of sharp genetic change in Europe are also linguistic boundaries. Proc. Natl. Acad. Sci. USA 87: 1816-1819.

CAVALLI-SFORZA, L.L. and FELDMAN, M.W. 1973. Models for cultural inheritance. I. Group mean and within group variation.. Theor Popul Biol. 4: 42-55.

CAVALLI-SFORZA, L.L. and FELDMAN, M.W. 1981. Cultural Transmission and Evolution. Princeton University Press, Princeton.

CAVALLI-SFORZA, L.L. 1979. Cultural change and its relevance for human genetics. Ciba Found. Symp. 66: 5-23.

CAVALLI-SFORZA, L.L., FELDMAN, M.W., CHEN, K.H. and DORNBUSCH, S.M. 1982. Theory and observation in cultural transmission. Science 218:19-27.

CASTELLANO, C., MARSILI, M. and VESPIGNANI, A. 2000. Nonequilibrium phase transition in a model for social influence. Physical Review Letters 85: 3536-3539.

DE SILVESTRI, A. and GUGLIELMINO, C.R. 2000. Ethnicity and malaria affect surname distribution in Consenza Province (Italy). Hum. Biol. 72: 573-83.

DURHAM, W.H. 1991. Coevolution: Genes, Culture and Human Diversity. Stanford University Press, Stanford.

FELDMAN, M.W. and CAVALLI-SFORZA, L.L. 1984. Cultural and biological evolutionary processes: gene-culture disequilibrium. Proc. Natl. Acad. Sci. USA 81:1604-1607.

GATHERER, D. 2002. The Spread of Irrational Behaviours by Contagion: An Agent Micro-Simulation. Journal of Memetics - Evolutionary Models of Information Transmission 6. http://jom-emit.cfpm.org/2002/vol6/gatherer_d.html

GONZALEZ JOSE, R., GARCIA-MORO, C., DAHINTEN, S. and HERNANDEZ, M. 2002. Origin of Fueguian-Patagonians: an approach to population history and structure using R matrix and matrix permutation methods. Am. J. Human Biol. 14: 308-320.

GRAY, R.D. and JORDAN, F.M. 2000. Language trees support the express-train sequence of Austronesian expansion. Nature 405: 1052-1055.

GUGLIELMINO, C.R., VIGANOTTI, C., HEWLETT, B. AND CAVALLI-SFORZA, L.L. 1995. Cultural variation in Africa: Role of mechanisms of transmission and adaptation. Proc. Natl. Acad. Sci. USA 92: 7585-7589.

KIMURA, M. (1979) The neutral theory of molecular evolution. Sci Am 241: 98-108.

KUMM, J., LALAND, K.N. and FELDMAN, M.W. 1994. Gene-culture coevolution and sex ratios: the effects of infanticide, sex-selective abortion, sex selection, and sex-biased parental investment on the evolution of sex ratios. Theor. Popul. Biol. 46: 249-278.

LALAND, K.N. 1994. Sexual selection with a culturally transmitted mating preference. Theor. Popul. Biol. 45: 1-15.

MURDOCK, G.P. 1967. Ethnographic Atlas. University of Pittsburgh Press, Pittsburgh.

RASHEVSKY, N. 1949. Mathematical biology of social behaviour I. Bull. Math. Biophys. 11: 105-113.

RENFREW, C. 1987. Archaeology & Language: The Puzzle of the Indo-European Origins. Jonathan Cape, London.

SIEVER, E., SPAINHOUR, S. and PATWARDHAN, N. (1998) Perl in a Nutshell. O'Reilly and Associates.

SOKAL, R.R., ODEN, N.L., LEGENDRE, P., FORTIN, M.J., KIM, J.Y. and VAUDOR, A. 1989. Genetic differences among language families in Europe. Am. J. Phys. Anthropol. 79: 489-502.

THOMSON, G. 1977. The effect of a selected locus on linked neutral loci. Genetics 85: 753-88.

UYENOYAMA, M., FELDMAN, M.W. and CAVALLI-SFORZA, L.L. 1979. Evolutionary effects of contagious and familial transmission. Proc. Natl. Acad. Sci. USA 76: 420-424.

VONA, G., CALO, C.M., LUCIA, G., MAMELI, G.E., SUCCA, V., ESTEBAN, E. and MORAL, P. 1996. Genetics, geography, and culture: the population of S. Pietro Island (Sardinia, Italy). Am. J. Phys. Anthropol. 100: 461-471.

WAGENER, D.K. and CAVALLI-SFORZA, L.L. 1975. Ethnic variation in genetic disease: possible roles of hitchhiking and epistasis. Am. J. Hum. Genet. 27: 348-364.

----

ButtonReturn to Contents of this issue

© Copyright Journal of Artificial Societies and Social Simulation, [2002]