
 Abstract
- Agent-based models (ABM) are ideal tools to deal with the complexity of pest invasion throughout agricultural socio-ecological systems, yet very few studies have applied them in such context. In this work we developed an ABM that simulates interactions between farmers and an invasive insect pest in an agricultural landscape of the tropical Andes. Our specific aims were to use the model 1) to assess the importance of farmers' mobility and pest control knowledge on pest expansion and 2) to use it as an educational tool to train farmer communities facing pest risks. Our model combined an ecological sub-model, simulating pest population dynamics driven by a cellular automaton including environmental factors of the landscape, with a social model in which we incorporated agents (farmers) potentially transporting and spreading the pest through displacements among villages. Results of model simulation revealed that both agents' movements and knowledge had a significant, non-linear, impact on invasion spread, confirming previous works on disease expansion by epidemiologists. However, heterogeneity in knowledge among agents had a low effect on invasion dynamics except at high levels of knowledge. Evaluations of the training sessions using ABM suggest that farmers would be able to better manage their crop after our implementation. Moreover, by providing farmers with evidence that pests propagated through their community not as the result of isolated decisions but rather as the result of repeated interactions between multiple individuals over time, our ABM allowed introducing them with social and psychological issues which are usually neglected in integrated pest management programs.
- Keywords:
- Socio-Ecological Systems, Farmers, Invasive Pest, Long Distance Dispersion, Teaching
Introduction
- 1.1
- Agricultural systems are composed by two interlinked and interdependent subsystems, the social and the ecological subsystems, which co-evolve and interact at various levels and scales (Liu 2007). As a consequence, these systems are characterized by complex spatio-temporal dynamics and cultural variation (Papajorgji 2009). The management of agricultural invasive pests lies at the heart of such a complexity as pest propagation depends on both environmental features (e.g. climate, landscape structure) and farmers' behaviors (e.g. man-induced pest dispersion) (Epanchin-Niell 2010). The problems with dealing with multiple actors, non linearity, unpredictability, and time lags in invaded agricultural systems suggest that agent-based models (ABM) may have an important role to play in the sustainable development of farmers' practices to face those emergent threats (Berger 2001). Although ABM have increasingly been applied to physical, biological, medical, social, and economic problems (Bagni 2002; Bonabeau 2002; Grimm 2005a) it has been, to our knowledge, disregarded by invasive pest management theory and practice.
- 1.2
- Intrinsic dispersal capacities of agricultural invasive pest (in particular insects) are rarely sufficient to make them major threats at a large spatial scale. In most cases, invasive pest expansion is dependent on long-distance dispersal (LDD) events, a key process by which organisms can be transferred over large distances through passive transportation mechanisms (Liebold 2008). The study of the dynamics of pest dispersion in agricultural landscape is therefore comparable to that of disease contagion: as diseases, pests are transmitted from an infected person (farmer) to another who was previously "healthy", through different biological, social and environmental processes (Teweldemedhin 2004; Dangles 2010). Several studies have shown that the dynamics of infection spread involves positive and negative feedbacks, time delays, nonlinearities, stochastic events, and individual heterogeneity (Eubank 2004; Bauer 2009; Itakura 2010). Two factors have revealed particularly important to predict disease dynamics: (1) the number of encounter events between infected and healthy individuals, which mainly depends on individuals' mobility (Altizer 2006), and (2) the contamination rate between infected and healthy individuals, which depends on heterogeneous susceptibilities of individuals to be infected (Moreno 2002; Xuan 2009). Similarly, the spread of invasive pests throughout the agricultural landscape would depend on (1) movements of farmers carrying infested plants or seeds into new areas and (2) farmer's knowledge to detect the pest (pest control knowledge), therefore avoiding being infested and impeding the contamination of new areas (Dangles 2010).
- 1.3
- Borrowing from disease contagion literature (e.g.Gong 2007; Yu 2010), we developed, using NetLogo (Wilensky 1999), an ABM to simulate the spread of an invasive potato insect pest in an agricultural landscape of the tropical Andes. Our model combined an ecological sub-model, simulating pest population dynamics driven by a cellular automaton including environmental factors of the landscape, with a social model in which we incorporated agents (farmers) potentially transporting and spreading the pest through displacements among villages. We then used our model for two purposes. First, we ran the ABM under 10 levels of agents' (farmers) movements among villages and 7 levels of heterogeneity in farmer's pest control knowledge. We compared the resulting diffusion dynamics on the speed of pest spread, which represents a relevant metrics for invasive pest management by local stakeholders (e.g. the time available for agriculture officials to respond to the threat). Second, we used our ABM as an education tool to increase farmer awareness on the importance of human-related LDD events of the pests which fostered the invasions of their valley (see Dangles 2010). While we specifically focused on an invasive insect pest in the tropical Andes in this paper, our approach to understand the influence of farmers' movements and pest control knowledge on pest dynamics and to transfer it through educational programs would be applicable to a much wider geographic and species range.
Study system
- 2.1
- Our study deals with the potato tuber moth (Tecia solanivora), an invasive pest that has spread from Guatemala into Central America, northern South America and the Canary Islands during the past 30 years (Puillandre 2008). This pest attacks potato (Solanum tuberosum) tubers in the field and in storage and has become one of the most damaging crop pests in the North Andean region (Dangles 2008). Commercial exchanges of potato tubers at regional and local scales for both seeding and consumption are the main causes for the rapid expansion of the pest in all parts of the Ecuadorian highlands (2400-3500 m.a.s.l). These landscapes are characterized by highly variable environmental and social conditions due to steep altitudinal gradients and dispersed human settlement, respectively.
Model
-
Overall structure of the model
- 3.1
- The socio-agronomical framework of the model consists in three key elements (Figure 1): 1) the agricultural landscape characteristics provided by a GIS environmental data base (Biodiversity Indicators for National Use, Ministerio del Ambiente Ecuador and EcoCiencia 2005), 2) the insect pest population, and 3) the groups of farmers. Pest dynamics in interaction with landscape features (e.g. land use, climate) is simulated through a cellular automaton (see the following sub-section). To transfer the cellular automaton into an agent-based simulation model we included farmers as agents acting individually upon pest dynamics in the agricultural landscape. Pests are therefore represented as a layer in the cellular automaton and farmers as agents in the ABM.
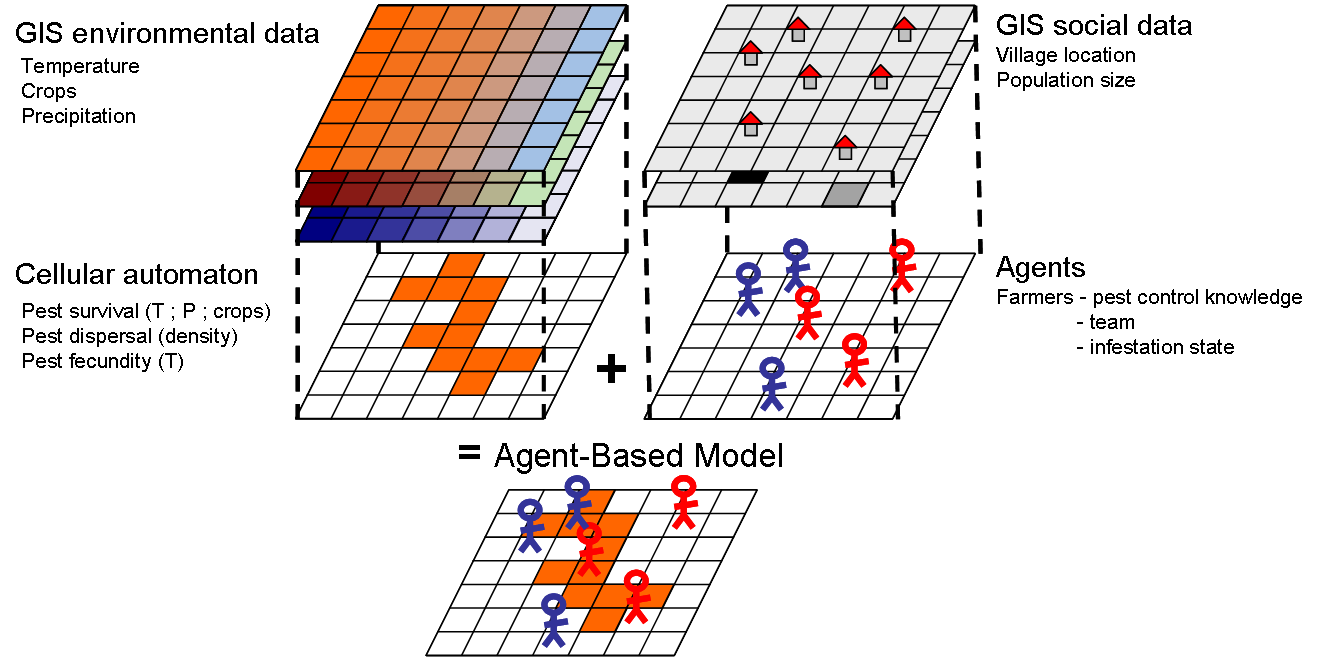
Figure 1. Schematic representation of the model structure Modeling pest dynamics through cellular automata
- 3.2
- The spatio-temporal dynamics of potato tuber moth is modeled through a simplified version of the cellular automaton developed by Crespo-Pérez (submitted). This model was developed with the CORMAS modeling platform and is detailed in Appendix 1. Briefly it is based on biological and ecological rules derived from field and laboratory experimental data for T. solanivora 's physiological responses to climate. Main processes include moth survival (climate dependent), dispersal through diffusion processes (density dependent), and reproduction (climate dependent). This model has been validated in a study area of 20 × 20 km within the remote valley of Simiatug in the Central Ecuadorian Andes (see section 5) represented by a grid of 1,600 cells with a cell size of 0.25 km2.
Modeling human-related pest dispersion through the agent-based model
- 3.3
- The ABM aims at simulating the influence of farmers on the spatio-temporal dynamics of the potato moth. In this particular model, farmers are considered as potential agents for pest LDD, for example when they carry infested potato sacks from local markets to their home (other interactions with the pest, such as control by pesticide, are not included in this model). Their efficiency as LDD agents depends on their pest control knowledge: the higher their knowledge, the lower the probability they get their field infested after potato sacks transport (see below).
Agent process overview and scheduling
- 3.4
- Agent process overview and scheduling are presented in figure 2. Agents move around on a grid of cells whose level of pest infestation is modeled by the cellular automaton (see Appendix 1). During each movement within a single timeframe agents turn "infested" (i.e. their potato crops are infested by the moth) or remain "non-infested" depending on their pest control knowledge and the pest infestation in a given cell. Each timeframe is equal to one moth generation (i.e. about 2 months) during which agents can move several times depending on their travel decisions. Agents with higher pest control knowledge (e.g. knowing how to recognize moth damage when they buy potato sacks at the market) have a lower probability of becoming infested. Then, agents move from one village to another to buy and/or sell potatoes. Agents' movements follow a gravity model (Rodrigue 2009), where the attractiveness of a village i compared to a village j is a function of both population size and cost-distance between them. Village infestation occurs when an infested agent moves to a non-infested village (carrying infested potato sacks which will be used as potato seeds and thereby infest neighboring fields). Agent infestation occurs when a non-infested agent moves to an infested village (buying infested potato seed sacks), depending on his pest control knowledge (higher pest control knowledge leads to lower probability of buying infested sacks).
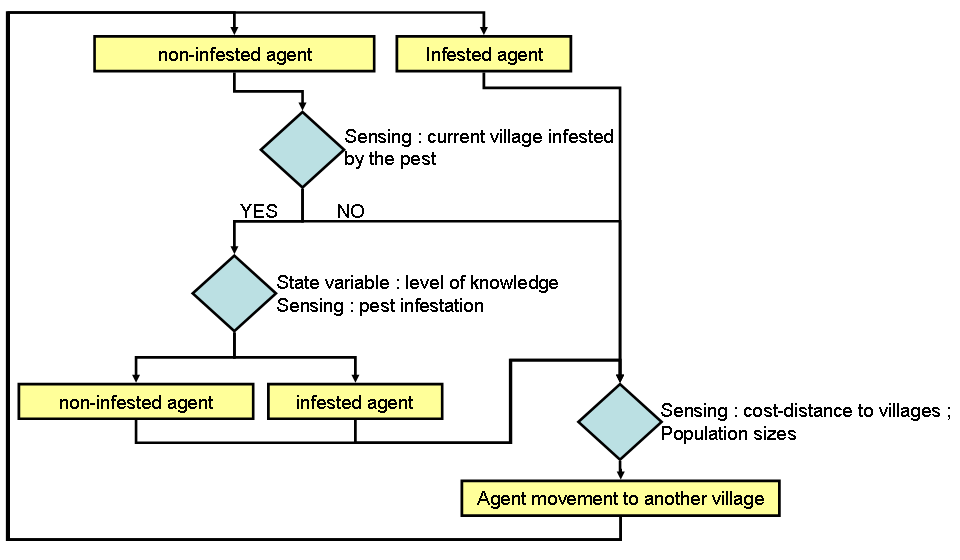
Figure 2. Agents' processes loop showing how farmers influence pest infestation spread. This loop is executed various times depending on farmers' traveling decisions during each timeframe. Design concepts
- 3.5
- Agents can sense the pest infestation of the cells but they do not use this information for their traveling decision. Instead, agents sense village population size and distance between villages so that they are able to perceive the relative cost/benefit of going to each village to sell/buy their crop: (1) it is less expensive to travel to closer villages and (2) more populated villages provide higher commercial opportunities. As a result, time needed to reach a complete pest infestation in the area emerges from a combination of purely biological pest dispersion, agents' movements from village to village and agent's pest control knowledge. A model example is available online at http://www.openabm.org.
Testing the effect of agents' movement and pest control knowledge on pest spread dynamics
-
Effect of agents' movements
- 4.1
- We examined with our ABM how the number of agents' movements per generation would impact pest invasion dynamics. As we were interested in the early phases of invasions, which represent a relevant metrics for invasive pest management by local stakeholders, we used the time needed to reach 5% of infested cells as an outcome variable.
- 4.2
- We found that increasing from 1 to 10 the number of agents' movements in the landscape had a negative exponential effect on the spread of the invasive pest (Figure 3 and animation in Appendix 2). Invasion speed was particularly increased up to 4 movements and then tended to stabilize. As expected, the effect of agents' movement on invasion speed was intensified by the number of agents located on the landscape, but once again this effect was not linear: insect pest dynamics was speeded up when adding up to 10 agents but remained roughly unchanged for the 10 following ones. For an intermediate scenario (4 movements, 10 agents), the speed of invasion was twice faster that of a purely biological spread (i.e. through insect's dispersion capabilities alone). We are aware that the spatial configuration of our social landscape (see the frequency of infested farmer movements in Figure 4) likely influenced our results. Further studies including randomly generated social landscapes could help to quantify this effect on agents' movements and subsequent pest infestation dynamics.
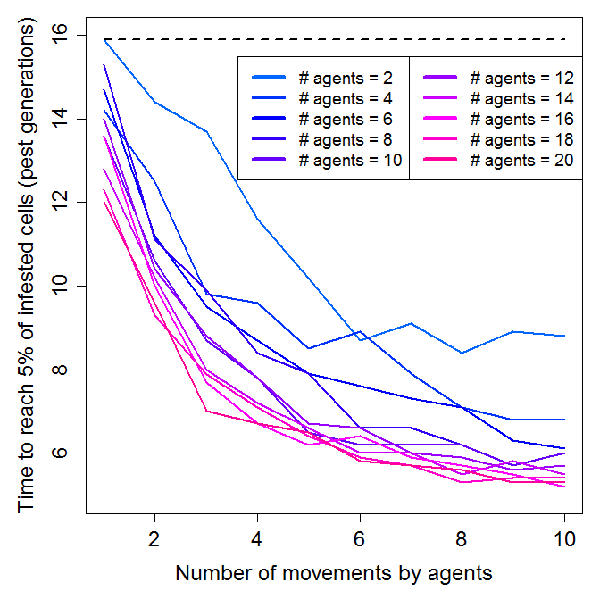
Figure 3. Influence of agents' movements (per pest generation) on pest infestation dynamics for different agent densities (n=2 to 20). The dashed line represents time needed to reach 5% of infested cells without agents (purely "biological" spread). - 4.3
- Our results highlight the importance of insect pest passive transportation by humans which allows invasive pests to make long-distance dispersal jumps. Even though several authors have acknowledged the significance of this type of dispersal for species spread, (e.g., Bossenbroek 2001; Suarez 2001) its inclusion in models still poses difficulties for modelers (Pitt 2009). Most dispersal models are based on empirically measured rates of pest dispersal, while in the case of LDD events it would be more useful to model human behaviors to better understand pest invasion dynamics. In this context, ABM offer an interesting yet poorly used method, to be applied to the vast field of biological invasions (see Luo 2010 and Vinatier 2009 for one of the rare study on exotic species using ABM, although in their case, agents are the invasive species). Results of our ABM simulations further revealed non linear processes between farmers' behavior (e.g. movement) and densities and pest spread, as already shown for disease expansion by epidemiologic models (e.g. Gong 2007). This suggests that a good understanding of social network structures would be a key step to better predict pest invasion speed in human dominated landscapes. In this context, ecologists would gain in following the path traced by epidemiologists with ABM to better understand the dynamics of invasive pests.
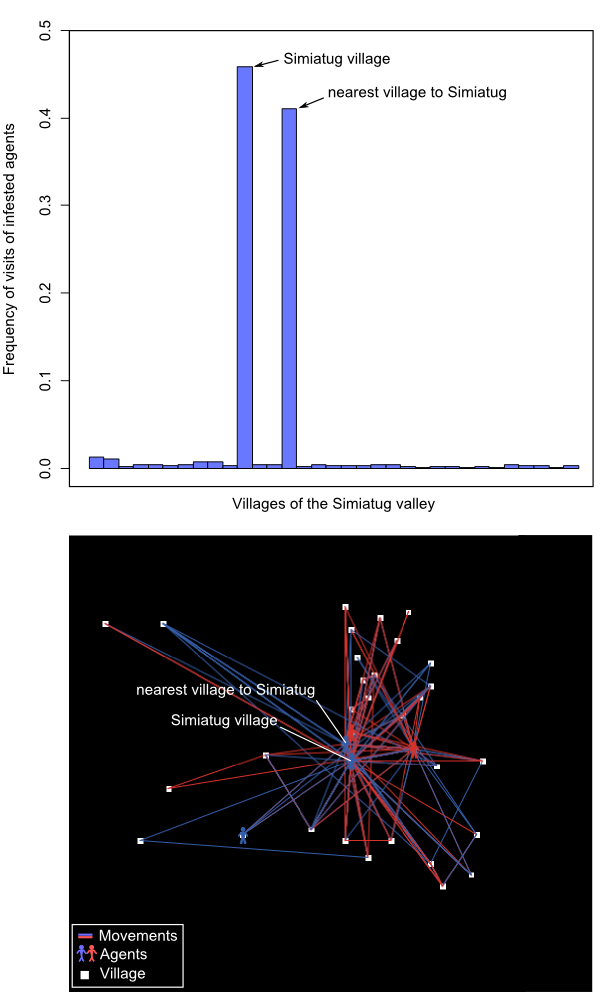
Figure 4. Frequency of visits of infested agents for each village and map of the Simiatug valley with agents' movements and villages location. Effect of agent's heterogeneity in pest control knowledge
- 4.4
- We then explored with our ABM how agents' pest control knowledge (ranked from 0 to 100) would impact pest propagation dynamics. As pest control knowledge was usually variable among farmers (Dangles 2010), we were interested in examining the influence of heterogeneous levels among agents on pest spread dynamics. To achieve this goal, we tested 7 levels of heterogeneity (standard deviation = 0, 5, 10, 15, 20, 25, 30) around 10 mean values of pest control knowledge (mean = 0 to 100). For each simulation, agents' pest control knowledge levels were randomly chosen from a Normal distribution, N(mean, standard deviation).
- 4.5
- Our simulations revealed that agents' pest control knowledge had a significant effect on pest invasion dynamics (Figure 5 and animation in Appendix 2). In all simulations, lower agents' pest control knowledge led to higher invasion speed, almost twice faster than intrinsic pest dispersion spread for highest infectivity values. Agents' movement had a worsening effect, with faster invasion occurring for higher agent's mobility. Agents' heterogeneity in pest control knowledge had a weak effect on pest dynamics, especially for high agents' mobility (6 and 4). However, heterogeneity in knowledge did introduce some sochasticity in invasion dynamics when agents seldom moved.
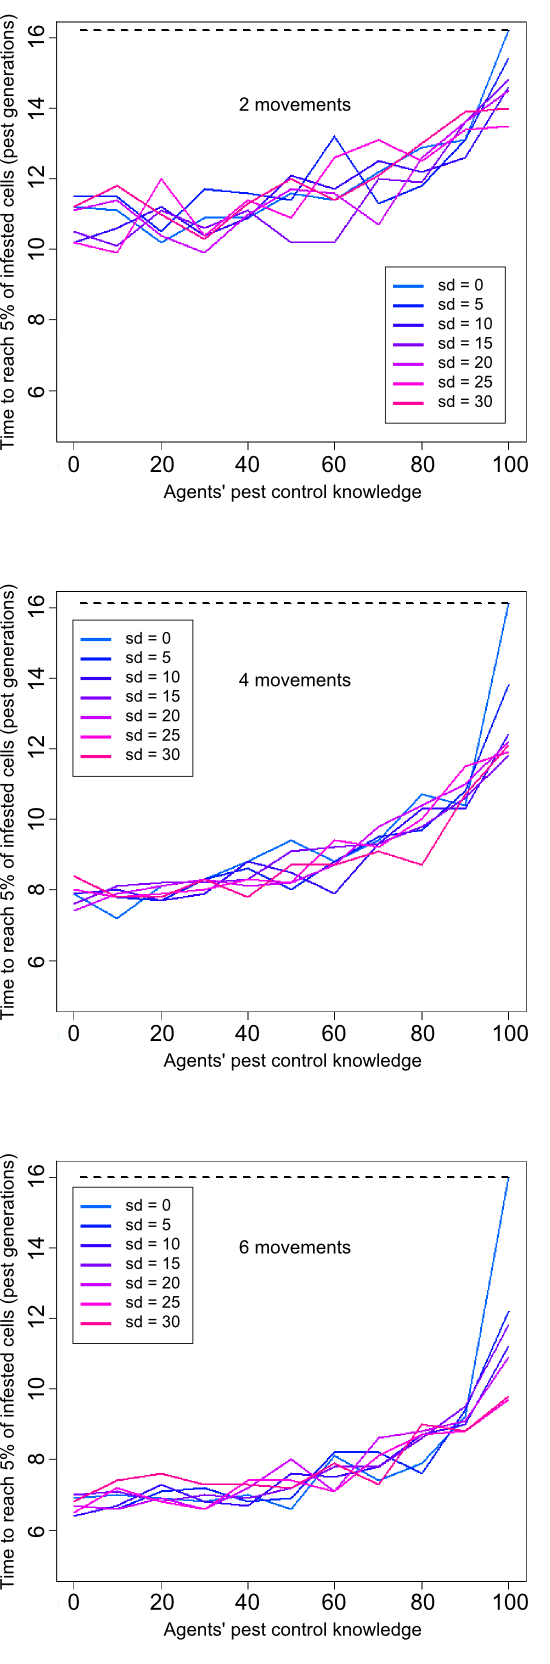
Figure 5. Influence of agents' pest control knowledge (means) and heterogeneity (standard deviation = 0 to 30%) on pest infestation dynamics for three frequencies of movements (2, 4, and 6). The dashed line represents time needed to reach 5% of infested cells without agents (purely "biological" spread). - 4.6
- As reported by epidemiologists for disease spread (e.g., Newman 2002), our results showed that agents' pest control knowledge had an important impact on the dynamics of pest invasion spread. This suggests that farmers' pest control knowledge would be a key, yet poorly studied, variable to take into account for modeling pest invasions in agricultural landscapes. Less expectedly, we found that heterogeneity of knowledge among agents had a relatively weak effect on pest dynamics, especially for high mobility levels of agents. This contrast with epidemiological models which have generally shown that heterogeneous populations enhance the spread of infections as well as make them harder to eradicate (for a review see Anderson 1992). One potential explanation is that the limited number of villages used in our study and the absence of spatial clusters favor infestation mixture among agents and rapidly smooth up its impact on invasion spread dynamics. However, our results showed that when all agents are "healthy" (pest control knowledge = 100), any addition of agents with lower levels of knowledge will considerably speed up pest dynamics (especially at high levels of movements), thereby confirming predictions of disease spread theory.
Teaching with the model
- 5.1
- In a second step, we used our ABM as an educational tool to teach farmers about potential invasion risks resulting from individual behaviors. Teaching activities were realized in February 2009 at the Agriculture and Technology College of the Simiatug valley in the central Ecuadorian Andes. This parish is comprised of roughly 45 kichwa communities living between 2800 m and 4250 m of altitude, that share similar characteristics in terms of social organization, date of establishment, and agricultural practices. Currently, about 25,000 people, mainly subsistence and market-oriented farmers, live in the Simiatug parish. The main agricultural products are pasture, cereals (barley), legumes (fava bean) and potatoes as well as cattle and sheep (see more details in Dangles 2010). Although the remoteness of the valley protects it against moth invasion, increasing commercial exchanges from and to Simiatug are currently increasing the risk of moth introduction. Local farmers were therefore interested in learning about potential risks associated with the pest and how to control their spread in the valley.
Model introduction to the farmers
- 5.2
- Introduction of the models and variable representation to the farmers has been a long process that began with the educational program set up in 2007 (Dangles 2010, see the timeline of the ground work in Figure 6).
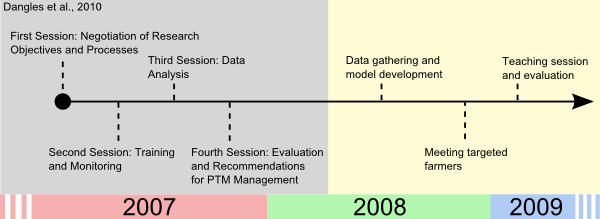
Figure 6. Timeline of the groundwork prior to the teaching session - 5.3
- For this program, we held a negotiation session to insure that teaching was driven by farmers' interests followed by a training session on integrated pest management and on participatory monitoring of potato moth in the valley. After the data analysis session, farmers had acquired a rather clear connection between pest abundance and air temperature, village size and remoteness (see Dangles 2010, for a detailed description of the sessions with farmers). This initial process allowed us to introduce our model in a second step and to use it as a teaching tool. Farmers were young (17 to 25 years old) and showed innate interest in "playing" with the computers and seeing simulations (an Internet café just opened in Simiatug the year before starting the ABM teaching session). The model was presented as a way to better understand a result that farmers themselves had found: the importance of LDD in moth dispersion (see Dangles 2010).
Model parameterization
- 5.4
- For teaching purposes, farmers were separated into two, "blue" and "red" teams; having two teams that compete for minimization of pest presence in the valley stimulated enthusiasm among farmers. Each member of the team was asked to fill a questionnaire including 20 items, 10 on basic issues (biology and ecology of the pest) and 10 on applied issues (pest management). A facilitator helped the players to fill in these questionnaires. Based on filled questionnaires, we built a "pest control knowledge index" for each farmer, which corresponded to the percent of questions answered correctly. Farmers were also asked to answer questions about their travel behavior in the valley (destination and frequencies). Villages' locations and population sizes were defined by farmers using maps (see figure 7). Environmental data such as temperature or precipitation were updated using real values in the considered area (Dangles and Carpio, unpublished data provided with the model in the openabm.org website).
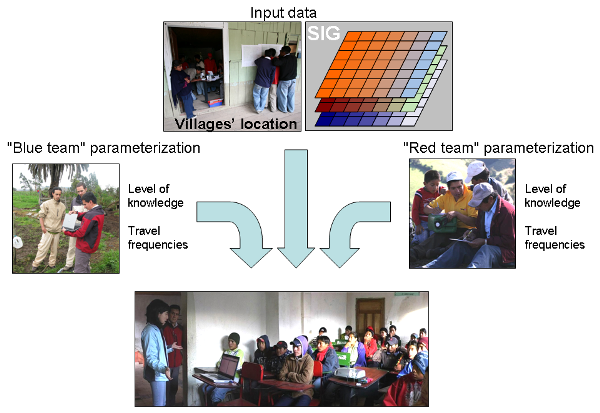
Figure 7. Teaching with an agent-based model in an agricultural valley of Ecuador Playing and learning with the agent-based model
- 5.5
- Once input data were collected and set up (Table 1), we ran the model and registered the spread of the pest throughout the valley. In all simulations, agents are randomly located at the beginning of the run.
Table 1: Parameters and simulation results of the gaming session with farmers Parameters Parameters values used for the gaming session Parameters values at the end of the gaming session Parameterization Number of farmers (agents) 10 10 Number of agents' movements per timeframe (pest generations) 6 3 Pest control knowledge (following a Normal distribution ~N(mean, sd)) < n(0.4;0.1) < n(0.8;0.1) Results Time needed for complete infestation (pest generation) 39 45 - 5.6
- Our model output could distinguish between 1) cells infested due to LDD events made by the blue team, 2) cells infested by red team LDD and 3) cells infested by insect's own dispersal capabilities (see http://www.openabm.org; see "pest dispersion" by innomip). Each team was therefore able to visualize its relative impact on moth dispersion throughout the Simiatug valley through the main color of a spatial interface representing the landscape. They were further invited to "play" with the simulation interface by changing LDD and the pest control knowledge values and to see the consequences in terms of moth spread throughout their valley. A synthesis of the processes involved in the teaching session (including required time) is given in Table 2.
Table 2: Processes and time required for teaching and learning Gaming session process Main activities Time spent Introduction Overall presentation of all actors 1 hour Computer presentation Presentation of computer simulation utility 30 minutes Model adoption: building community map (villages and populations) Presentation of the spatial representation of the model 30 minutes Model input variables (interviews) Model parameterization 1 hour Model output variables Running the model with the two teams, result presentation and discussion 1 hour Playing session 1: farmer movements and pest infestation spread Farmer teams modify agents' movements and visualize consequences on pest spreading 30 minutes Playing session 2: farmer knowledge and pest infestation spread Farmer teams modify agents' pest control knowledge and visualize consequences on pest spreading 30 minutes Conclusion and evaluation General discussion with farmers and interviews 1 hour Model adoption
- 5.7
- Because participants were young farmers we had no problem related to potential technical, cultural, knowledge or attitude barriers. One of the main difficulties related to model adoption turned out to be the spatial representation of farmer's villages, which was partially solved by building with them a digital map of their valley. Another difficulty was that farmers had a hard time in associating grid cell colors with the presence of moths. Unfortunately, we could not fix this problem during the teaching session and this was probably one of the main drawbacks of our approach. However, since this date, we improved the simulation to integrate the drawing of moths spreading on the cellular automata grid in a simple model aimed at improving its adoption (see http://www.openabm.org see "pest dispersion version 1" by innomip).
Benefits of model-based teaching to farmers
- 5.8
- At the end of the session we re-evaluated participant pest control knowledge on basic and practical moth control issues with the same 20-item indicators questionnaire (see above). The mean pest control knowledge (percent of questions answered correctly) increased from 40 ± 10 (basic) and 40 ± 20 (practical) at the beginning of the session to 80 ± 10 (basic), and 80 ± 10 (practical) at the end of the session, suggesting that farmers would be able to better manage pest risks after the teaching sessions. As a whole, our educational program (2007-2009) indeed enhanced local awareness about the need to control the pests before they became too numerous and covered the whole landscape. The main specific management decision taken by farmers was a promise to systematically check for moth infestation when buying potato tubers in the Simiatug market before transportation to their community (see also Dangles 2010). Although farmers vouched for model's attractiveness and usefulness to learn about pest problems, it remained hard to quantify knowledge enhancement specifically due to the ABM as opposed to that due to the rest of the educational participatory program. However, we believe that the use of ABM and computers significantly complemented our educational program on pest management in the valley as it had a clear consequence in enhancing young farmers' interest in agricultural issues. The College of Simiatug indeed suffered from an increasing lack of interest from students of agriculture disciplines in favor of technical/computational ones. Our program showed young farmers that both disciplines could be merged and that they could find through the Internet (http://www.innomip.ird.fr) computational tools to increase their knowledge on pest management. Our study is a preliminary approach in the use of ABM for pest management issues. Further efforts should be done to optimize model adoption process such as the early identification of gaps in farmers' knowledge (Wilson 2009), the consideration of peak-labor periods (White 2005) or the social network of learners (Boahene 1999).
- 5.9
- Another achievement of ABM was that, by providing farmers with evidence that pests propagated through their community not as the result of isolated decisions by individuals but rather as the result of repeated interactions between multiple individuals over time, our ABM pointed at key psychological and social issues, highly relevant for efficient management of invasive pests (Peshin 2008). ABM may therefore be a powerful tool to advance the application of social psychology theory by stakeholders in rural communities (Smith 2007) and to change individual attitudes (Jacobson 2006). This suggests that new approaches in pest management extension practices should include topics such as group decision making, intergroup relation, commitment, and persuasion which deal directly with how other farmers influence one's thoughts and actions (Mason 2007; Urbig 2008). By examining group- and population-level consequences on invasion process, agent-based modeling may therefore reveals as a powerful pedagogical approach to change behaviors across large populations, a long lasting issue in pest management outreach programs worldwide (Feder 2004).
Conclusion
- 5.10
- We showed in this study that agent-based modeling may be a powerful tool to simulate invasive pest spread in human dominated landscapes. Our simulations further revealed that both farmers' movements and pest control knowledge could significantly impact invasion speed and should be considered as key variables to better predict pest invasion dynamics in agricultural landscapes. Regarding the use of ABM as educational tools, we found that new technologies (computers) increased the interest of young farmers in learning about how to better face pest problems. Although we would need to design proper studies to better understand the specific ways ABM fosters learning processes, the introduction of ABM into learning environments located in remote places may promise to improve education of farmers, especially young ones. For example, ABM can be integrated into interactive websites or burned on a CD and be available to farmer communities in which technology access increases rapidly thanks to governmental initiatives. In view of the growing threat made by emergent insect pests worldwide, especially in remote and poor localities, further efforts to include cost-efficient ABM into integrated pest management programs may represent a promising line of research and applications.
Appendix 1: Description of the cellular automaton used to simulate the pest using the ODD protocol
- A1.1
- The model description follows the ODD protocol for describing individual- and agent-based models (Polhill et al. 2008; Grimm et al. 2006; Grimm & Railsback 2005b) and cellular automaton (Grimm et al. 2006, appendix A p136-147). Note that in the case of cellular automaton, some of the design concepts of the ODD protocol do not apply. The model was developed using CORMAS (CIRAD, France, http://cormas.cirad.fr) based on the VisualWorks programming environment (CincomSmalltalk, http://www.cincomsmalltalk.com).
OVERVIEW
-
Purpose
- A2.1
- The SimPolilla model was developed to describe the invasion and diffusion of the potato tuber moths (PTM) (Tecia solanivora, Phthorimaea operculella and Symmetrischema tangolias, Gelechiidae, Lepidoptera), tiny moths that invaded the agricultural landscape of the North Andean region in the last decades. The larvae of these moths are serious pests of potatoes, one of the main food crops of the region. A second objective of the model was to make prediction and generate maps of invasion risk for local farmer communities. The model was developed and validated in a pilot region of central Ecuador but was built to be applicable to a much wider geographic range in North Andes.
State variables and scales
- A2.2
- The model is based on biological and ecological rules derived from field and laboratory experimental data for the three PTM species (Dangles & Carpio 2008; Dangles et al. 2008; Roux & Baumgärtner 1997). The Simiatug valley, used as a pilot region to build the model, is located in the province of Bolívar, in the central highlands of Ecuador. We focused on a study area of 40 × 40 km represented by a grid of 6,400 cells with a cell size of 0.25 km2. Each cell i is characterized by its quality of habitat ni i.e. the quantity of food resources available for the moth larvae. We consider that ni was fixed to 0 or 1 depending on the land use (i.e. crops or other uses such as woods or highlands). Each cell is also characterized by a range of temperature values (mean Tmoy i, maximum Tmax i and minimum Tmin i in °C), a monthly amount of precipitation Pi;j (in mm), and a mean elevation αi (m.a.s.l.).
Table 1: Full set of state variables in SimPolilla Name of variable Units Habitat Quality of habitat of cell i ni Temperature Average mean temperature over 30 years per cell i Tmoy i ºC Average minimum temperature over 30 years per cell i Tmin i ºC Average maximum temperature over 30 years per cell i Tmax i ºC Precipitation Average precipitation amount over 30 years per cell i and per month j Pi;j mm Elevation Elevation on the study zone per cell i α i m PTM species Level of infestation of juveniles density of specie k per cell i (k = 1, 2 , 3; T. solanivora, P. operculella, S. tangolias, respectively) Jk;i Number Level of infestation of adults density of specie k per cell i (k = 1, 2 , 3; T. solanivora, P. operculella, S. tangolias, respectively) Ak;i Number Level of infestation of gravid females density of specie k per cell i (k = 1, 2 , 3; T. solanivora, P. operculella, S. tangolias, respectively) Gk;i Number Distance covered by a moth Distance covered by a moth d Meters - A2.3
- The higher-level entities are based on the number of gravid females of the three PTM species. Each time step represents one PTM generation based on T. solanivora life cycle duration (i.e. about 3 months at 15°C). An adjustment is made on the two other species so that each step corresponds to one PTM generation. The 500 × 500 m scale for cells was chosen for fitting the level of precision we have concerning PTM dispersion, based on available knowledge on moth dispersion (Cameron et al. 2002b ). Temperatures, precipitations and elevations have a 1 per 1 km resolution. Inside a square of four cells, these parameters have the same value.
Process overview and scheduling
- A2.4
- In this section, we briefly describe the processes and scheduling of our model. Details are given in the submodels section. Each process is presented according to its sequence proceeding and in the order at which state variables are updated. Each time step is one T. solanivora generation.
Table 2: Processes of SimPolilla model Process Submodels State variables update State variables update Stochastic temperature Stochastic temperature Stochastic rainfall Stochastic rainfall PTM mortality Crude mortality Temperature dependent mortality Precipitation dependent mortality PTM dispersal Neighbourhood dispersal PTM reproduction Mating rate Sex ratio Temperature dependent fecundity Process: state variables update
- A2.5
- Each state variable corresponding to real data (Almanaque Electrónico de Ecuador by Alianza Jatun Sacha - CDC, digitised by DINAREN, 2003 ;Hijmans et al. 2005), is imported from individual files (one per layer), so that SimPolilla may be easily adapted to other regions.
Process: stochastic temperature
- A2.6
- Mean temperature is transformed according to a stochastic factor (Box & Muller 1958).
Process: stochastic rainfall
- A2.7
- Two consecutive monthly precipitations are randomly chosen during a given step.
Process: PTM mortality
- A2.8
- PTM population is updated according to crude, temperature and precipitation mortality.
Process: PTM dispersal
- A2.9
- PTM disperse through the territory from one cell to another by diffusion.
Process: PTM reproduction
- A2.10
- PTM populations are updated according to biological rules (mating rate, sex ratio, fecundity). A correction is made over fitness on the two other PTM species to adjust time step based on T. solanivora life cycle.
DESIGN CONCEPTS
- A3.1
- In Simpolilla model, moths' implicit objective is to infest the considered landscape by maximizing dispersal speed. Emergent key results are level of infestation in each cell and infestation speed. Interspecific interactions are not taken into account in this model and a stochastic factor over temperature and rainfalls are included mimic actual climatic variation.
DETAILS
-
Initialization and input
- A4.1
- The environment is based on the Simiatug agricultural region (Bolivar, central part of Ecuadorian Andes), with temperature, precipitation and elevation from available data with a 1 km2 resolution (Hijmans et al. 2005). Quality of habitat is based on GIS information about land use with a 0.25 km2 resolution (Almanaque Electrónico de Ecuador by Alianza Jatun Sacha - CDC, digitised by DINAREN, 2003). The cellular automaton is a 4-connex square shaped grid, with closed boundaries as we are considering an existing geographical location. At the beginning of each simulation, PTM inoculums are placed in the Simiatug village and spread is observed and recorded for each species.
Submodels
- A4.2
- In this section we describe the submodels given in table 2.
Climatic driver of PTM dynamic
Temperature
- A4.3
- In order to feed the model with real climate variables, we chose to introduce a stochastic factor Tstochastic in the model (see alsoSikder et al. 2006) that allowed us to obtain by multiplication a stochastic temperature in cell i TSto i.
- A4.4
- We use the polar form of the Box-Muller transformation (Box & Muller 1958), to generate a Gaussian random number, based on climatic data from the region (seeDangles et al. 2008, appendix A). Random number used is based on random procedure in VisualWoks (VisualWorks® NonCommercial, 7.5 of April 16, 2007. Copyright © 1999-2007 Cincom Systems, Inc. All Rights Reserved.).
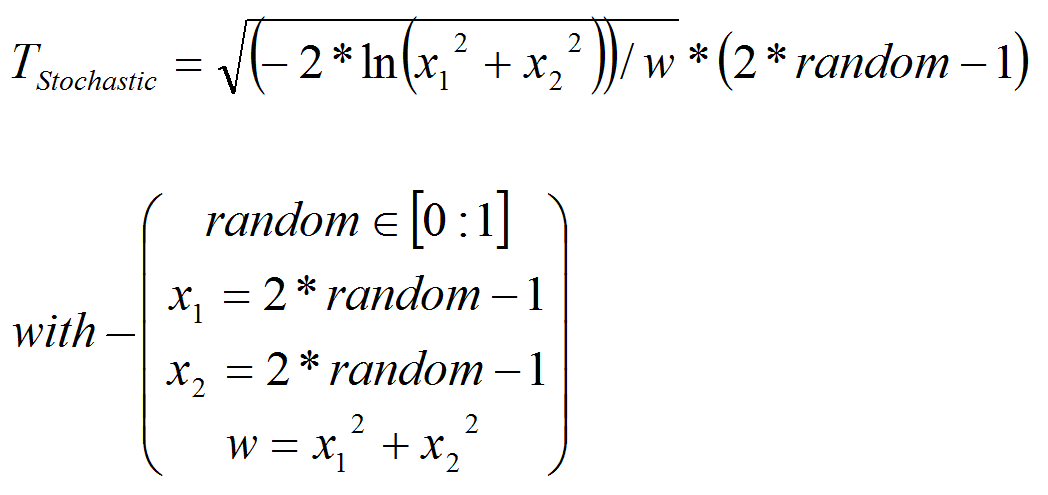
(1) The stochastic temperature replaces average temperature in all equations bellow.
Precipitation
- A4.5
- As for temperature, we choose to introduce a stochastic factor to obtain a stochastic precipitation PStoi. Using a random number j from 1 to 12 (VisualWorks® NonCommercial, 7.5 of April 16, 2007. Copyright © 1999-2007 Cincom Systems, Inc. All Rights Reserved.), we take the average of the monthly amount of precipitation Pi;j corresponding to the random number and the following.
(2) PTM life dynamics
- A4.6
- Data on development and survival for immature stages (eggs, larva, and pupa) and on fecundity for adults were acquired from two sources. First we used published data from laboratory experiments performed in the Andean region (Notz et al 1995;Dangles et al. 2008). Second we used data obtained within the last 8 years at the Entomology Laboratory at the PUCE (Pollet, Barragan & Padilla, unpublished data). For these two sources, only data acquired under constant temperatures (± 2°C) were considered. In all studies, relative humidity ranged from 60 to 90%, values above any physiological stress.
Crude mortality
- A4.7
- Overall force of mortality among a population is the sum of crude cause-specific forces. Here we consider innate mortality (λi), dispersal related mortality (λd) and predation (λe) (seeRoux 1993;Roux et al. 1997) for P. operculella.
(3) - A4.8
- Innate mortality is not taken into account using equation (3), because a temperature dependent parameter fits better to reality than λi (see bellow).
- A4.9
- We are also considering separately survival rate with predation SPredation by birds, spiders, ants and others predators for the adult stage following equation (4) (Tanhuanpää et al. 2003). Level of predation _i scales from 0 to 10 (ie 10 the lower, 0 the higher level), in order to simulate different scenarios, from theory to reality.
(4) Temperature dependent mortality
- A4.10
- Temperature is the most basic controller in poikilothermic organisms (Zaslavski et al. 1988). Survival rate under laboratories conditions has been studied for the three PTM species, using a temperature dependent kinetic model.
- A4.11
- We used the following equation to calculate the survival rate SD for each stage at each temperature for which data were available:
(5) with ST the total survival at the given stage, expressed as a proportion, and DD the days to development. Following Roux (1993), we applied the Sharpe and DeMichel model (eq. 5) to the survival-response to temperature as in equation 6:
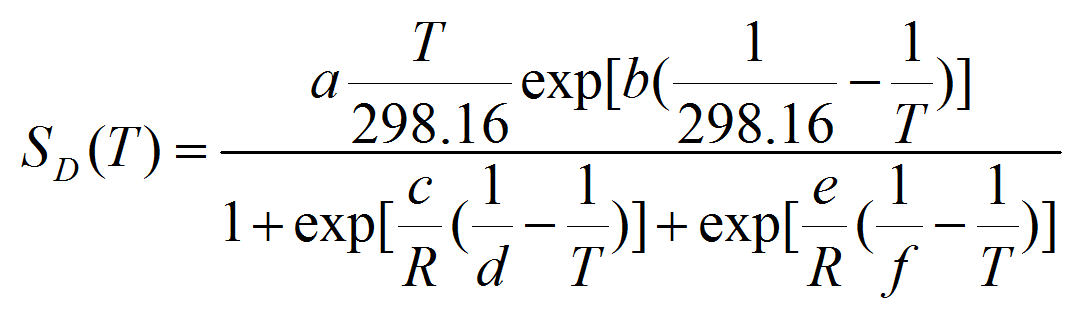
(6) with a, b, c, d, e, and f the equation parameters to be estimated.
Table 3: Parameter values of the kinetic model (equation 7) describing the stage specific survival rate SD(T) response of the three invasive PTM species (T. solanivora, P. operculella, and S. tangolias) to constant temperatures. Note that temperature is given in Kelvin degrees. Species Instar a b c d e f S. tangolias Egg 0,834 10,94 -234000 282,4 616600 304,1 Larva 0,694 -236,3 -420300 283.1 1551000 305,6 Pupa 0,882 39,93 -992700 282,9 1110000 304,7 P. operculella Egg 0,917 50 -200000 283.3 400000 310.1 Larva 0,950 -150 -400000 284.4 900000 310.0 Pupa 0,960 50 -800000 283.1 700000 312.2 T. solanivora Egg 0,822 -758,5 -212100 281,9 405200 303,8 Larva 0,758 -180,2 -475700 282,7 1298000 301,5 Pupa 0,900 -73,72 -1263000 286,5 1095000 306,3 - A4.12
- For temperatures higher than 13°C, P. operculella immature stages showed higher survival rates (0.9-1.0) and tolerance to high temperatures (up to 37°C) than the two other species. Both T. solanivora and S. tangolias had a slightly better tolerance to low temperatures than P. operculella.
Precipitation dependent mortality
- A4.13
- Precipitations play a minor but significant role in moth survival rate (Wakisaka et al. 1989;Kobori et al. 2003). Because each insect stage is concerned and because no studies have been conduced on PTM, we use a correcting factor on survival rate. This rate is dependent on the amount of precipitations in mm over two months randomly chosen on the GIS database (SICAGRO). The correcting factor is adjusted from hypothetical relationship based upon available knowledge.
Neighborhood dispersal
- A4.14
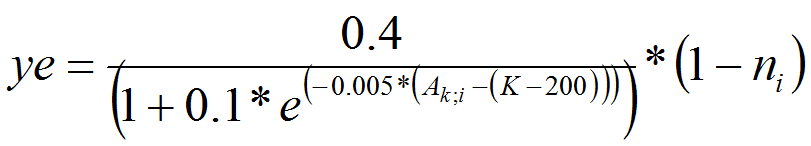
- We consider that the fraction of PTM leaving a cell is dependent on adult population density and quality of habitat ni within the cell (see alsoBendor et al. 2006;Bendor and Metcalf 2006b;Eizaguirre et al. 2004). PTM do not have a perception of the environment situated in a neighborhood cell. According to Bendor et al., we assume that emigration rate (ye), follows an s-shaped curve, which levels out as it approaches the maximum density (carrying capacity). Density is a fraction of K, carrying capacity (0 < density < K).
(7) - A4.15
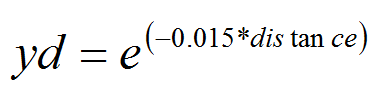
- We assumed that PTM can travel up to 200 m away from their origin during a generation (larvae can hardly move to 1m and adults' life time is very short). The probability of a PTM to cover a defined distance (yd) is a decreasing function of emigration rate. This function may certainly overestimate PTM dispersal but we prefer overestimation than below estimation (Cameron et al. 2002a; 2002b).
(8) - A4.16
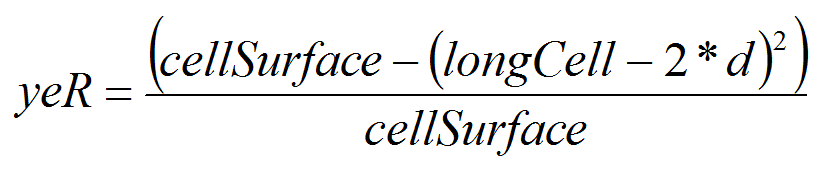
- As our unit cell is 0.25 km2, each migrating PTM, depending on its position on the square, and on distance covered d, has a probability (yeR) of crossing the cell boarder. We assume that PTM move inside the cell either horizontally or vertically. This assumption may certainly overestimate PTM dispersal but we prefer overestimation than below estimation (Cameron et al. 2002a; 2002b).
(9) Reproduction
Mating rate
- A4.17
- Mating rate is correlated with age, sex ratio and weigh of individuals, but also with distance from one individual to another (Makee et al. 2001;Cameron et al. 2004). No specific studies have been made on mating rate under natural conditions, and laboratory measurements may frequently represent an overestimation of the natural situation because laboratory females have little opportunity to avoid mating (Reinhardt et al. 2007). However, as our cells are 500 m long, and thanks to field observation, we know that pheromones works at least on a 200 m radius, and we assume that within a cell, mating rate is equal to one no matter the density.
Sex ratio
- A4.18
- Among PTM population, sex ratio has been studied and is 1:1 (Saour 1999). After dispersal, the remaining adult population, combined with the mating rate and the sex ratio give the gravid females population.
PTM fecundity
- A4.19
- Although energy-partitioning models have been developed to explain the shape of insect fecundity as a function of aging (Kindlmann et al. 2001), we are not aware of any mechanistic models that describes insect fecundity as a function of temperature. Several probabilistic non-linear models to fit insect fecundity across temperature have been proposed in the literature (Roux 1993; Lactin et al. 1995; Kim and Lee 2003; Bonato et al. 2007), but none of them gave us significant results with our data (r < 0.35, Fstat < 2.01). We therefore used weighted least square (WLS) regression to find the best model that fits our fecundity data across temperature. WLS regression is particularly efficient to handle regression situations in which the data points are of varying quality, i.e. the standard deviation of the random errors in the data may be not constant across all levels of the explanatory variables, which could be the case. For the three tuber moth species, the best fit was obtained with the Weibull distribution function, which has long been recognized as useful function to model insect development (Wagner et al. 1984).
- A4.20
- The effect of temperature upon fecundity was well described by the Weibull distribution functions (r2 = 0.75, 0.83, and 0.91 for T. solanivora, S. tangolias and P. operculella, respectively). Results showed marked differences among PTM species, both in terms of total numbers of eggs laid per females and optimal fecundity temperature : the highest fecundity was found in T. solanivora, with about 300 eggs/female at 19°C, followed by S. tangolias (220 eggs/female at 15°C) and P. operculella (140 eggs at 23°C).
Appendix 2: Animations
- A5.1
- The following animations illustrate simulations in which blue and red figurines represents agents, and blue and red links agents' movements from village to village. The number in the top right corner corresponds to the number of timeframe and the background color to the pest infestation (black: no pest infestation ; green: pest infestation due to purely biological diffusion ; red and blue: pest infestation due to an infested agent movement). At the end of each animated simulation, the area to the right remains uninfected. This area corresponds to higher elevations where the pest can not survive.
Figure A-2. Animated simulations showing the effect of agents' movements on the pest spread with 2 movements per timeframe and 6 movements per timeframe. The pest infestation is quicker when agents move more. 
Figure A-3. Simulations showing the effect of agents' pest control knowledge without heterogeneity on the pest spread with a mean pest control knowledge of 0 and 100. When the pest control knowledge is high, the pest can only disperse through diffusion (i.e. very slowly), compared to a simulation when pest control knowledge is low, where the agents' behaviors lead to a full infestation by long distance dispersal events from village to village. 
Figure A-4. Animated simulation of the game session. Parameters are presented in Table 1. The simulation ran to reach full infestation of the landscape suitable for the pest. Integrating real distribution of pest control knowledge (Normal distribution), we observed that almost all the landscape is infested due to long distance dispersal events. It revealed the importance to focus on pest control knowledge reinforcement to reduce the incidence of the pest at the landscape level.
Acknowledgements
- We thank two anonymous reviewers for their helpful comments on a previous version of this work. We are grateful to Claire Nicklin, from the McKnight Foundation, for the linguistic revision of the manuscript. We also thank Carlos Carpio and Mario Hererra for their technical support and all farmers involved in this process. This study was part of the research conducted within the project Innovative Approaches for integrated Pest Management in changing Andes (C09-031) funded by the McKnight Foundation. VCP received the financial support of the Direction Soutien et Formation of the IRD through a Ph.D. grant (2009-2011).
References
-
ALTIZER, S, Dobson, A, Hosseini, P et al (2006). Seasonality and the dynamics of infectious diseases. Ecology Letters : 9:467-84. [doi:10.1111/j.1461-0248.2005.00879.x]
ANDERSON, RM and May, RM (1992). Infectious diseases in humans Oxford University Press, Oxford.
BAGNI, R, Berchi, R and Cariello, P (2002). A comparison of simulation models applied to epidemics. Journal of Artificial Societies and Social Simulation 5 (3) 5 https://www.jasss.org/5/3/5.html.
BAUER, AL, Beauchemin, CAA and Perelson, AS (2009). Agent-based modeling of host-pathogen systems: The successes and challenges. Information Sciences 179: 1379-1389. [doi:10.1016/j.ins.2008.11.012]
BENDOR T.K, Metcalf S.S., Fontenot L.E., Sangunett B. and Hannon B. (2006) Modeling the spread of the Emerald Ash Borer. Ecological modelling 4328. [doi:10.1016/j.ecolmodel.2006.03.003]
BENDOR T.K., Metcalf S.S. (2006) The spatial dynamics of invasive species spread. System Dynamics Review 22 (1) 27-50. [doi:10.1002/sdr.328]
BERGER, T. (2001). Agent-based spatial models applied to agriculture: a simulation tool for technology diffusion, resource use changes and policy analysis. Agricultural Economics 25 245-260. [doi:10.1111/j.1574-0862.2001.tb00205.x]
BOAHENE, K. and Snijders, T.A.B. (1999). An Integrated Socioeconomic Analysis of Innovation Adoption: The Case of Hybrid Cocoa in Ghana. Journal of Policy Modeling 21, 167-184. [doi:10.1016/S0161-8938(97)00070-7]
BONABEAU, E, (2002). Agent-based modeling: methods and techniques for simulating human systems, Proc Natl Acad Sci 99: 7280-7. [doi:10.1073/pnas.082080899]
BONATO O, Lurette A, Vidal C, Fargues J (2007) Modelling temperature-dependant bionomics of Bemisia tabaci (Q-biotype). Physiol Entomol 32:50-55 [doi:10.1111/j.1365-3032.2006.00540.x]
BOSSENBROEK, JM, Kraft, CE and Nekola, JC (2001). Prediction of long-distance dispersal using gravity models: Zebra mussel invasion of inland lakes. Ecological Applications 11: 1778-88. [doi:10.1890/1051-0761(2001)011[1778:POLDDU]2.0.CO;2]
BOX, G.E.P, M.E. Muller (1958). A note on the generation of random normal deviates, Annals Math. Stat, V. 29:610-1. [doi:10.1214/aoms/1177706645]
CAMERON P.J., Walker, G. P.; Penny, G. M.; Wigley, P. J (2002a). Movement of Potato Tuberworm (Lepidoptera: Gelechiidae) within and Between Crops, and Some Comparisons with Diamondback Moth (Lepidoptera: Plutellidae). Environ. Entomol. 31(1): 65-75. [doi:10.1603/0046-225X-31.1.65]
CAMERON P.J., Walker, G. P.; Penny, G. M.; Wigley, P. J (2002b). Movement of potato moth estimated by mark recapture experiments. 55th Conference Proceedings of The New Zealand Plant Protection Society Incorporated.
CAMERON P. J., A. R. Wallace, V. V. Madhusudhan, P. J. Wigley, M. S. Qureshi & G. P. Walker, (2004). Mating frequency in dispersing potato tuber moth, Phthorimaea operculella, and its influence on the design of refugia to manage resistance in Bt transgenic crops. Entomologia Experimentalis et Applicata, 115(2) 323-32. [doi:10.1111/j.1570-7458.2005.00256.x]
CRESPO-PEREZ, V., Rebaudo, F., Silvain, J.F., and Dangles, O. (submitted). Modeling invasive species spread in complex landscapes: the case of potato moth in Ecuador. Submitted to Landscape Ecology. [doi:10.1007/s10980-011-9649-4]
DANGLES, O. & Carpio, F. C., (2008). Cuando los científicos y las comunidades andinas unen sus esfuerzos para luchar en contra de una plaga invasora. Nuestra Ciencia 10: 23-25
DANGLES, O., Carpio, C., Barragan, A.R., Zeddam, J.L. and Silvain, J.F. (2008). Temperature as a key driver of ecological sorting among invasive pest species in the tropical Andes. Ecological Applications 18: 1795-1809. [doi:10.1890/07-1638.1]
DANGLES, O., Carpio, F.C., Villares, M., Yumisaca, F., Liger, B., Rebaudo, F. and Silvain, J.F. (2010). Community-based participatory research helps farmers and scientists to manage invasive pests in the Ecuadorian Andes. Ambio: A Journal of the Human Environment, 39: 325-335.
EIZAGUIRRE M, López C. and Albajes R. (2004). Dispersal capacity in the Mediterranean corn borer, Sesamia nonagrioides. Entomologia Experimentalis et Applicata 113: 25-34. [doi:10.1111/j.0013-8703.2004.00201.x]
EPANCHIN-NIELL, R.S., Hufford, M.B., Aslan, C.E., Sexton, J.P., Port, J.D. and Waring, T.M. (2010). Controlling invasive species in complex social landscapes. Front Ecol Environ 8: 210-216. [doi:10.1890/090029]
EUBANK, S., Guclu, H., Kumar, V.S.A., Marathe, M.V., Srinivasan, A., Toroczkai, Z. and Wang, N. (2004). Modelling disease outbreaks in realistic urban social networks. Nature 429:180-184. [doi:10.1038/nature02541]
FEDER, G., Murgai, R., and Quizon, J. (2004). The acquisition and diffusion of knowledge: The case of pest management training in farmer field schools, Indonesia. Journal of Agricultural Economics 55: 217-239.
GONG, X. and Renbin, X. (2007). Research on Multi-Agent Simulation of Epidemic News Spread Characteristics. Journal of Artificial Societies and Social Simulation 10 (3) 1 https://www.jasss.org/10/3/1.html.
GRIMM, V. et al. (2005a). Pattern-oriented modeling of agent-based complex systems: lessons from ecology. Science 310: 987-991. [doi:10.1126/science.1116681]
GRIMM V. and Railsback S. F. (2005b). Individual-based Modeling and Ecology. Princeton University Press, Princeton, NJ. [doi:10.1515/9781400850624]
GRIMM V., Berger U., Bastiansen F., Eliassen S., Ginot V., Giske J., Goss-Custard J., Grand T., Heinz S. K., Huse G., Huth A., Jepsen J. U., Jørgensen C., Mooij W. M., Müller B., Pe'er G., Piou C., Railsback S. F., Robbins A. M., Robbins M. M., Rossmanith E., Rüger N., Strand E., Souissi S., Stillman R. A., Vabø R., Visser U. and DeAngelis D. L. (2006). A standard protocol for describing individual-based and agent-based models. Ecological Modelling 198 (1-2), 115-126. [doi:10.1016/j.ecolmodel.2006.04.023]
HIJMANS R.J., Cameron S.E., Parra J.L., Jones P.G. and Jarvis A. (2005). Very High Resolution Interpolated Climate Surfaces For Global Land Areas, Int. J. Climatol. 25: 1965-78 [doi:10.1002/joc.1276]
ITAKURA, J, Kurosaki, M, Itakuraa, Y, Maekawab, S, Asahinaa, Y, Izumi, N and Enomoto N (2010). Reproducibility and usability of chronic virus infection model using agent-based simulation; comparing with a mathematical model. Biosystems 99: 70-78. [doi:10.1016/j.biosystems.2009.09.001]
JACOBSON, SK, McDuff, MDD and Monroe, MC (2006). Conservation education and outreach techniques. New York: Oxford University Press. [doi:10.1093/acprof:oso/9780198567714.001.0001]
KIM, D-S. and J-H. Lee. (2003). Oviposition model of overwintered adult Tetranychus urticae (Acarina: Tetranychidae) and mite phenology on the ground cover in apple orchards. Exp. Appl. Acarol. 31: 191-208. [doi:10.1023/B:APPA.0000010385.00864.28]
KINDLMANN, P., A.F.G. Dixon, and I. Dostálková. (2001). Role of ageing 1091 and temperature in shaping reaction norms and fecundity functions in insects. Journal of Evolutionary Biology 14: 835-840. [doi:10.1046/j.1420-9101.2001.00323.x]
KOBORI Y, Amano H, (2003). Effect of rainfall on a population of the diamondback moth, Plutella xylostella (Lepidoptera: Plutellidae). Appl. Entomol. Zool. 38 (2): 249-253. [doi:10.1303/aez.2003.249]
LACTIN, D. J., N. J. Holliday, D. L. Johnson, and R. Craigen. (1995). Improved rate model of temperature-dependent development by arthropods. Environ. Entomol 13:868-72. [doi:10.1093/ee/24.1.68]
LIEBHOLD, AM and Tobin, PC (2008). Population ecology of insect invasions and their management. Annual Review of Entomology, 53: 387-408. [doi:10.1146/annurev.ento.52.110405.091401]
LIU, J et al. (2007). Complexity of Coupled Human and Natural Systems. Science 317: 1513-1516. [doi:10.1126/science.1144004]
LUO, M, Opaluch J.J. (2010). Analyze the risks of biological invasion: An agent based simulation model for introducing non-native oysters in Chesapeake Bay, USA. Stoch Environ Res Risk Assess, 25(3) 377-388. [doi:10.1007/s00477-010-0375-2]
MAKEE H., et Saour G. (2001). Factors Influencing Mating Success, Mating Frequency, and Fecundity in Phthorimaea operculella (Lepidoptera: Gelechiidae). Environ. Entomol. 30(1): 31-36. [doi:10.1603/0046-225X-30.1.31]
MASON, WA, Conrey, FR, and Smith, ER (2007). Situating social influence processes: Dynamic, multidirectional flows of influence within social networks. Personality and Social Psychology Review, 11(3), 279-300. [doi:10.1177/1088868307301032]
MORENO, Y, Pastor-Satorras, R and Vespignani A (2002). Epidemic outbreaks in complex heterogeneous networks, Eur. Phys. J. B 26: 521-529. [doi:10.1140/epjb/e20020122]
NEWMAN, M.E.J. (2002). Spread of epidemic disease on networks, Phys. Rev. E 66(1) 016128-1 :11.
NOTZ, A. (1995) Influencia de la temperatura sobre la 1138 biología de Tecia solanivora (Povolny) criadas en tubérculos de papa Solanum tuberosum L. Boletín Entomológico Venezolano 11:49-54.
PAPAJORGJI, PJ and Pardalos PM (2009). Advances in Modeling Agricultural Systems, Springer Publishing Company, NY.
PESHIN, R and Dhawan, AK (2008). Integrated pest management: dissemination and impact, Springer
PITT, JPW, Worner, SP and Suarez, AV (2009). Predicting Argentine ant spread over the heterogeneous landscape using a spatially explicit stochastic model. Ecological Applications 19: 1176-1186. [doi:10.1890/08-1777.1]
POLHILL J.G, Parker D, Brown D and Grimm V (2008). Using the ODD Protocol for Describing Three Agent-Based Social Simulation Models of Land-Use Change. Journal of Artificial Societies and Social Simulation 11 (2) 3 https://www.jasss.org/11/2/3.html
PUILLANDRE, N, Dupas, S, Dangles, O, Zeddam, JL, Capdevielle-Dulac, C, Barbin, K, Torres-Leguizamon, M and Silvain, JF (2008). Genetic bottleneck in invasive species: the potato tuber moth adds to the list. Biological Invasions 10: 319-333. [doi:10.1007/s10530-007-9132-y]
REINHARDT K., Köhler G., Webb S., and Child D. (2007). Field mating rate of female meadow grasshoppers, Chorthippus parallelus, estimated from sperm counts. Ecological Entomology, 32(6) 637-642. [doi:10.1111/j.1365-2311.2007.00923.x]
RODRIGUE, JP, Comtois, C and Slack, B (2009). The Geography of Transport Systems. Routledge
ROUX O. (1993). Population ecology of potatoes tuber moth Phthorimaea operculella (Zeller) (Lepidoptera: Gelechiidae) and design of an integrated pest management program in Tunisia. Thesis ETH No 10120, Zurich.
ROUX O, Baumgärtner J, (1997). Evaluation of mortality factors and risk analysis for the design of an integrated pest management system. Ecological modeling 109: 61-75.
SAOUR G. (1999). Susceptibility of potato plants grown from tubers irradiated with stimulation doses of gamma irradiation to potato tuber moth, Phthorimaea operculella Zeller (Lep., Gelechiidae). Journal of Applied Entomology, 23(3) 159-164. [doi:10.1046/j.1439-0418.1999.00335.x]
SIKDER I.U. Sikder, Mal-Sarkar S, Mal T.K. (2006). Knowledge-Based Risk Assessment Under Uncertainty for Species Invasion. Risk Analysis 26(1) 239-252. [doi:10.1111/j.1539-6924.2006.00714.x]
TANHUANPÄÄ M, Ruohomaki, K., Kaitaniemi, P. (2003) Influence of adult and egg predation on the reproductive success of Epirrita autumnata (Lepidoptera: Geometridae). Oikos 102: 263-272. [doi:10.1034/j.1600-0706.2003.12546.x]
SMITH, ER and Conrey, FR (2007). Agent-based modeling: A new approach for theory-building in social psychology. Personality and Social Psychology Review, 11: 87-104. [doi:10.1177/1088868306294789]
SUAREZ, AV, Holway, DA and Case, TJ (2001). Patterns of spread in biological invasions dominated by long-distance jump dispersal: Insights from Argentine ants. Proc Natl Acad Sci , 98: 1095-1100. [doi:10.1073/pnas.98.3.1095]
TEWELDEMEDHIN, E, Marwala, T and Mueller, C (2004). Agent-based modelling: a case study in HIV epidemic. Proceedings of the 4th International Conference on Hybrid Intelligent Systems (HIS'04); Washington, DC, USA. IEEE Computer Society. pp. 154-159. [doi:10.1109/ICHIS.2004.16]
URBIG, D, Lorenz, J and Herzberg, H (2008). Opinion Dynamics: the Effect of the Number of Peers Met at Once. Journal of Artificial Societies and Social Simulation 11 (2) 4 https://www.jasss.org/11/2/4.html.
VINATIER, F, Tixier, P, Le Page, C, Duyck, PF and Lescourret, F (2009). COSMOS, a spatially explicit model to simulate the epidemiology of Cosmopolites sordidus in banana fields. Ecological Modelling 220: 2244-2254. [doi:10.1016/j.ecolmodel.2009.06.023]
WAGNER T.L., Wu H., Sharpe P.J.H., Schoolfield R.M., Coulson R.N. (1984). Modeling Insect Development Rates: a Literature Review and Application of a Biophysical Model. Ann. Entomol. Soc. Amer. 77: 208-225. [doi:10.1093/aesa/77.2.208]
WAKISAKA S., Tsukuda R and Nakasuji F (1989). Effects of Natural Enemies, Rainfall, Temperature, Host Plants on Survival and Reproduction of Diamondback Moth. Otsuka Chemical Co., Ltd., Naruto Research Center, Naruto Tokushima 772, Japan and Laboratory of Applied Entomology, Faculty of Agriculture, Okayama University, Tsushimanaka, Okayama 700, Japan.
WHITE, DS, Labarta, RA and Leguia, EJ (2005). Technology adoption by resource-poor farmers: considering the implications of peak-season labour costs. Agricultural Systems 85: 183-201. [doi:10.1016/j.agsy.2004.07.018]
WILENSKY, U (1999). NetLogo. http://ccl.northwestern.edu/netlogo. Center for Connected Learning and Computer-Based Modeling. Northwestern University, Evanston, IL.
WILSON, RS and Hooker, N (2009). Targeting the farmer decision making process: A pathway to increased adoption of integrated weed management. Crop Protection 28: 756-764. [doi:10.1016/j.cropro.2009.05.013]
XUAN, H, Xu, L and Li, L (2009). A CA-based epidemic model for HIV/AIDS transmission with heterogeneity. Annals of Operation Research 168: 81-99. [doi:10.1007/s10479-008-0369-3]
YU, B, Wang, J, McGowan, M, Vaidyanathan, G and Younger, K (2010). Gryphon: A Hybrid Agent-Based Modeling and Simulation Platform for Infectious Diseases. Advances in Social Computing 6007/2010: 199-207.
ZASLAVSKI V. A. (1988) Insect development: photoperiodic and temperature control. Springer, Berlin.