
 Abstract
- We here present a model of the dynamics of extremism based on opinion dynamics in order to understand the circumstances which favour its emergence and development in large fractions of the general public. Our model is based on the bounded confidence hypothesis and on the evolution of initially anti-conformist agents to extreme positions. Numerical analyses demonstrate that a few extremists are able to drag a large fraction of conformists agents to their position provided that they express theirs views more often than the conformists. The most influential parameter controlling the outcome of the dynamics is the uncertainty of the conformist agents; the higher their uncertainty, the higher is the influence of anti-conformists. Systematic scans of the parameter space show the existence of two regime transitions, one following the conformists uncertainty parameter and the other one following the anti-conformism strength.
- Keywords:
- Extremism, Opinion Dynamics, Bounded Confidence, Clustering, Anti-Conformism
Introduction
- 1.1
- The present paper discusses the dynamics of extremism in a democratic setting. A probably over-optimistic view of democracy is that when opinions are openly expressed, some consensus opinion would emerge and citizens would vote in favour of a government whose actions would be in accordance with the views of a large majority of citizens. This utopia is shared by many writers, but History has consistently shown us that National Consensus was a dream, that could eventually occur at war time, not such a wishful situation.
- 1.2
- At least one would expect that the elected government would be close enough to a centrist position satisfying the largest proportion of citizens, as the ice cream seller choosing to put his stand near the middle of a linear beach (Hotelling 1990).
- 1.3
- Once again, History since the Eighteenth century
Enlightenment period in Western Europe contradicts these simple views
and we are not observing a smooth evolution towards more consensus nor
towards the success of centrists parties. We rather observed
alternation between regimes of dominance of centrists political parties
and regimes of strong ideological fights between more extremist
parties, eventually leading to de facto dictatorship, according to time
periods and world regions. The present paper is an essay to model
possible evolutions of public opinions leading to different opinion
aggregation landscape forming the basis of political entities
corresponding to parties. We here develop a model of opinion dynamics
in order to answer such questions as:
- How come rational[1] people choose extremism?
- How does an initial low proportion of anti-conformist influences/(or does not), a large fraction of the general population to aggregate in powerful extremist clusters?
- What characterises political clusters in terms of the number of agents in the cluster and their distance to a middle opinion? More precisely what are the regions in the parameter space of the model which would lead the different outcome of the dynamics?
- 1.4
- The simulations presented in this paper are based on opinion dynamics: agents exchange their views on the occasion of encounters, and they might update their opinion as a result of these exchanges. We are well aware that opinion formation in politics involves many other processes than encounters and discussions among individuals: media, political parties, the government and other political institutions are involved as well. For the sake of clarity, we postpone the discussion of the robustness of our results with respect to these other factors to the last section of the paper.
- 1.5
- The earliest models of opinion dynamics were binary opinions models, where opinions could take only two discrete values, e.g. -1 and +1 in the so-called voters models as described in Holley and Liggett (1975), Galam et al. (1982) and summarised in Castellano et al. (2009).
- 1.6
- We here present a model based on continuous opinions, more adapted to the discussion of the assets and liabilities of political choices among agents, and to the traditional right/left axis of political analysts, than binary opinions. It is inspired from two approaches, the bounded confidence model of Deffuant et al. (2000) and the anti-conformism model of Smaldino and Epstein (2015). Since these two models are used as building blocks of our model, we will first summarise their main aspects.
- 1.7
- The rest of the paper is then divided into 3 sections.
- 1.8
- Section 2: Short reminders of the previous models: Deffuant et al. (2000) bounded confidence model including its application to extremism and Smaldino and Epstein (2015) model of anti-conformism.
- 1.9
- Section 3: Our synthetic model is developed and its results presented.
- 1.10
- Section 4: Conclusions and discussion.
- 1.11
- Disclaimer
- 1.12
- The present paper should not be interpreted as normative: we rather try to describe the evolution of opinions and political choices. One can certainly give examples such as Civil Rights in general, when initially considered extremist opinions were later largely accepted by the public. And other cases in which the consequences of extremism turned out to be dramatic.
Essentials of former
models
- 2.1
- In order to achieve consistency in notations and
hypotheses, we use our own notation throughout the paper, which
sometimes differ from those of Deffuant et al. (2000) and Smaldino and Epstein (2015) and make appropriate scale
changes.
Bounded confidence
- 2.2
- The bounded confidence model is based on a major cognitive bias, the confirmation bias (Plous 1993): we are mostly influenced by opinions close to ours and tend to reject opinions too far away. The mathematical model was independently introduced by Deffuant et al. (2000) and by Hegselmann and Krause (2002). It follows the spirit of Axelrod's earlier model of dissemination of cultures. In Axelrod (1997) model, cultures are described by strings of integers. Pairs of agents interact if their cultures are already close enough, in which case one of them adjusts one feature of its culture string to match that of the other agent's culture.
- 2.3
- In bounded confidence models, opinions are represented by real numbers. When opinion differences are lower than a confidence threshold, agents adjust their opinion by decreasing such difference. In Deffuant et al. model, pairs of agents are randomly chosen in the population of agents and they eventually adjust their opinion if the confidence condition is met. Another pair is randomly chosen, and so on. Such an iteration mode is called random sequential.
- 2.4
- By contrast Hegselmann and Krause (2002) apply the same opinion updating equation but they use parallel iteration: all opinions are updated simultaneously. Their choice is well adapted to discussions in committees for instance.
- 2.5
- We will consistently use random sequential iteration in
this paper.
Deffuant et al. bounded confidence model
- 2.6
- Deffuant et al. (2000) bounded confidence model was introduced to model situations in which actors have to take decisions involving cost/benefit analysis in terms of money. Such was the case when the Common Agricultural Policy was modified in 1992: farmers were proposed to change their former practices in favour of more environment friendly practices, e.g. by reducing fertilisers and pesticides use, in exchange for financial aid. But optimising new practices involved a lot of financial uncertainties and surveys demonstrated that farmers would have many social interactions discussing the pros and the cons of the environmental contracts before taking any decision.
- 2.7
- Deffuant et al. (2000) model can be simply described:
- 2.8
- Opinions are represented by a continuous variable x.
- 2.9
- Two randomly chosen agents with opinions x and x' interact if,
and only if, | x -
x'| < u.
Opinions are updated according to:
x = x + μ·(x' - x) x' = x' + μ·(x - x') (1)
u represents the uncertainty of the agents, and μ, taken between 0 and 0.5, is a kinetic parameter. If the two initial opinions are close enough, the two agents interact and their opinions move closer. Otherwise, no opinion change occurs2.
Figure 1. Agents with initial positions x and x' move there opinion closer to each other opinion. The threshold for actual interaction u is interpreted as a confidence or uncertainty parameter. 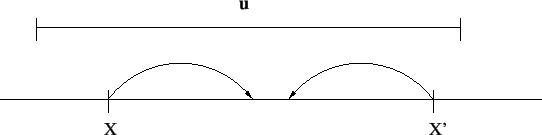
Simulations
- 2.10
- An initial distribution of agents opinions is first randomly established. To achieve maximum randomness most authors choose a uniform distribution on a segment. The first model of Deffuant used [0,1] as initial segment. Later most authors used [-1,1] as initial segment which we do in this paper for the sake of comparison.
- 2.11
- At each time step, a random pair of agents is chosen, to which the above described updating algorithm is applied.
- 2.12
- Simulations are stopped after convergence of opinions into
one or several clusters.
Results
- 2.13
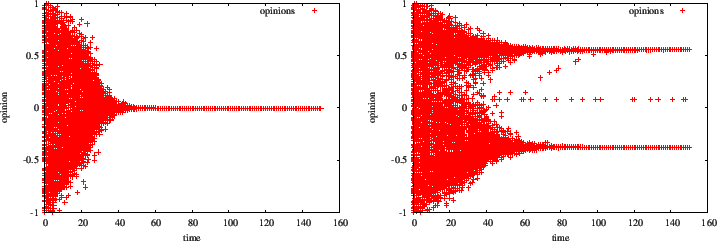
- Opinions vs time plots, figure 2, represent opinion
dynamics. Each point on the graph represents the opinion of an
individual agent along the y axis at time t on the horizontal axis when
the agent is tested for opinion change. The time unit for all plots
corresponds to 1000 pair updatings (on average each agent is tested
twice per time unit). Individual dots might hardly be distinguished on
these plots, but the envelope of the clouds gives an indication of the
gradual convergence of opinions in the course of time.
- 2.14
- These two plots compare the evolution of opinions until convergence. The number of agents is 1000, μ = 0.1, initial opinion uniformly and randomly chosen on segment [-1,1]. Uncertainty u is 0.6 for the left plot and 0.4 for the right plot. Time 150 correspond to sampling 150 pairs, so each agent has been sampled for updating 300 times on average.
- 2.15
- Deffuant et al. (2000) have shown that agents uncertainty u is the main determinant of the outcome of the dynamics.
- 2.16
- Their most relevant results to our analysis are: Asymptotic
opinions are clustered in n = int(
 )
clusters which do not interact any more after a long enough time (int stands for
integer part). The clusters are of equal size and are at least 2u apart.
)
clusters which do not interact any more after a long enough time (int stands for
integer part). The clusters are of equal size and are at least 2u apart.
- 2.17
- We will further refer to the above statements as the n = int()
rule. The general expression for an initial distribution of opinions on
a segment of width w
is n = int(
 ).
).
Deffuant et al. model of extremism
- 2.18
- Deffuant et al. (2002) later proposed of model of extremism prevalence inspired from the bounded confidence model. Their extremism model bears certain differences with the bounded confidence model, the most relevant for us is the introduction of a small fraction of extremists in the agent population. Extremists are different from the other agents by having a very low uncertainty and by having extreme opinions at the end of the spectrum [- 1, 1]. Deffuant et al. (2002) also added a dynamics on uncertainty: agents not only exchange opinions but also uncertainty u.
- 2.19
- The main issue in Deffuant et al. (2002) is whether the small fraction of extremists is able to drag towards extremism the normal (centrist) agents with initially larger uncertainty and extended distribution of opinions.
- 2.20
- The initial fraction of extremists plays some role in the
outcome of the dynamics, but the most significant result is that the
centrists uncertainty u
determines the outcome of the dynamics in large regions of parameters.
For narrow uncertainties, say u≤0.4, a few
perc. of centrists are dragged toward extremism. For u
 1 initially
moderate agents are split in two opposed extremist fractions, and for u≥1.4 most
moderate agents are dragged towards an asymmetric single extremist
attractor, close to either -1 or +1.
1 initially
moderate agents are split in two opposed extremist fractions, and for u≥1.4 most
moderate agents are dragged towards an asymmetric single extremist
attractor, close to either -1 or +1.
- 2.21
- This extremism model and the full set of results described
in Deffuant et al. (2002),
and more recently in Deffuant (2006),
show that extremists can convert a large fraction of the population for
the largest values of the centrist uncertainty, even when their number
is relatively small with respect to the total population. What is
missing is the reason why extremism first arises. Deffuant
et al. (2002) postulate
the initial existence of some extremists in the population from
empirical observations of the political scene of most countries,
including democracies. The model by Smaldino and Epstein (2015) provides a clue to the origin
of extremism.
Anti-conformism generates extremism
- 2.22
- Smaldino and Epstein (2015) recently introduced a model of anti-conformism and its consequences on individual preferences: "Social Conformity Despite Individual Preferences for Distinctiveness". [3] The concept of distinctiveness plays a central role in several social psychological theories of self and identity processes. In such framework, positions are most often taken in multi-dimensional spaces. Since we here represent political opinions as continuous variables on a bounded support, the most distinctive opinions should be those at the boundaries. The idea is that some political agents choose anti-conformist attitudes to attract attention and get some prestige. The process can be observed among political activists and we will further discuss in the conclusion section why some professional political agents choose non-conformism or extreme positions.
- 2.23
- In the Smaldino-Epstein model, instead of exchanging with
other agents to share common views, anti-conformist agents react to the
distribution of opinions (which they are supposed to be aware of) and
they choose opinions away from the average opinion of the other agents.
Anti-conformists view as ideal a position x*
such that:
x* = xaver + δ·σ (2)
where xaver is the average opinion of the distribution, σ is the standard deviation of the distribution and δ a kind of anti-conformist strength. Agents then gradually update their opinion in the direction of x* according to:x = x + μ·(x* - x) (3)
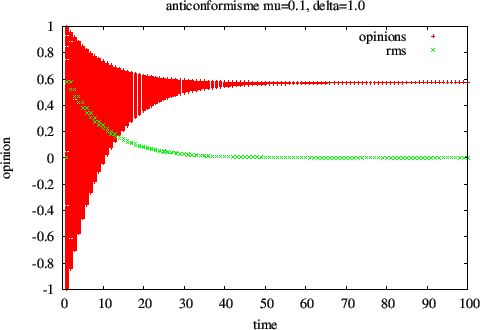
- 2.24
- Although anti-conformists wish to remain distinct from the crowd, since they all share the same goal x* the variance of the distribution actually decreases during each iteration by a factor 1 - μ and they converge towards a single attractor. Starting from an initial uniform distribution on segment [-1,+1], for positive values of δ, the final opinion cluster is well above the initial opinion average at σ0δ, where σ0 is the initial standard deviation. The asymptotic opinion can then stand outside the initial opinion range for large values of σ0δ.
- 2.25
- In other words, anti-conformism4
results in convergence to more extreme opinions than the initial
average opinion, which makes the process a valuable hypothesis on the
origin of extremism. Of course many other factors can play a role, but
we will here only investigate the importance of the anti-conformism
factor[5].
The synthetic model
- 3.1
- In the present synthetic model, two different populations
of agents are introduced:
- Conformists obeying a bounded confidence model as in Deffuant et al. (2000). The conformists can be directly influenced by all individual agents within their uncertainty range. Their opinions aggregate into clusters.
- Anti-conformists obeying the anti-conformist model of Smaldino and Epstein (2015). The anti-conformists are only influenced by the local properties, average opinion and standard deviation of the agents' opinion, within their uncertainty range. As a result, they soon move towards the exterior of the distribution of conformists.
- 3.2
- Let us stress the difference between the anti-conformists
of the present model and the extremists of Deffuant et al. (2002). In Deffuant et al. (2002), the extremists have been given ab
initio extreme positions and they are far less susceptible to
centrists attraction than the other agents. In the present model,
anti-conformists have the same initial opinion distribution than the
other agents. They evolve towards extreme positions because of their
specific dynamics. They become little influenced by centrists when they
get close to their equilibrium position because meanwhile centrists
opinions have coalesced into clusters, thus reducing the standard
deviation of their distribution. In other words, anti-conformists acquired
a role similar to extremists. By contrast, the attraction of
conformists towards anti-conformists has been identically maintained.
Model description
- 3.3
- Two populations of conformists and anti-conformists co-exist and interact according to the threshold condition. For any agent, anti-conformist or conformist, interactions only involve their neighbourhood, [x - u, x + u]. u is the same for conformists and anti-conformists and specifies the interaction range for both types of agents.
- 3.4
- We start from a uniform initial distribution of agents opinions on the [-1,+1] segment.
- 3.5
- At each time step, one agent is first randomly selected.
- 3.6
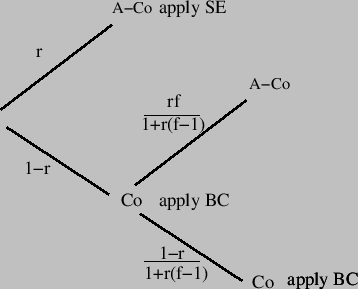
- If an anti-conformist were selected during the first draw, it interacts with all the agents within the reach of its opinion [x - u, x + u] using the Smaldino-Epstein algorithm, moving towards the local x*. This happens with probability r where r is the fraction of anti-conformist agents. And that's it for the round.
- 3.7
- If the first agent were a conformist, which happens with probability 1 - r, a second agent is randomly selected and we apply the Deffuant algorithm. In fact, if the second agent were an anti-conformist, only the conformist moves towards the anti-conformist since anti-conformists are not involved in binary interaction[6]. In other word, their only moves are those dictated by the Smaldino-Epstein algorithm.
- 3.8
- Figure 4 describes the tree of probabilities for one
sampling round.
- 3.9
- Since we here describe the political arena, we further add
two more rules for anti-conformists.
- Anti-conformists choose positions outside the crowd and as far as possible from the other party(ies); a simple implementation of this inclination is to choose positive (resp. negative) values of δ for anti-conformists with positive opinion (resp. negative). This simple rejection rule is only applied to anti-conformists[7]. Anti-conformist opinions are only updated when the first draw was an anti-conformist.
- We take into account the fact that anti-conformists are more active in propaganda than conformists. They express their opinion more often than conformists, whether in the streets or in the media (Bronner 2013). One extra parameter of the model is f the relative frequency of opinion expression of anti-conformists with respect to the frequency of expression of conformists. This is implemented in the model by the fact that any anti-conformist is randomly selected for interaction f times more often than any conformist.
- 3.10
- Let us be more specific about the implementation of the
second rule concerning the second draw. Let r
be the fraction of anti-conformist in the population. Since any
anti-conformist is selected f
more often than any conformist, anti-conformists are selected for
interaction with a probability proportional to rf.
Conformists are selected with a probability proportional to 1 - r.
Normalising probabilities to sum 1 implies to draw anti-conformists
with probability
 and conformists
with probability
and conformists
with probability 
Simulation results
-
Time plots and histograms
- 3.11
- Let us first compare time plots (fig. 4 and 6) and
asymptotic histograms (fig. 5 and 7) of opinion dynamics, when one
changes the relative expression frequency parameter f from 1 to 20.
The following plots were drawn for an uncertainty level u = 0.3,
anti-conformism strength δ
= 2, number of agents 1000, number of iterations per agent
300, fraction of anti-conformists 0.05, kinetic factor μ = 0.1. Let us
remind here for the sake of comparison that the int()
rule predicts 3 clusters at opinions -0.66, 0 and 0.66 in the absence
of anti-conformists.
Figure 5. Time evolution of opinions for 0.3 uncertainty level, δ = 2, μ = 0.1 and equal chances for opinion expression for conformists (in red) and anti-conformists (in green). Anti-conformists move to the border of the distribution in a few tens steps and maintain their position at the border until convergence of conformists is achieved. 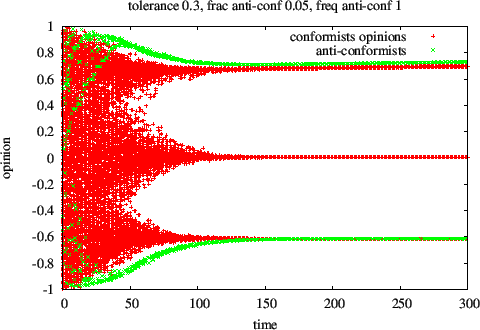
Figure 6. Histogram of asymptotic opinions after 300 iterations per individual for 0.3 uncertainty level, δ = 2, μ = 0.1 and equal chances for opinion expression for conformists (in red) and anti-conformists (in green) (the same simulation condition as in figure 5). Apart from the presence of anti-conformists at the extreme of the distribution, the position of conformists differs little from the int( )
rule prediction, -0.66 and +0.66.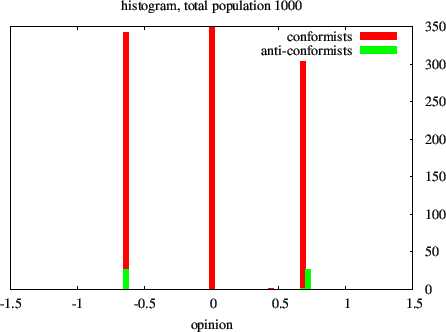
- 3.12
- As a preliminary conclusion, the presence of 5 percent
anti-conformists in the population does not modify the distribution of
conformists opinion when anti-conformists have the same level of
opinion expression as conformists (fig. 5 and 6).
Figure 7. Time evolution of opinions for 0.3 uncertainty level, δ = 2, μ = 0.1 when anti-conformists (in green) express their views 20 times more often than conformists (in red). We now observes 4 clusters instead of 3 with quite different positions. Anti-conformists have attracted two clusters to more extreme positions around -1 and +1 and the rest of the conformists have now moved closer to the center. 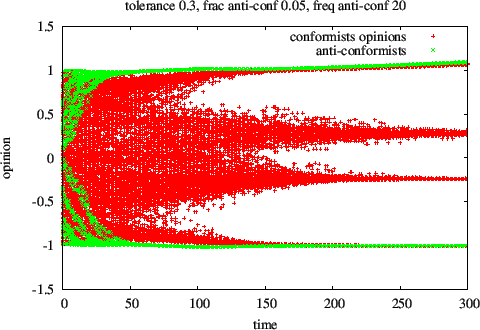
Figure 8. Histogram of asymptotic opinions for 0.3 uncertainty level, δ = 2, μ = 0.1 , when anti-conformists (in green) express their views 20 times more often than conformists (in red). We now observes 4 clusters instead of 3 with quite different positions. Anti-conformists have attracted two clusters to more extreme positions around -1 and +1 and the rest of the conformists have now moved closer to the center. 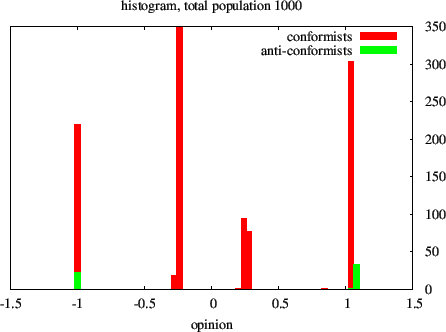
- 3.13
- However as one can observe on the next couple of figures 7
and 8, anti-conformists strongly influence the distribution of
conformist opinions when anti-conformists express their views 20 times
more often than conformists. Figure 7 shows that interaction among
conformists make them converge into 4 clusters. The respective
positions of conformists and anti-conformists clusters results from
their mutual interaction: anti-conformists first aggregate outside
conformists, but later, after conformists aggregation, the
anti-conformists have a reverse motion towards the closest conformists'
cluster, symmetrical to the motion of the extreme conformist cluster
towards anti-conformists.
Variability of asymptotic clusters
- 3.14
- As a matter of fact, several trials with different random sampling give qualitatively equivalent results: the presence of a few outspoken anti-conformist (with f = 20) changes the attractors of opinion dynamics from three clusters to two center clusters + two extreme clusters; but the cluster positions and amplitude might change noticeably between simulations with different random samplings for the same set of parameters. Such instabilities are well known in random processes such as Polya urns or Chinese restaurant process (Johnson and Kotz (1977)). In the case of Polya urns, a coloured ball is randomly drawn from the urn and two balls of the same colour are then replaced in the urn. When the initial number of balls is small, say one red ball and one black ball, the proportion of late samplings is strongly dependent upon the first occurring draws and is thus susceptible of large fluctuations. We are precisely in a similar case, since the initial opinions and sampling of the 50 anti-conformists have a strong influence on the outcome of the dynamics. This phenomenon is a particular instance of the path dependence phenomenon observed in non-linear and random processes (Nelson and Winter 1982; Arthur 1994). Path dependence reflects the influence of history, which importance in politics is not a surprise to political scientists.
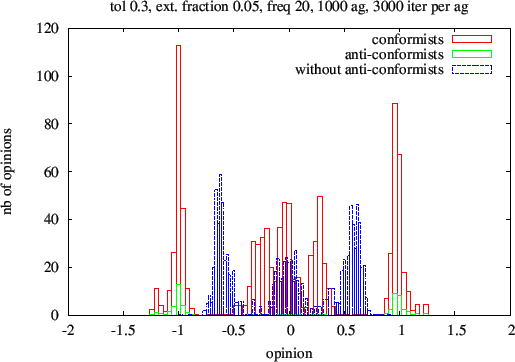
- 3.15
- We therefore performed 100 simulations per set of
parameters and display the results as histograms. In the next 3
figures, red histograms correspond to conformist opinions at the end of
the simulation and green histograms correspond to anti-conformist
opinions. The blue histograms corresponding to simulations in the
absence of anti-conformist are shown for the sake of comparison. Common
simulation parameters are anti-conformism strength parameter δ = 2, number
of agents 1000, number of iterations per agent 3000, fraction of
anti-conformist 0.05, kinetic factor μ
= 0.1 and multiplicative frequency factor of
anti-conformist f =
20. They only differ by the uncertainty levels: u = 0.3, 0.4, 0.6.
Figure 9. Histograms of opinions averaged over 100 runs after 3000 iterations per individual. 0.6 uncertainty level. The red (resp. green) histograms are for conformists (resp. anti-conformists) and the blue histogram was obtained for conformists in the absence of anti-conformists. 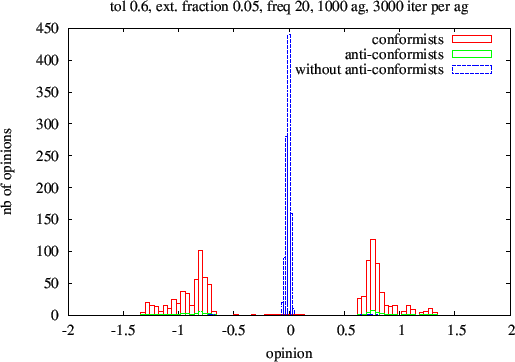
Figure 10. Histograms of opinions averaged over 100 runs after 3000 iterations per individual. 0.4 uncertainty level. The red (resp. green) histograms are for conformists (resp. anti-conformists) and the blue histogram was obtained for conformists in the absence of anti-conformists. 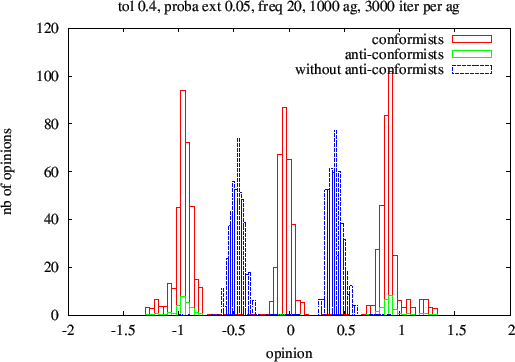
- 3.16
- The 3 figures confirm that large levels of expression by anti-conformists allow them to drag significant fractions of conformists towards the two emergent extreme clusters, with some variability in positions and relative amplitude. The influence of anti-conformists increases the number of clusters composed of conformists by (at least) one; two extreme clusters have opinions aligned with those of anti-conformists, while the remaining cluster(s) (which can be 0, 1 or 2) are centered closer to the original opinion average[8].
- 3.17
- The following simple argument explains the increase in the
number of clusters due to the influence of the anti-conformist agents.
Two extreme conformist clusters of initial width u
are attracted by the anti-conformists. They don't participate in the
formation of the central clusters. The "effective" width wc
of initial segment of conformists which end up in the central clusters
is then reduced to 2 - 2u,
instead of 2. Applying the n = int(
 )
rule to the number nc
of central clusters gives nc = int(
)
rule to the number nc
of central clusters gives nc = int( ).
The predicted total number of clusters is then:
).
The predicted total number of clusters is then:
n = 2 + int(  )
)(4)
A comparison with simulation results gives:uncertainty predicted clusters' number observed number .6 2 2 .4 3 3 .3 4 5 with overlap Checking the path dependency
- 3.18
- Because the earlier steps of the dynamics are so important,
we might expect that anti-conformists have a stronger influence if they
step in earlier rather than later. In the next two sets of simulations,
the frequency factor f
was either decreased or increased linearly in time between 1 and 20,
for the same set of parameters as in figure 10. One can check that the
red histogram taken for decreasing f
from 20 to 1 is nearly the same as the red one on figure 10, obtained
in the presence of 5 perc. anti-conformists with relative expression
frequency 20, while the green one for increasing f
from 1 to 20 is nearly the same as the blue one (obtained in the
absence of anti-conformists) on figure 10. In other words, the early
expression of extremist views determines the outcome of the process,
while late expression has nearly no effect.
Figure 12. Histograms of conformist opinions after 3000 iterations per individual. 0.4 uncertainty level. The red histogram correspond to decreasing the anti-conformist expression frequency, the green one to its increase. 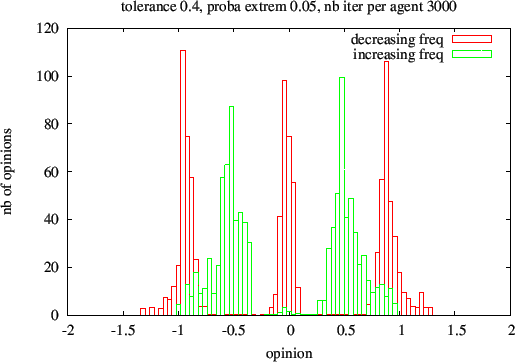
The consensus regime
- 3.19
- For larger uncertainty values, such as u = 0.9, the situation changes dramatically. Single runs show that there remains only one cluster of conformists at the same position as the anti-conformist cluster; consensus is restored. But a more systematic survey running 300 simulations per set of parameters shows on figure 13 that the position of the single cluster varies widely along the opinion axis; furthermore, no peak structure similar to those observed at lower uncertainties is apparent on the histogram of clusters. The vertical bars of the histogram are the number of opinions divided by the number of conformist agents. Except for a small region in the neighbourhood of opinion 0.0, the height of the peaks are integer values, indicating that for each simulation, all opinions are concentrated in one single cluster. A first tentative explanation for randomness of the cluster position rests on the faster dynamics at larger u values: nearly all pair samplings satisfy the confidence condition for interaction, and convergence is then faster, as we checked on time plots (not represented). We have earlier seen that faster convergence yields more sensitivity to the early steps of the dynamics and more dispersion of the asymptotic results.
- 3.20
- Obtaining a consensus for u = 0.9 is in accordance with the int(1/u) rule of the bounded confidence model; but the standard bounded confidence model yields a consensus attractor close to the center of gravity of the initial distribution, which is quite different from the present result: the consensus peaks seem randomly located on the [-1,+1] opinion axis.
- 3.21
- Our results also differ from those of the extremism model of Deffuant et al. (2002) who predict clusters located close to the anti-conformist initial positions i.e -1 or +1, for large values of u ( in accordance to their hypotheses of quasi-fixed position of anti-conformists at -1 or +1). By contrast, for large values of u, in our present model, the position of anti-conformist initially scattered over the entire [- 1, + 1] segment results largely from the earlier iteration steps and can undergo large fluctuations.
- 3.22
- The transition between single cluster dynamics at larger u and two
clusters dynamics at lower u
is smooth; it is a crossover rather than a sharp transition and occurs
around u = 0.8.
At u = 0.8
the histogram (fig 14) displays co-occurrence of bins with integer
values corresponding to single clusters and of bins with non-integer
values clustered in two wide peaks around ±0.66.
Figure 13. Histogram of conformist agents asymptotic opinions for a 0.8 uncertainty level based on 300 simulations. The vertical bars are the number of opinions divided by the number of conformist agents. 30000 iterations per individual for a 0.9 uncertainty level. Except for a small region in the neighbourhood of opinion 0.0, the height of the bins are integer values, 1, 2 or 3 indicating that for each simulation, all opinions are concentrated in one single cluster 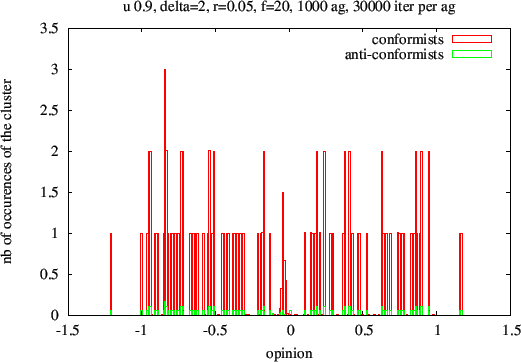
Figure 14. Histogram of conformist agents asymptotic opinions for a 0.8 uncertainty level based on 300 simulations. 3000 iterations per individual for a 0.8 uncertainty level, corresponding to the transition. The bins are a mixture of integer values 1 and 2, plus two wide peaks around ±0.66 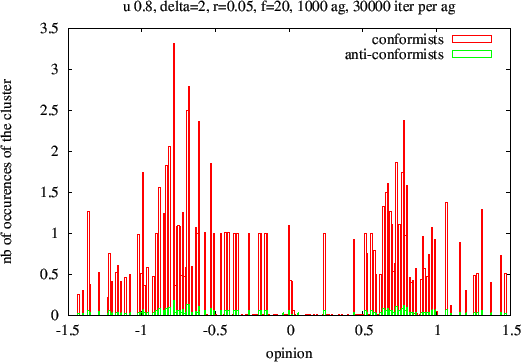
Influence of simulation parameters
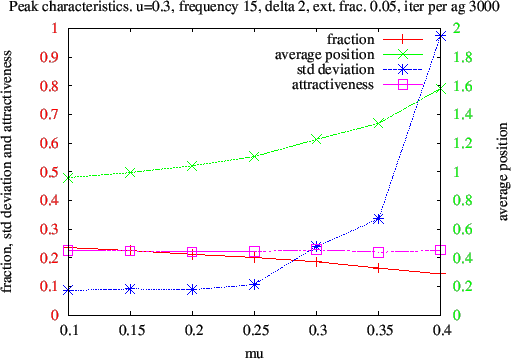
- 3.23
- In order to study the influence of the different parameters r, f, u, μ and δ on the outcome of opinion dynamics, one has to compress the information in the histograms by monitoring some of their characteristics. We have chosen to monitor the characteristics of the positive 'extreme' peak, the rightmost peak[9] observed on figures 9, 10, 11. We monitored the fraction of opinions in the peak (i.e how many conformists were attracted by the rightmost anti-conformists), their average position (how far from the initial average 0 they were attracted), the standard deviation of the distribution of opinions in the peak[10], and finally the product of the average times the fraction[11]. This latest quantity measures some kind of "attractiveness". We shall see that this attractiveness often (but not always as further discussed) displays relatively little variation, corresponding to a balance between how many conformists are attracted by anti-conformists and how far they are attracted.
- 3.24
- The present systematic investigation of the role of
simulation parameters is limited to the lower values[12] of u, in the
multiple clusters regime.
Figure 15. Variations of the rightmost peak characteristics with uncertainty u. The fraction of opinions, the standard deviation and the attractiveness are given by the scale on the left, in red, and the average position by the scale on the right, in green. When uncertainty increases from u = 0.3, to u = 0.7, the fraction of attracted conformists (the red crosses) increases up to values (0.47) corresponding to a near depletion of the central peak(s) where only 6 perc. of the population remains; most conformists became extremists. Average opinion (green crosses) of the extreme peak decreases to 0.8 and its standard deviation increases. 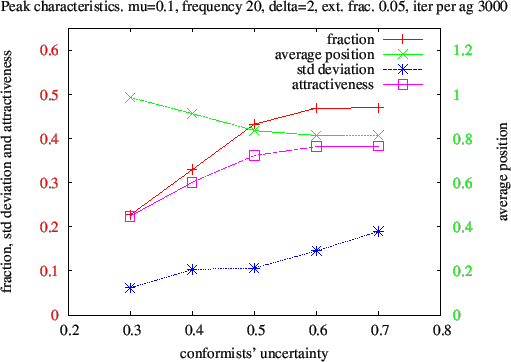
- 3.25
- Applying this method to the influence of uncertainty u one obtains the following graph (fig.15), some points ( u = 0.3, 0.4, 0.6) of which can be checked against the histograms on fig. 9, 10 and 11. The linear increase with u of the fraction of agents attracted to the extreme peak is simply understood from the width of the conformist's zone under the influence of the anti-conformist: since anti-conformist move early to the upper boundary of the conformist cluster they can at most influence a fraction u of them. The simulated results give fractions of 0.227 for u = 0.3, 0.33 for u = 0.4 and 0.43 for u = 0.6, not far away from the u upper-bound. But the attracted fraction saturates close to 0.5 at larger u values, when the two extremist clusters are competing.
- 3.26
- Increasing the fraction r
of anti-conformist (fig. 16) and their relative frequency of
intervention f
(fig. 17) increases the average distance of the peak from 0. The ratio
of biased moves of conformists towards anti-conformists to their
converging moves obtained from the tree of probabilities (figure 4) is
 This ratio
increases with both r
and f,
and so does the average position of the peak.
This ratio
increases with both r
and f,
and so does the average position of the peak.
Figure 16. Variations of the rightmost peak characteristics with r the fraction of anti-conformists. The fraction of opinions, the standard deviation and the attractiveness are given by the scale on the left, in red, and the average position by the scale on the right, in green. 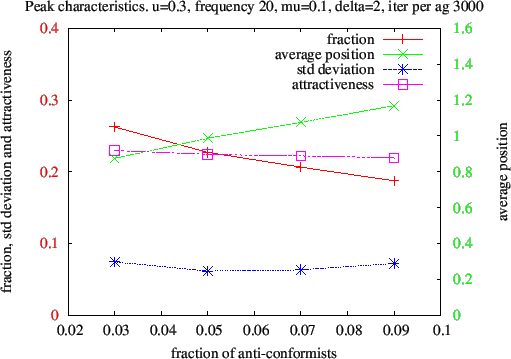
Figure 17. Variations of the rightmost peak characteristics with f the multiplicative factor of interactions with anti-conformist. The fraction of opinions, the standard deviation and the attractiveness are given by the scale on the left, in red, and the average position by the scale on the right, in green. 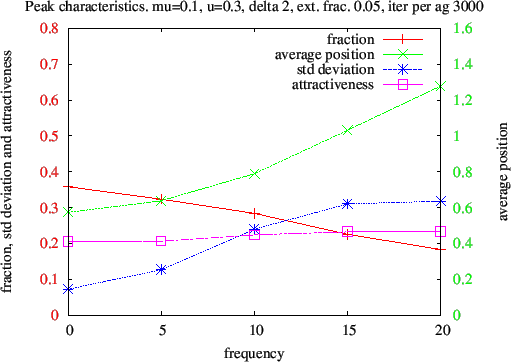
μ is a priori a simple kinetic parameter which increase reduces the convergence time. For instance, a value of 0.5 was generally considered as optimal in bounded confidence models since it implies the full agreement between a pair of agents on the middle position in one single iteration. But as observed with this plot (fig. 18), μ also influences the peak characteristics. When convergence is fast, the initial steps of the iteration process have an even stronger influence on the outcome of the dynamics - see for instance the dramatic increase of the standard deviation of the rightmost peak when μ = 0.4. A technical conclusion is that in order to avoid strong sampling variations, opinion dynamics models should be run with values of μ≤0.25. This is anyway compatible with the fact that in real life several interactions are necessary to significantly change opinions.
- 3.27
- The variations of the rightmost peak characteristics with δ the
anti-conformism intensity are non-monotonic. When δ increases
from 1.5 to 2.6, the average position increases, which is a direct
consequence of equation (2). But it reaches a maximum around δ = 2.6. The
change of slopes of the average position, of the fraction of
conformists in the peak and of the attractiveness curves, as the strong
increase of the standard deviation are evidences of a regime transition
around δ
= 2.6
Figure 19. Variations of the rightmost peak characteristics with δ the anti-conformism intensity. When δ starts increasing from δ = 1, the conformists are attracted to more extremism (the green points). But when δ = 2.6 a regime changes occurs as observed on all four monitored quantities: extremists' fraction (red crosses) and attractiveness (pink squares) decrease, and they start loosing followers (red crosses). The strong increase of the standard deviation around δ = 2.6 is also a clue of the regime transition. 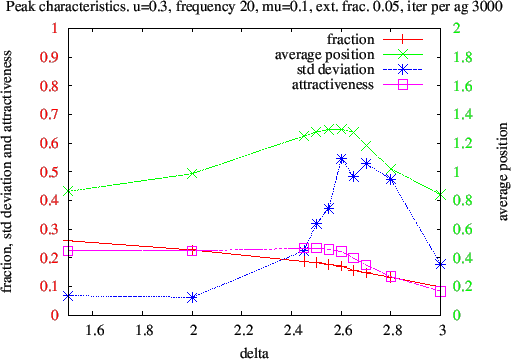
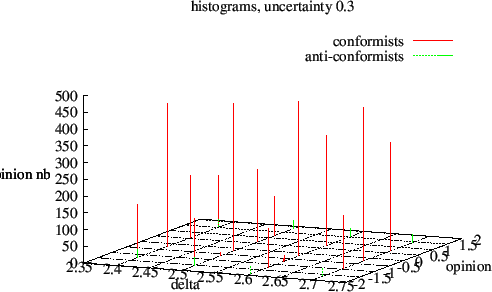
- 3.28
- To observe the transition region in detail (fig. 20), we came back to individual asymptotic histograms similar to figures 6 and 8. One notices that before the transition, at δ = 2.4 the leftmost and rightmost peaks of conformists histograms (in red) occur at the same opinion values as anti-conformists histogram peaks (in green). For higher values of δ the anti-conformists peaks are outside the leftmost and rightmost conformists peaks. In other words, the anti-conformists became unable to drag anymore the conformists to their position.
- 3.29
- Since larger values of conformists uncertainty u make them
more susceptible to the influence of anti-conformists, the stalling
transition value δs
increases with u:
we observed a transition at δs =
2.5 when u
= 0.3, at δs =
2.8 when u
= 0.4 and at δs =
3.2 when u
= 0.6.
- 3.30
- To summarise on "Attractiveness", it displays relatively small variations with r, f and μ, reflecting a rough balance[13] between how many conformists are attracted toward extremism and how far. The same relative stability is observed with respect to δ until δ = 2.5. Attractiveness decays when δ > 2.5 and this is an indication of a change in dynamical regime: anti-conformists lost their strong influence on conformists. The increase in "attractiveness" with conformists uncertainty u also reflects the series of transitions in the number of clusters with u.
Discussion and conclusions
- 4.1
- Let us first summarise our results.
- Anti-conformism of small fraction of the agents population can result in the emergence of large extremist clusters, provided that the anti-conformists express more often their views than conformists.
- This influence exists whatever conformist uncertainty, and it is larger when uncertainty increases. Two distinct dynamical regimes are observed according to the value of uncertainty. For lower values, anti-conformists drag important fractions of conformist agents to their own extreme position. For higher values of uncertainty, consensus is restored, but along a much wider range of positions which can be centered far away from the initial center of gravity of initial opinions.
- Obviously the anti-conformist influence increases with their number and the frequency of their interventions. By contrast, one observes a transition in the anti-conformist influence when anti-conformists position themselves too far away from the center; they then loose influence and are unable to drag large fractions of conformists.
- Early intervention of anti-conformists increases their influence. And the early steps of the dynamics are responsible for the large deviations in peak positions.
- The results concerning the number of peaks in the opinion distribution as a function of the uncertainty parameter and their approximate position are robust. The exact position of the peak cannot be predicted accurately, due to the susceptibility of the probabilistic dynamics to initial samplings.
- 4.2
- Let us now discuss how these conclusions would eventually be modified by the other players in the political game, media, parties, and other institutions such as elections, government etc.
- 4.3
- In fact, media and political parties re-enforce the influence of non-conformists. Journals, newspapers or television compete for readership and audience. Journalists fight for impact, notoriety and reputation. In this market for information, or cognitive market as proposed by Bronner (2013), the motivations are the same as for anti-conformists of Smaldino and Epstein (2015). Impact is achieved by taking simple, extreme and fast positions. The tendency is increased by the use of Internet, from which journalists often take their views. The fast communication procedures on Social Networks also favour the extremes as observed on tweets and readers reaction to articles in the press. To maximise audience, societal and political debates on the television are dramatised: they oppose extreme views and seldom result in consensus. As a matter of fact, the media contribute largely to the high value of the relative frequency factor f used in our simulations. In that respect, the growing role of the media and especially of the Internet will not automatically lead to a better understanding of challenges and options, but might on the contrary favour the expression of extremist views.
- 4.4
- The same mechanisms can be observed during the political debate inside parties, before elections. Party members are competing to get positions inside the party or to represent the party in future elections. They also want to make clear that they are faithful to their party by strongly opposing other parties views. For them too, a simple ideological position is easier to express and to defend, than balancing between the contradictory constraints faced in the choice of a policy adapted to societal challenges.
- 4.5
- So both media and political parties internal discussions re-reinforce the influence of extremists.
- 4.6
- The dynamics might be different during elections and at the government level. On the occasion of national elections for instance, parties have to adapt their program to the electorate and make alliances to win support. In principle they should move towards the center for this. But when the electorate comprises strong extremist clusters, as often observed in our simulations, they have a choice to position themselves clearly on one side of the political checkers, especially under the influence of their members which are biased with respect to the 'rational' position of optimising support from the general population.
- 4.7
- The government itself has to navigate between general support and the support from inside the parties of the alliance which brought it in power.
- 4.8
- In conclusion of the present discussion, the dynamical processes inside the media and the parties are in agreement with our hypothesis of a stronger expression of anti-conformist positions. This re-enforce the conclusions of our model.
- 4.9
- On the other hand, other aspects of politics concerning general elections or government positions necessitate further analysis.
- 4.10
- What we tried to demonstrate is that evolution towards extremism does not automatically imply coercion, strategic plots or the control of the media by a single agent. Simple human cognitive processes such as anti-conformism, cognitive biases and uncertainty of agents can favour its emergence and its influence on the constituency.
- 4.11
- The results of our simulations were interpreted in terms of
politics, but they could also provide some insight into other social
phenomena involving the dynamics of extreme choices:
- In markets of luxury goods: for instance, why do people buy fast cars or SUV vehicles when they have little use for these products? How is the market driven by these extreme choices?
- In Fashion and in the Arts, where anti-conformism is the rule driving the perpetual motion of expressed realisations.
- In the propagation of imaginary dangers related to new technologies in the media and the Internet (Bronner 2013).
Model Code for replication A FORTRAN commented version of the code can be found as an ancillary file with the preprint at http://arxiv.org/abs/1503.04799.
Acknowledgements
- We thank Joshua Epstein and Paul Smaldino for sending their preprint prior to publication and the participants to the "séminaire inattendu" for their comments. We thank anonymous referees for their corrections and for raising interesting issues.
Notes
- 1
Rational here does not refer to economists' full rationality but rather
to its common sense, people able to practice some form of reasoning.
2Many extensions of the bounded confidence model were proposed as described in the review of Castellano et al. (2009). Some take into account the possibility of repulsion among agents such as Huet et al. (2008); Alizadeh et al. (2014): agents can be either attracted for small differences in opinions, but can also have repulsive interaction when their difference is larger than another upper threshold. Other models, Kurmyshev et al. (2011), consider two populations of interacting agents, some having only attractive interaction, others also having repulsive interactions.
3Their paper does not explicitly refer to politics but they quote several references about politics.
4Other authors have introduced anti-conformist agents in the simulation of binary opinion dynamics (Galam 2004; Jarman et al. 2015). In the context of binary opinions, say 0 or 1, anti-conformists have opinions opposed to the opinion of their neighbours. In the Smaldino and Epstein (2015) model as in the present paper, the anti-conformists choose opinions further than those of other agents. Their position can be described as 'plus royaliste que le Roi' or in English 'more catholic than the Pope'. Hence, the dynamics of 'our' mixed population is quite different from those described in Galam (2004) and Jarman et al. (2015).
5The Smaldino–Epstein (2015) paper covers more situations than reported here, including heterogeneity of δ, the anti-conformist strength. It e.g. shows that the above conclusions on convergence of the dynamics remain true provided that such heterogeneity is limited: the standard deviation of the δ distribution should be less than 1.
6We have chosen not to move the anti-conformist, although the alternative choice, move according to SE rule could have been made. Anyway, differences in behaviour between the two choices would not have changed qualitatively the dynamics for our choice of parameters.
7This simple implementation does not cause any practical problem for opinion values close to zero since anti-conformists move away very soon from the average as observed in figures 5 and 7.
8A word of caution: such histograms could be interpreted either as histograms of the positions of single isolated peaks as observed in figures 5 and 7, or as the aggregation of wider peaks. We confirm that only the first interpretation is correct from many direct observations of asymptotic histograms of single iteration processes. Furthermore, wide peaks would not be stable under the bounded confidence process.
9Isolating the rightmost peak for these measurements was done by checking the histograms for a gap left of the peak and taking measurements on the remaining bins right of the gap; for figure 10 e.g., the empty bin at 0.65 opinion can be used to start collecting the statistics.
10These three quantities correspond to standard measurements of peak characteristics in spectra, the area under the peak (fraction), the peak position with respect to the origin (average position), and the peak width (twice the standard deviation). For figure 10 e.g. the fraction of opinions in the rightmost peak is 33 perc., the average position is 0.91 and the standard deviation 0.10.
11In the next five figures, the fraction of opinions, the standard deviation and the attractiveness are given by the scale on the left, in red, and the average position by the scale on the right, in green.
12larger values of u were previously investigated in the section on the consensus regime.
13we can only conjecture about this balance, but we have no explanation for it, nor why changes in attractiveness or its derivatives goes along with transitions in dynamical regimes.
References
- ALIZADEH,
M., Coman, A., Lewis, M. & Cioffi-Revilla, C. (2014).
Intergroup conflict escalation leads to more extremism. Journal
of Artificial Societies and Social Simulation 17(4),
4: https://www.jasss.org/17/4/4.html.
ARTHUR, W. B. (1994). Increasing returns and path dependence in the economy. University of Michigan Press.
AXELROD, R. (1997). The dissemination of culture a model with local convergence and global polarization. Journal of conflict resolution 41(2), 203–226. [doi:10.1177/0022002797041002001]
BRONNER, G. (2013). La démocratie des crédules. Puf, Paris.
CASTELLANO, C., Fortunato, S. & Loreto, V. (2009). Statistical physics of social dynamics. Reviews of modern physics 81(2), 591. [doi:10.1103/RevModPhys.81.591]
DEFFUANT, G. (2006). Comparing extremism propagation patterns in continuous opinion models. Journal of Artificial Societies and Social Simulation 9(3), 8: https://www.jasss.org/9/3/8.html.
DEFFUANT, G., Amblard, F., Weisbuch, G. & Faure, T. (2002). How can extremism prevail? A study based on the relative agreement interaction model. Journal of Artificial Societies and Social Simulation 5(4) 1: https://www.jasss.org/5/4/1.html
DEFFUANT, G., Neau, D., Amblard, F. & Weisbuch, G. (2000). Mixing beliefs among interacting agents. Advances in Complex Systems 3, 87–98. [doi:10.1142/S0219525900000078]
GALAM, S. (2004). Contrarian deterministic effects on opinion dynamics:"the hung elections scenario". Physica A: Statistical Mechanics and its Applications 333, 453–460. [doi:10.1016/j.physa.2003.10.041]
GALAM, S., Gefen, Y. & Shapir, Y. (1982). Sociophysics: A new approach of sociological collective behaviour. i. mean-behaviour description of a strike.
Journal of Mathematical Sociology 9(1), 1–13.HEGSELMANN, R. & Krause, U. (2002). Opinion dynamics and bounded confidence models, analysis, and simulation. Journal of Artificial Societies and Social Simulation 5(3),2: https://www.jasss.org/5/3/2.html.
HOLLEY, R. A. & Liggett, T. M. (1975). Ergodic theorems for weakly interacting infinite systems and the voter model. The annals of probability, 643–663. [doi:10.1214/aop/1176996306]
HOTELLING, H. (1990). Stability in competition. Springer. [doi:10.1007/978-1-4613-8905-7_4]
HUET, S., Deffuant, G. & Wander, J. (2008). A rejection mechanism in 2d bounded confidence provides more conformity. Advances in Complex Systems 11(04), 529–549. [doi:10.1142/S0219525908001799]
JARMAN, M., Nowak, A., Borkowski, W., Serfass, D., Wong, A. & Vallacher, R. (2015). The critical few: Anticonformists at the crossroads of minority opinion survival and collapse. Journal of Artificial Societies and Social Simulation 18(1), 6: https://www.jasss.org/18/1/6.html
JOHNSON, N. L. & Kotz, S. (1977). Urn models and their application: an approach to modern discrete probability theory. Wiley New York.
KURMYSHEV, E., Juárez, H. A. & González-Silva, R. A. (2011). Dynamics of bounded confidence opinion in heterogeneous social networks: Concord against partial antagonism. Physica A: Statistical Mechanics and its Applications 390(16), 2945–2955.
NELSON, R. R. & Winter, S. G. (1982). An evolutionary theory of economic change. Harvard University Press.
PLOUS, S. (1993). The Psychology of Judgment and Decision Making. McGraw-Hill.
SMALDINO, P. E. & Epstein, J. M. (2015). Social conformity despite individual preferences for distinctiveness. R. Soc. open sci. 2, 140437. [doi:10.1098/rsos.140437]