
Introduction
“The challenge of global aging, like a massive iceberg, looms ahead in the future of the largest and most affluent economies of the world.” This quote from Gray Dawn: How the Coming Age Wave Will Transform America—and the World, published in 1999, highlights the urgency of population aging (Peterson 1999). Economists have provided detailed analyses regarding how the aging of the population affects health care costs (Sato 2001; Tabata 2005), capital flows and mobility (Dekle 2004; Guest 2006), labor supply, investment in human capital (Fougère 2009) and fiscal sustainability (Faruqee and Mühleisen 2003). For social scientists, population aging brings immense challenges in health insurance reform, health care management, social security expenditures, and the exploration of aging-related policies (Toshihiro et al. 2011; Schulz 2004; Davis et al. 2010; Jimeno et al. 2008; van Sonsbeek 2010). Consequently, researchers have paid considerable attention to the economic problems and the health care and social policy needs resulting from population aging. However, as an important entity of complex urban systems, the spatial behaviors of the elderly in relation to urban planning also warrant investigation. The impact of population aging on transportation systems (Maoh 2009) and mobility options in an aged society (Mercado 2010) have been examined, as have the preferences and frequencies of visits to public facilities in old age (Valdemarsson et al. 2005). A spontaneous trend has recently appeared with researchers linking the elderly with the development of welfare facilities and the management of the living environment.
Population aging in Japan is amongst the most substantial in the world. According to statistical data from a Japanese census survey, the elderly population increased from about 12.3 million in 1985 to 29.3 million in 2010. Although various regulations, including the Old-Age Person’s Welfare Law of 1963, have been enacted to safeguard health, welfare, and insurance services for the elderly, more welfare facilities, such as home care and day care (DC) centers, are needed. Coordinating the demands of such facilities in terms of rational spatial distribution has become an important topic in urban planning strategies in many Japanese cities. Local governments need to investigate the current living environment and care facilities of the elderly within their planning strategies. This will enable accurate predictions regarding required living environments and the demand for care facilities, including their required numbers and locations.
Simulation as a tool of analysis and prediction can be employed to establish a roadmap and explore possible solutions for the above questions. Previous literature on location models introduced a number of different approaches for locating facilities. Location-allocation is one approach for determining an optimal location for one or more facilities that will serve demand from a given set of points (ur Rahman and Smith 2000). Yang et al. (2011) employed an ordered logit model to investigate potential factors that contribute to hotel location choice. As a component of complex urban systems, the location of facilities for the elderly should consider the timely interactions between the aged population, facility owners, planners and governors. Agent-based models (ABMs) can better serve this demand by reflecting the evolutionary processes, such as demographics, in an urban space. Research using demographic process models has found that microsimulation of urban system evolution requires a synthetic population as a key input (D’Alessandro 2007; Puleston and Tuljapurkar 2008; Farooq et al. 2013). A variety of models and simulations have been employed to predict the scale, age structure, and demographic evolution of human populations (Frauenthal 1975; Weiss 1976; Fogarty et al. 2013; Shpak et al. 2013). In the field of public facility and health service, Davis et al. (2010) used a synthesized dataset to examine the effects of policy options on health services under demographic aging. Mielczarek (2013) simulated hospital emergency services at the regional level using synthesized population data. Although the population was considered when planning public services in these studies, the decision-making processes for planning the locations of facilities were not combined with demographic aging processes or the operative management processes of relevant facility owners. Comparatively, powerful ABMs exploring the complexity of urban systems (Batty and Torrens 2005) and the individual decision-making processes of household agents, such as location choices for facilities, agent relocations, and agent shopping behaviors (Chen et al. 2006; Filatova et al. 2009; Vanhaverbeke et al. 2011; Huang et al. 2011; Shen et al. 2012; MA et al. 2013), have emerged.
ABMs have been proven to be powerful tools in individual decision-making, and therefore, have been widely used for policy analysis and support in urban planning. However, few studies have focused on the effects of ABMs on policy making and planners’ use of simulation results determined by the models. Therefore, a synthesized modeling framework of the demographic aging process of a human population and agent-based behaviors for the planning strategies, including location planning of welfare facilities and DC center services, will provide a new perspective and add to the planners’ knowledge. Planning compilation is not taken into account in our research. Instead, we focus on the simulation of possible planning strategies and how this can provide insight into planning issues. For this purpose, we developed an ABM focusing on DC center locations and made the assumption that the geographic conditions of urban space will not change. As a novel contribution to current research, we introduced this model to planning committees to illustrate its usefulness in assisting planners in acquiring information for DC center development. We predicted that our agent-based DC center location model would assist planners and governors in understanding the interactions between themselves, the elderly population, and facility owners. It is important for planners and policy makers to understand the relationships between each agent in a given situation. Therefore, we attempted to investigate whether planners and governors could effectively use our simulation model to build knowledge for creating planning strategies.
The remainder of this paper is organized as follows: the research methodology is introduced in Section 2, and our agent-based DC center location model is described in detail in Section 3. In Section 4, the initial conditions and simulation configuration of the model is described, and simulated results are compared with actual data from a Japanese city. Finally, in Section 5, the research results are discussed along with the final conclusions.
Methodology
Committee for Sharing Planning Information for DC Center Development
We used Kanazawa city, Japan, as our research area for theoretical application. Between 2010 and 2012, the housing department of Ishikawa Prefecture conducted a “Living Home Protection Plan” project for the elderly. The urban planning laboratory of Kanazawa University, a national university in Ishikawa Prefecture, made a preliminary study of the project. A planning committee was organized, and some of its tasks included predicting population change and planning the possible location of DC centers. Committee meetings were held monthly. The committees were composed of four officers from the local government and six planning experts (planners) from Kanazawa University, some of whom were local consultants while others were Kanazawa University students. Decisions made by this committee would become preconditions of the planning compilation for the local government. Our research group at the Urban Planning Laboratory of Kanazawa University decided to prepare an ABM for simulating and visualizing potential DC center demand until 2030. This proposal, based on expert experience and official documents such as statistical records, was approved and accepted by the committee to replace conventional planning strategies. The research approach and datasets were readily accessible to the public, enabling open access to the results.
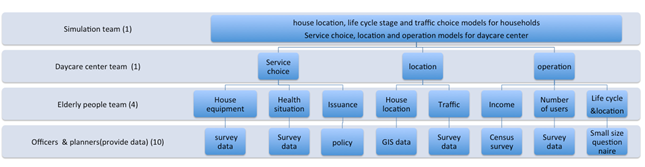
The following three teams on the committee took different roles in the planning process: a simulation team, an elderly people team, and a DC center team. The simulation team was in charge of carrying out simulations, collecting information, and compiling the necessary datasets. The remaining local consultants and student members attended the meetings and assisted the teams. The elderly people team conducted a field survey to collect information on the daily life of the community elderly and details regarding their income, housing, health status, health insurance and use of transport. The DC center team investigated current services, including the location and operation of DC centers, using field surveys and interviews with DC owners. The work of the different teams was then interconnected through an ABM. Figure 1 represents, at the bottom level, how the actual dataset was employed to represent Kanazawa city to enable planners to connect their knowledge to the simulation. At the second level, the four members of elderly people team were responsible for supplying data and documents related to the facility-using behaviors of the elderly. This information was connected to the work of the DC center team to support the simulation team in developing the model.
This represents only the first step for strategizing in the planning process. In research on urban modeling and policy simulations, various scenarios are considered (He et al. 2013; Hosseinali et al. 2013; Arsanjani et al. 2013; Le et al. 2010). These are always configured as parameter conditions, and researchers can check parameter sensibility to understand the impact of different scenarios. Our work attempted to investigate whether planners and governors could use our simulation model to build knowledge for creating planning strategies. As few future scenarios had been designed, we only simulated the near future based on current trends and DC center demand based on committee cooperation.
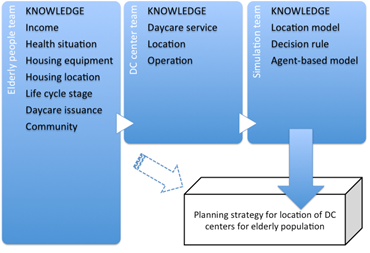
The committee acted as a forum for members to share their ideas and build new knowledge. In a conventional committee, discussion of DC center planning is done only after field surveys of community members and the elderly have been carried out. These investigative activities were also conducted by our committee, with the relevant results used to define the parameters of the model. In contrast to conventional committees, we focused on future trends of the elderly population and DC center demand on the urban space with these trends becoming new knowledge for planners, which is not possible in a conventional committee that does not use model simulation. As shown in Figure 2, the elderly people team supported the work of the DC center team with knowledge of existing DC services and locations, operation modes, etc. The simulation team designed the DC center location simulation model based on knowledge shared by the other two teams. We believed that knowledge of the evolution process and the interaction mechanisms between agents and the urban space shared by the simulation team would be helpful for planners in understanding the model. The simulation model and results were discussed by the committee to further improve knowledge and understanding. The framework shown in Figure 2 represents the committee as a platform for knowledge-sharing between members.
Creating Planning Knowledge and Developing Planning Strategies Using Agent-Based Modeling
Building a framework for knowledge sharing is one concept, but learning from and building new knowledge is another. The understanding of relevant planning issues differed among the committee members based on differences in educational background, experience, and responsibilities. Researchers typically use model simulation to support decision-making in planning; however, this is a “black box” in the planning process. Whether planners could readily understand the meaning of or trust simulation outputs remained questionable. Our work focused on changing this black box situation, and, in order to accomplish this, a decision-making process for model development, simulation implementation, and planning strategies that involved the entire committee was necessary. At its core, our decision-making process involved all committee members helping build knowledge on their current work. The framework of this process, which was organized into two parts—collaborative decision-making by the committee, and simulation and visualization of planning strategies — is shown in Figure 3.
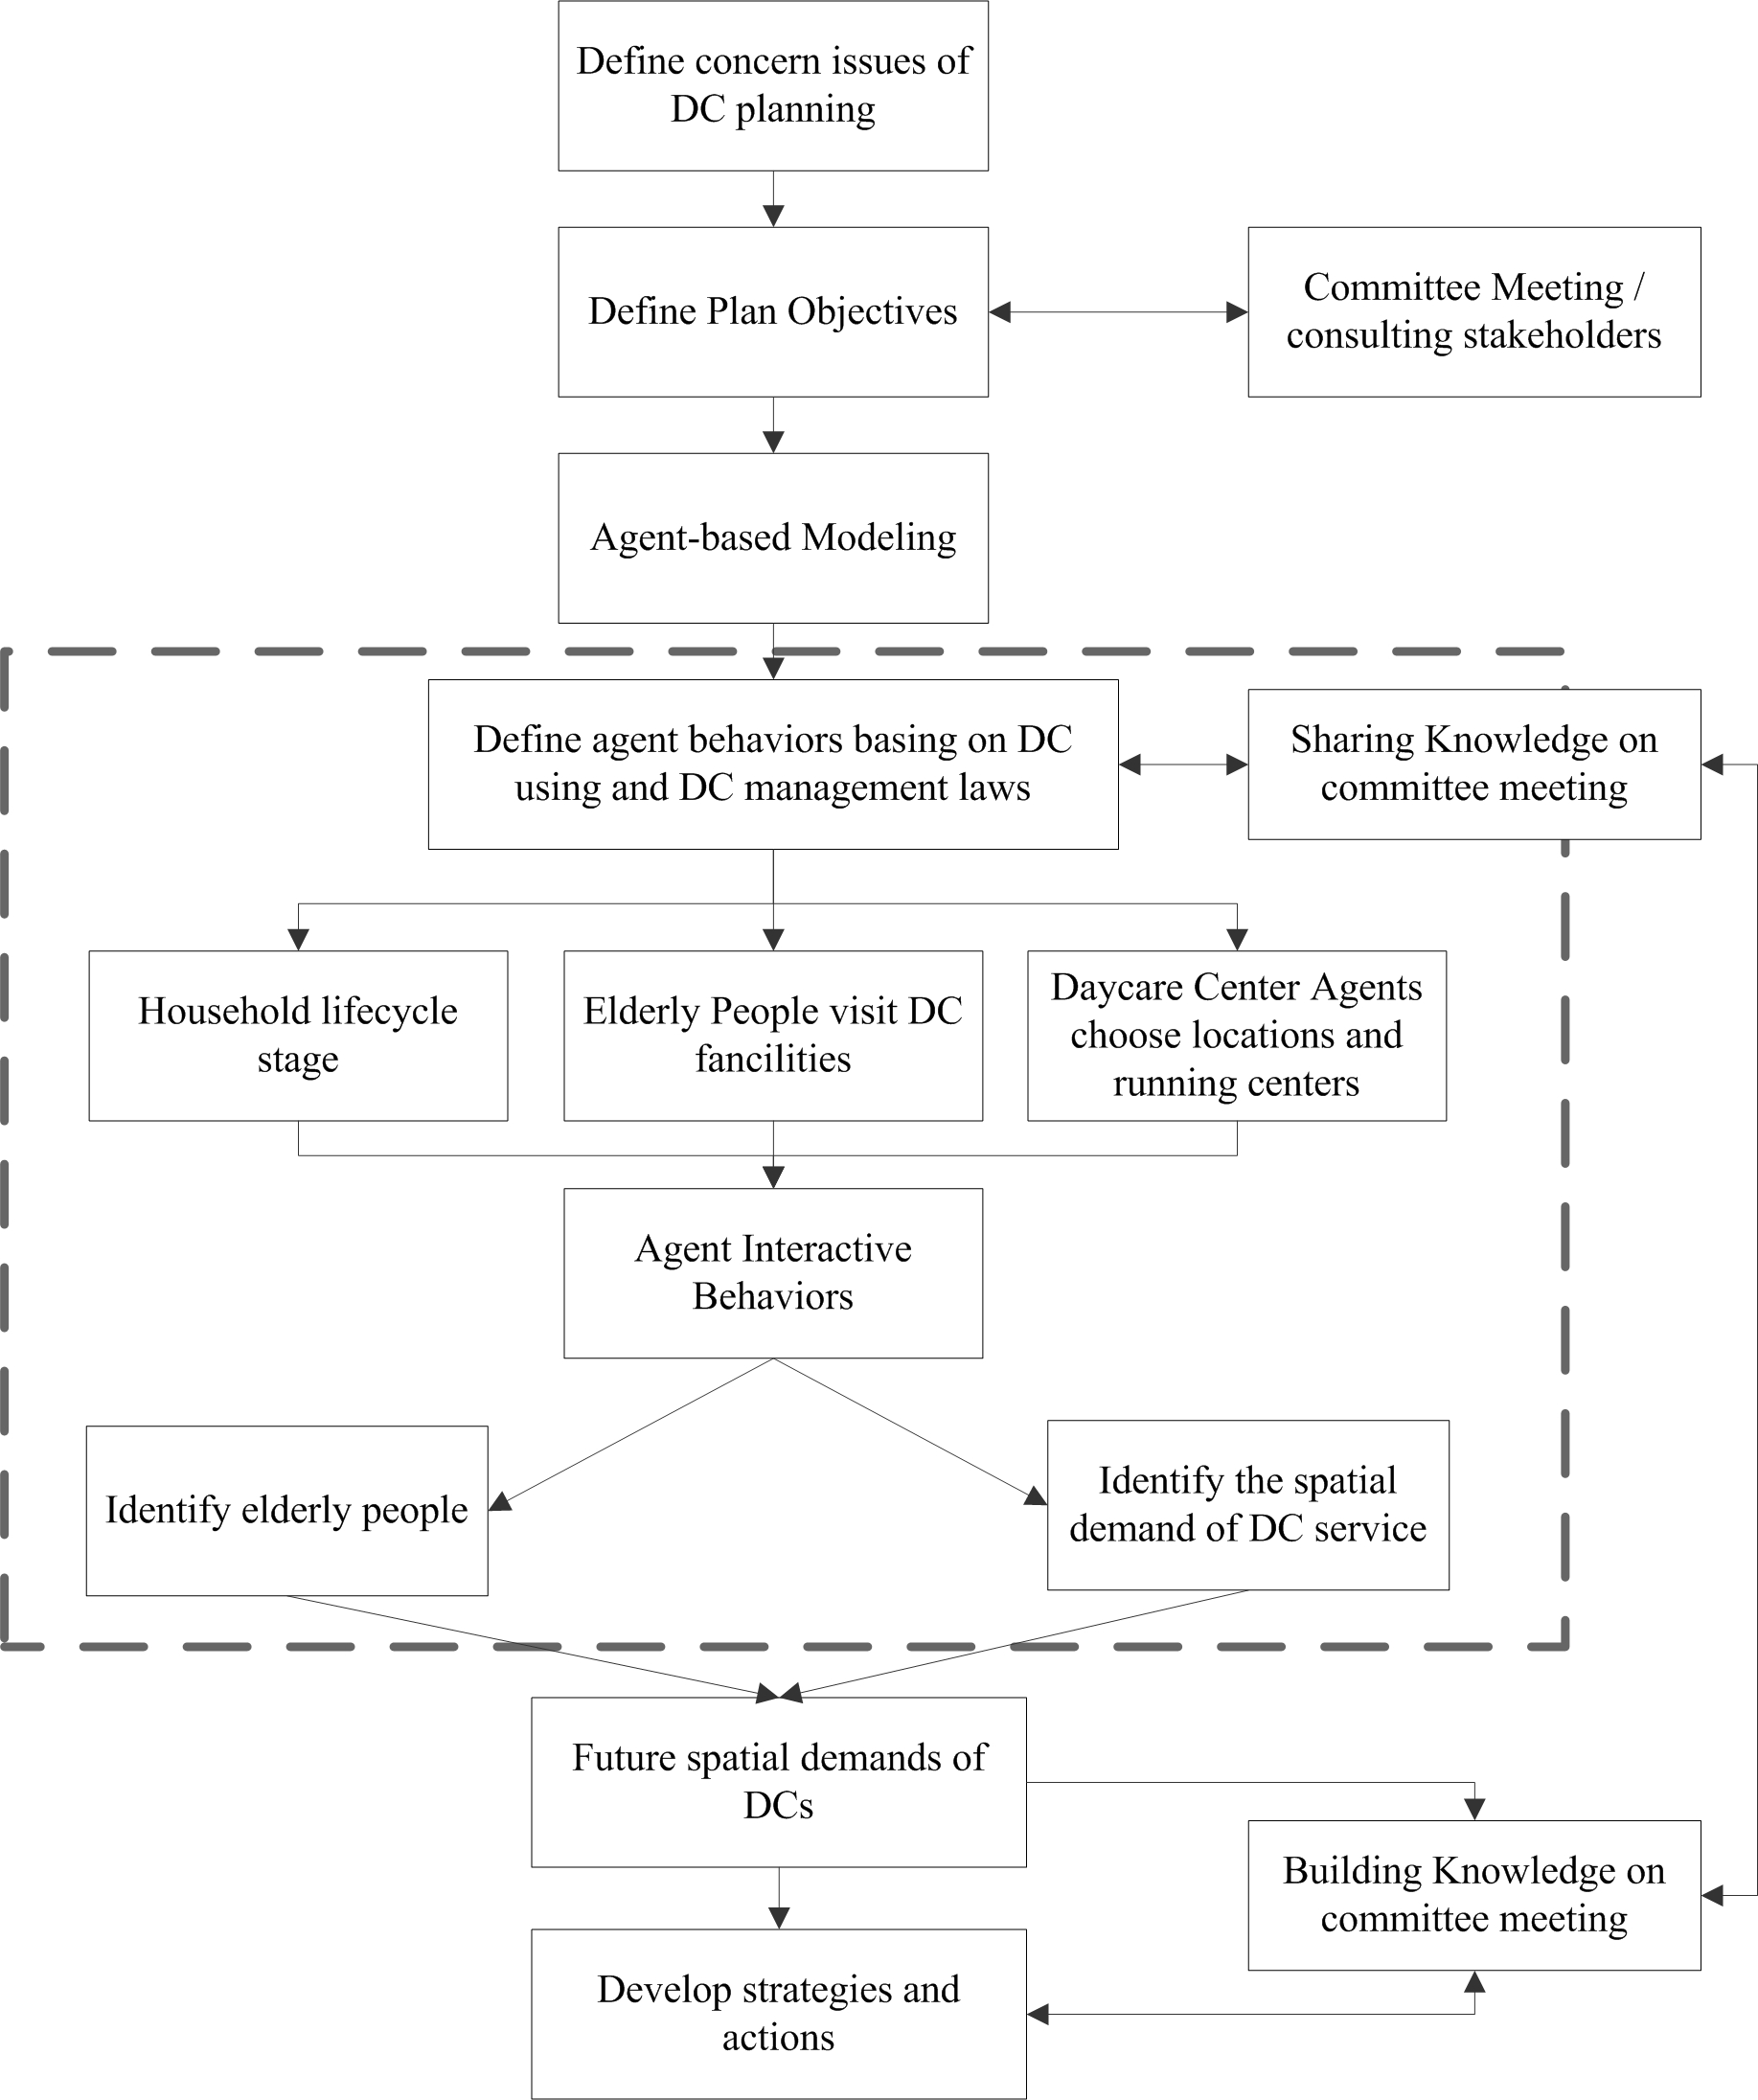
As shown as Figure 3, objectives for the DC center development strategy are defined through the committee and its consultation with stakeholders. The defined objectives are then taken as reference values for the simulation parameters. The data and parameters form the simulation input, and after background modeling, the outcomes are revealed. These outcomes were DC center locations, the elderly, and their use of DC centers. Based on this output, the planners and the committee discussed and attempted to understand the future spatial demand for DC centers. The agent-based simulation could be represented as a large open box into which the committee could put their knowledge, data, and concerns. By sharing this information with the simulation team (as shown in Figure 2), they could contribute to model development. Basic knowledge could be built from the model with the opportunity to understand the logic relationship between model input and output. Based on the knowledge acquired from the agent-based simulation, the planning strategy could then be shared by the committee (represented by the dotted line in Figure 3). Background simulation was organized through this ABM and is introduced in the next section.
Simulation Design and Dataset Preparation
Agents
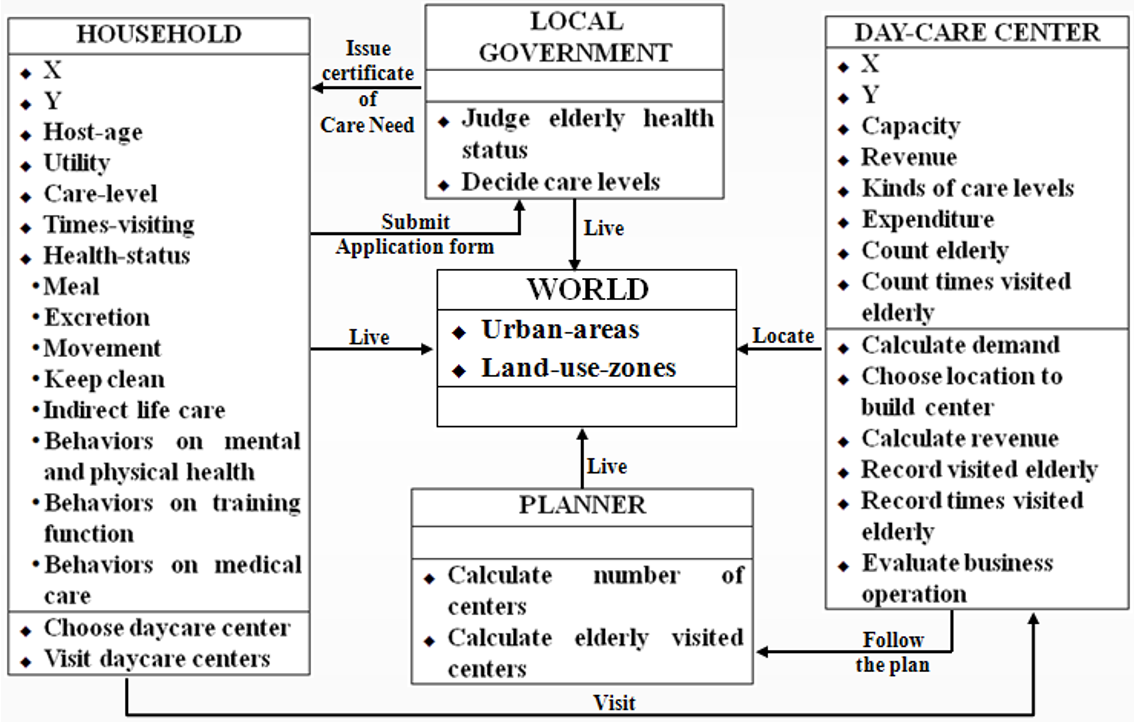
As discussed previously, the simulation team suggested that the DC center location model should be a spatially-oriented ABM with the DC center location process a demographic aging one based on interaction between agents and the urban space. The agents are the entities involved in the DC center location process. The urban space (i.e., land units) is the space where these agents live and perform different activities. Our research identified the following four agents involved in the mechanism of DC center location: household agents, DC center agents, planner agents, and local government agents. Each agent had different attributes and exhibited different but interactive behavior during simulation. They were all living in the identified urban space, which was divided into the following three areas: Downtown (CCA); Urbanization Promotion Areas (UPAs); and Urbanization Control Areas (UCAs).
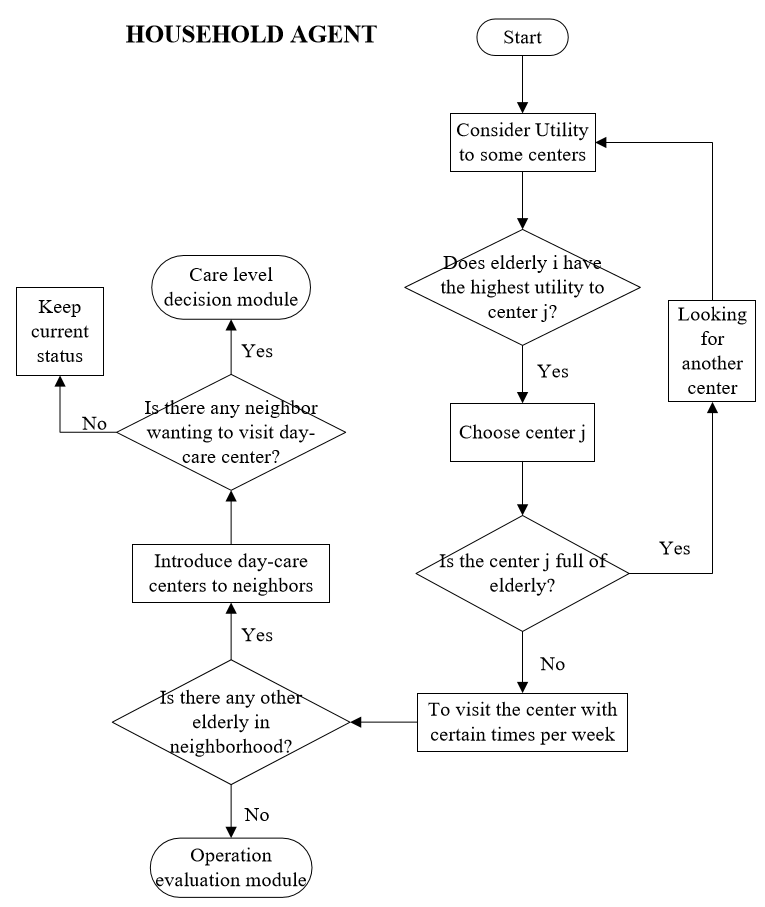
Household agent
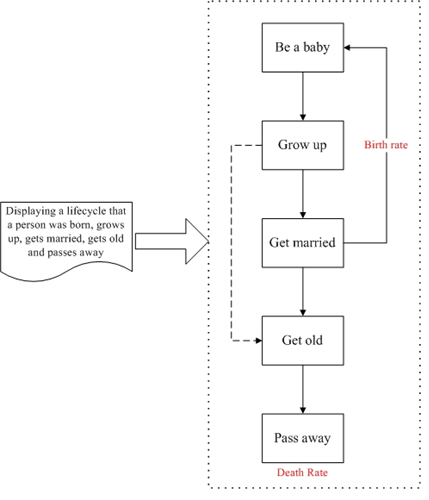
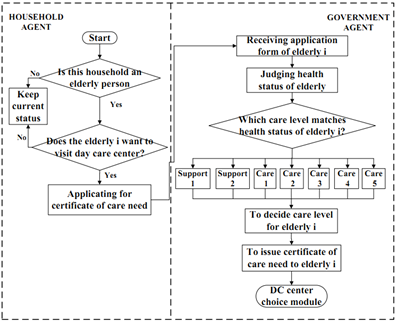
Planners need to understand the spatial and temporal demographic aging process and the locations of the elderly in order to plan the locations of DC centers. As an agent, a household is a coherent unit of simulation in the DC center location model that makes decisions as a single entity. This single entity is assumed to consist of a family of one or more people. The household agent has attributes such as age, marital status, number of members, savings, income and health status. The household agents in our simulation followed the lifecycle process presented in Figure 4 as the demographic aging process, with a house location model designed in consideration of the aging process to simulate the locations of the elderly. We divided the total lifecycle of a household into five stages. As shown in Figure 4, in the first stage (“Be a baby”), a new person is created. Married couples raise children, who “Grow up” into independent individuals. After several years of independent, single life, the individual marries and enters the third stage (“Married”). Although some people do not enter the third stage, as represented by the dotted line in Figure 4, everyone enters the fourth stage (“Grow old”). In this stage, the need for care services among the elderly household agents becomes apparent; however, our research only considered DC center services. Finally, in the fifth stage (“Pass away”), older people die and disappear from the simulation model.
Planner agent
The committee members were planners and officers; however, they were not “planner agents,” a separate role that plans DC center locations. The planner agent controls total demand and locations of future DC centers based on the total elderly population and land use zones.
DC center agent
The DC center agents in our research were responsible for constructing and managing DC centers within the planning period between 2011 and 2030, based on the location of the elderly who are expected to use these services. DC center agents use attributes such as spatial location, service type, capacity for visitors, and expenditure and revenue, drawing on the knowledge of the DC center team. DC center agents make decisions on the location and the daily operations of DC centers. Simulated locations and their operational situations were important variables for the planning strategy of our committee.
Government agent
A government agent differs from a planner agent. In Japan, the elderly are covered by national health insurance when using health care facilities. However, the care levels and types of services elderly persons require are determined by the government based on an evaluation of their health status. In our model, “government agent” refers to the individuals who implement these evaluations and determinations.
Interactive Roles of Agents
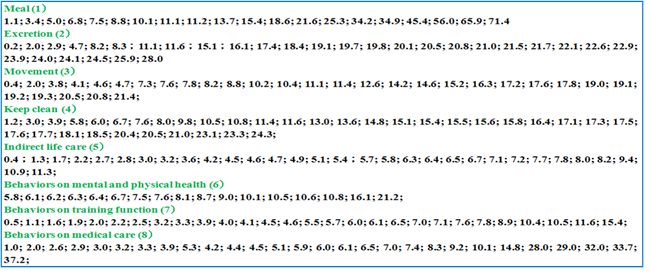
Agent roles and activities were determined by the committee through discussions of available information. For example, for DC center agents to establish center locations they followed the plans provided by the planners. According to information from the elderly people team, elderly agents who want to use DC centers apply for a care level certificate from the local government. After their application, the government agent estimates the health status of the applicant based on eight determinants, such as diet, mobility, toileting procedure, and so on, and issues these certificates to elderly agents. After receiving their care level certificate, elderly persons attend a chosen DC center a specified number of times per week. Finally, DC center agents keep attendance records, calculate revenue, and compare revenue with expenditures to assess financial viability. Figure 5 demonstrates these determinants in further detail. The next section discusses choice of DC center agent location, care level certification by the government agent, use of the DC center by the elderly agent, and work of the DC center agent, based on the committee findings.
Choice of location of DC centers
According to the law for opening DC centers in Japan, the DC center agents follow the decision tree shown in Figure 6 to select a location. A DC center agent must first specify the location of elderly persons in each cell who wish to attend a DC center. They then calculate demand for DC centers within each cell in different urban areas. This demand indicates the number of elderly persons who want to attend DC centers in an area, within a radius of the maximum service distance. The DC center agent then compares the demand in each cell with a threshold to set that location as a potential site. A minimum demand threshold of 15 elderly persons is required to build a DC center in one cell. The following equation is used for calculating demand in one cell:
| $$D_j = \sum_{i=1}^{n} a_i x y_i$$ | (1a) |
| $$ \text{Subject to} \quad y_i = \begin{cases} 0 & if \quad d_{ij} > S{max} \\ 1 & if \quad d_{ij} < S{max} \end{cases}$$ | (1b) |
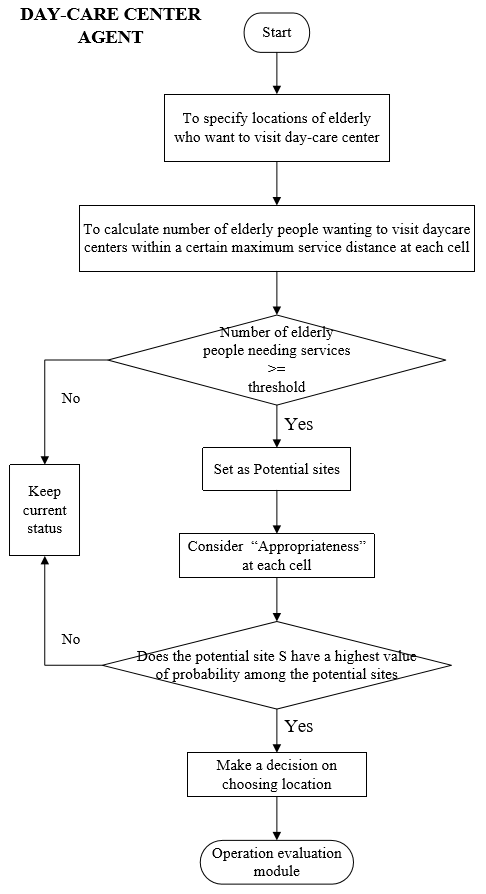
Next, the DC center agent evaluates the appropriateness by factors such as land use zone and distance from a hospital. The probability of whether a cell will be chosen for building a DC center is then calculated. In this paper, we applied logistic regression (Long et al. 2008) to calculate this probability, as represented by the following equations:
| $$\begin{split}S_{ij} = S_0 + \beta_1 \times f_{zone1} + \beta_2 \times f_{zone2} + \beta_3 \times f_{zone3} + \beta_4 \\ \times f_{zone4} + \beta_5 \times f_{zone5} + \beta_6 \times f_{zone6} + \beta_7 \times f_{zone7} + \beta_8 \times f_{zone8} \\ + \beta_9 \times f_{center} + \beta_{10} \times f_{hospital} \end{split}$$ | (2) |
| $$p_g^t = \frac{1}{1 + e^{[-s_{ij}^t-p_{av} \pm 1]}}$$ | (3) |
| $$p_f = e^{a[-1+(\frac{p_g}{p_{g max}})]}$$ | (4) |
Finally, the DC center agent chooses the site with the highest probability as the location of the DC center.
Certificate of care needs for elderly agents
When government agents issue certificates to elderly agents, interaction occurs. Government agents make decisions specifying care levels for elderly agents based on their health status, as shown in Figure 7. As shown in Figure 8, we designed a simulation process to mimic the behavior of the government agents who issue certificates to elderly persons. First, elderly persons who want to attend DC centers submit their health status documents to the government agent, choosing scores for each determinant shown in Figure 7. The government agent then calculates a health score for each elderly agent by summarizing the scores selected by that elderly person. Finally, to specify the care level, the government agent compares the health scores with the classification table of care levels shown in Table 1.
| Support 1 (S1) | Support 2 (S2) | Care 1 (C1) | Care 2 (C2) | Care 3 (C3) | Care 4 (C4) | Care 5 (C5) | |
| T=1+...+8 | 25≤T<32 | 32≤T<40 | 40≤T<50 | 50≤T<70 | 70≤T<90 | 90≤T<110 | T≥110 |
Elderly agent choice of DC center
Elderly agents follow the decision tree shown in Figure 9 to select which DC center to attend. We assumed that the distance from an elderly agent’s house to the DC center was the only criterion; that is, they will choose the nearest center. However, they may be asked to move to another center if their primary choice is full. This module also represented interaction between elderly agents. An elderly agent who has attended a DC center may introduce that center to their neighbors and ask them if they would like to attend the DC center together. In our model, elderly agents living in an area within a 100-meter radius, which corresponded to two cells in the model, of those who have attended DC centers were considered neighbors.
DC center agent operation
In the DC center location model, DC centers do not operate indefinitely. Instead, DC center agents decide on the continued operation of centers based on revenue. This process within the model was based exactly on that used in reality. The model examined the behavior of DC center agents in recording the number of elderly agents who attended the DC centers according to different care levels. They also calculated revenue for one year and compared this to expenditures in order to ensure that DC centers could continue operating. If the revenue of a DC center is lower than its expenditure, the center will go bankrupt and be eliminated from the urban space. We suggested the following equation for calculating revenue:
| $$R = \sum_{i=1}^7 N_i \times P_i \times F_i \times ra \times 52$$ | (5) |
In summary, the simulation model was designed based on the knowledge and suggestions of the committee. This made the model less of a black box to planners during the simulation. To ensure DC center management and changes to households in the simulation matched real changes in Kanazawa, we developed a validation process for the model by comparing simulated results with actual census survey data and DC center location information.
Model Application and Planning Knowledge
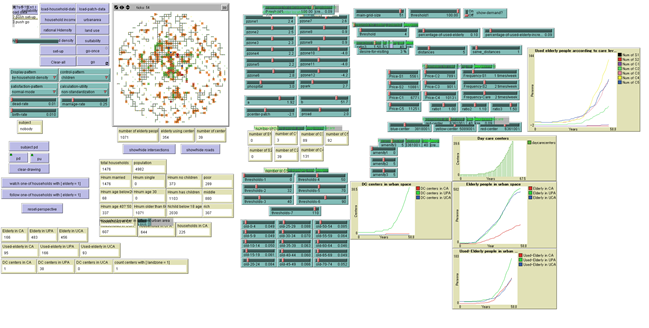
In the previous section, we discussed how the simulation model was designed using the knowledge of the committee teams. In this section, we attempt to assess the actual situation of Kanazawa city and investigate how the committee planners used the simulation tool to develop their knowledge of agent behaviors and DC center demand for a DC center planning strategy. In regard to the validation of the agent-based simulation, we focused on system validation and system application. The interface of the system is showed in Figure 10. It is developed on Netlogo platform, which is authored by Uri Wilensky in 1999.
Simulation Configurations
Committee assumptions
The data available from committee and the local government database were limited, so some assumptions were necessary for the simulation. In consensus with committee members, the following assumptions were therefore made based on the actual circumstances in Kanazawa city:
- Statistical data in Kanazawa city provided by local government officials indicated that the number of people moving in and out of the area has remained constant each year from 2002 to 2011. Therefore, we assumed the migration population to be zero until 2030, the final target year of the research project. Members recognized the element of uncertainty involved with this assumption and agreed to carry out the simulation under this simplified condition.
- DC centers are situated based on zone regulations on land use in Japan. This assumption was agreed upon as common knowledge between committee members.
- One tick in the simulation represents one year. The committee agreed that it was unnecessary to simulate too far ahead as the planning strategy is adjusted each year; therefore, one year was considered one step.
- We made some assumptions from information from the DC center team. First, elderly persons wishing to use DC centers will choose the nearest center if it is not full. Second, there are three types of DC centers with different capacities (15, 20, and 25 users) indicating the maximum number of elderly persons that a DC center can serve at one time. Higher capacity DC centers incur higher expenditures. Finally, when calculating demand, DC center agents consider the number of elderly persons living within a 2.5-km radius, which corresponds to 50 cells, of the potential DC center location.
Parameters
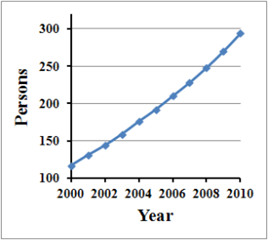
Land use zones and urban planning were based on Japanese law with no obvious changes until the year 2000; therefore, the only data changing over time is household data. To accommodate this, we used population data for Kanazawa city for 2000 as the initial population (Figure 11) of elderly persons, and began the simulation from the year 2000 with six existing DC centers.
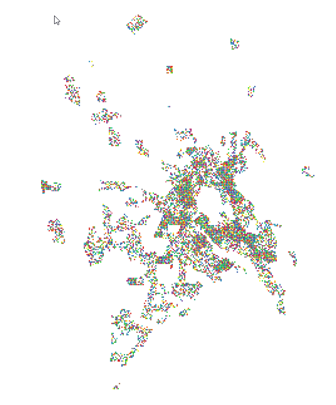
The elderly people team collected statistical data on Kanazawa city and conducted a sample survey on the housing situation and community activities of the elderly, as an investigation of the entire population of Kanazawa was not feasible. A random sampling procedure covering a total of 6,825 household agents living in the urban area was used. This number was based on the actual number of households in the year 2000, and consisted of 3.8% of the 177,686 households in Kanazawa (Figure 11). Birth, death, and marriage rates, at 0.9%, 0.8%, and 0.59%, respectively, were assumed to be similar to those during the period from 2002 to 2011. To set the initial input data, we used the same ratio of elderly agents to total population and the same ratio of elderly persons who attended DC centers to the number of elderly persons as the actual 2000 data, at 0.16 and 0.107, respectively. Therefore, we initially calculated 1,098 elderly agents, including 117 elderly agents who attended DC centers. The details of the initial parameters for simulation are shown in Table 2.
| Parameter Name | Predefined Data | |
| Global paramaters | Birth rate | 0.90% |
| Death rate | 0.80% | |
| Couple rate | 0.59% | |
| Attributes of the urban space | Land use zone | 12 types of land use zones, land use zones in 1985, Kanazawa city |
| Household density | Household numbers based on Floor Area Ratios, based on land use zones | |
| Planning areas | CCA (4%), UPA (32%), UCA (64%), urban planning in 1985, Kanazawa city | |
| Attributes of households | Income | Low (20%), middle (60%), and high (20%) |
| Location | Coordinates x, y | |
| Household number | 6825 household agents, 3.8% of total households in Kanazawa city in 2000 | |
| Household age | According to household lifecycle stages described in Fig. 4 | |
| Elderly household | 1098 elderly agents, makes up 16% of total households, the ratio in Kanazawa city in 2000 | |
| Ratio of elderly households attending DC centers | 10.7%, the ratio of those in Kanazawa city in 2000 | |
| Attributes of DC centers | Capacity | 15, 20, and 25 elderly visitors, respectively |
| Location | CCA, UPA, Coordination x, y | |
| Existing DC centers | Six existing DC centers in 2000 |
For the simulation assumptions and parameters, collecting data and reaching consensus through cooperation with other teams and local government officers was straightforward, and therefore easily applicable in planning strategy practice.
Simulation Results
We attempted to analyze the topics discussed in the planning committee meetings in order to view how planners understood and accepted simulation outputs. Model validation was useful for demonstrating to the planners that the simulation was technically sound. With acceptance from planners, it would be possible for planning strategies to be devised based on predicted results from future simulations.
Model testing and validation
The simulation results showed the location of households and DC centers. The DC centers and elderly people teams doubted that the location of households and DC centers in the simulation outputs was reasonable. For example, the simulated location of households and DC centers for 2010 differed from actual locations in Kanazawa city for the same year. Household locations were difficult to present to the committee due to the large number of communities in the area.
During meetings, we explained that the simulation provided an accurate distribution of DC centers in different urban areas and the corresponding number of elderly agents who attended the centers, but did not give detailed location coordinates of the centers. Our simulation results could predict trends in DC center development and the needs of the elderly for Kanazawa city, supplying planners with a reference point for DC center planning. Next, we validated the simulation results for the years 2000 through 2010 using actual census survey data for 2010 for Kanazawa city. We also showed predictions of the locations and numbers of DC centers in different urban areas and the numbers of elderly persons who would attend them in 2030. This enabled team members to understand how model validation demonstrates the validity of the simulation results.
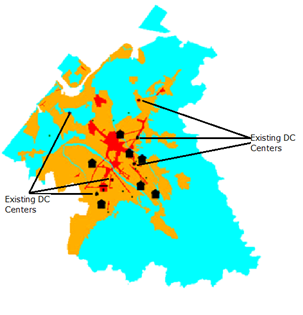
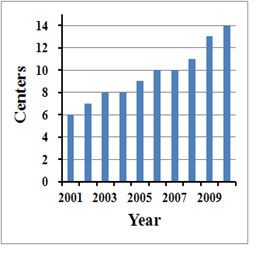
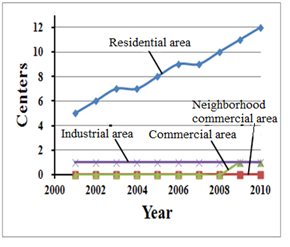
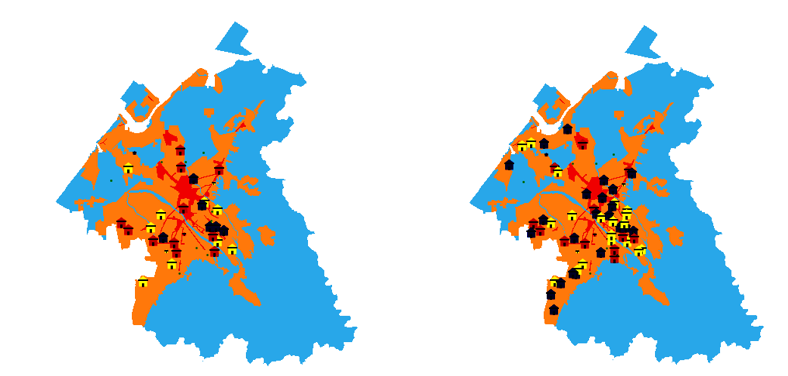
The entire model test for validation was repeated 30 times using the value parameters listed in Table 2. One tick in the simulation represents one year, and 30 ticks are simulated in each experiment. The results therefore represent the 30-year period from 2000 to 2030. One simulation experiment took 45 hours, so a total time of 1,350 hours was required to obtain the simulation results for all 30 experiments. We explained the simulation results in detail so that team members could understand why the simulated and actual locations were different. Figure 12 shows the simulation results for the distribution of DC centers for 2010. Small house symbols represent existing DC centers with the same coordinates as actual centers in 2010. Large house symbols represent the simulated DC centers. The simulation results over the 30 experiments provided an average of 14 DC centers (Figure 13), 86% of which were located in residential areas, 7% in commercial areas, and 7% in industrial areas (Figure 14), which are similar to the actual percentages of 68%, 6%, and 24%, respectively, for Kanazawa city. As planners tend to concentrate DC centers in residential areas, UCAs and UPAs are the focus, with most industry land use zones located in CCA. Therefore, the number of DC centers located in industrial areas is smaller than the actual percentage.
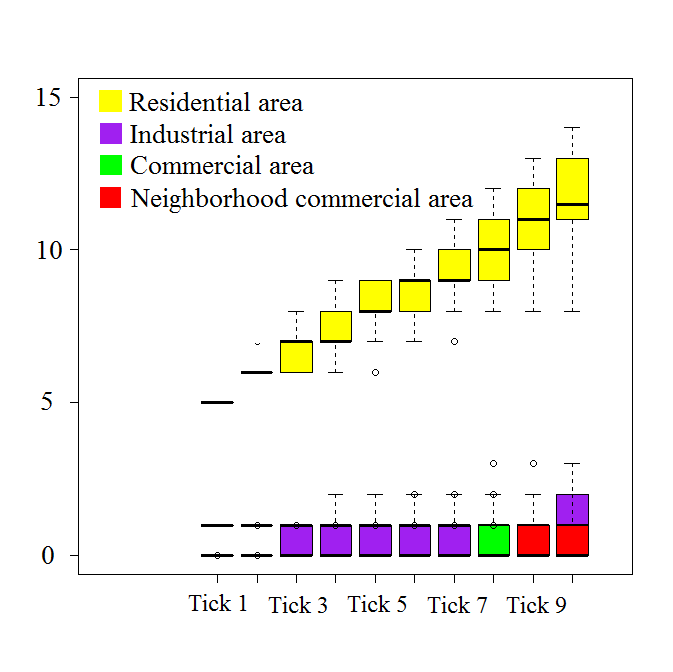
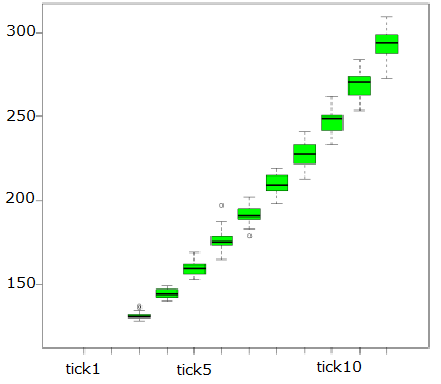
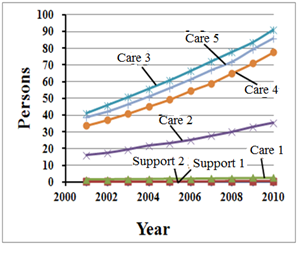
To discuss the stability of the simulation results, we represented the changes in the results throughout the 30 experiments (Figure 15 and Figure 16). Up until 2010, the number of DC centers from the simulation results approached nearly 10% of the actual data (138 centers in 2010; http://www.pref.ishikawa.lg.jp/ansin/list/list.html). Figures 17 and 18 show the simulation results for the number of elderly persons at different care levels attending DC centers. Figures 13 to 18 show changes in numbers of DC centers across urban land use zones and changes in the number of elderly agents attending DC centers throughout the 30 experiments. These figures confirm that the simulation results for the number of DC centers and elderly agents who attended them were statistically stable throughout the 30 experiments.
A comparison between the simulated results and census survey data is shown in Table 3 (http://www.mhlw.go.jp/topics/kaigo/toukei/joukyou.html). This comparison displays the actual number of elderly agents who attended DC centers for 2000 and 2010, which increased 2.3-fold from 2000 to 2010. The simulated result for this item was 2.5-fold, which was similar to the actual statistical value.
Finally, the committee understood that locations could not be precisely simulated, but general trends can be checked across urban areas. They also understood that the location of the elderly population is the key factor in simulating DC center location. Despite their surprise that the simulation tool integrated many factors within one platform, it remained difficult for them to consider the result based on the agreed parameters in the previous step, as they had difficulty connecting these parameters to the simulation. They attempted to understand this method of location of DC centers, as it is a key topic in planning strategy, even if they were unable to perfectly understand the detailed mechanism of DC center demand simulation. Most importantly, they understood the steps in the simulation process and the relationship between each step as they shared information during the simulation design phase. Therefore, through the committee meetings, we were able to predict DC center locations to the target year of 2030.
| Living area | Number of elderly persons who attended DC centers | Number of elderly persons who attended DC centers | Increase in elderly attendance at DC centers | ||
| 2,000 | 2,010 | ||||
| Census survey data | 177,686 households | Kanazawa City | 7,795 | 18,072 | 2.3-fold |
| Simulated data | 6,825 households | CCA, UPA, UCA | 117 | 294 | 2.5-fold |
Forecasting DC center distribution to 2030
In the previous subsection, we discussed model validation and the statistical stability of our simulation results, which confirmed that the DC center location model was applicable and reliable for predicting DC center distribution in urban areas and the numbers of elderly persons using the centers, and suggesting that committee members could consider simulations as a possible planning strategies for future DC centers.
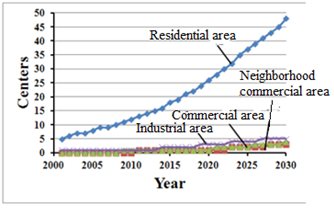
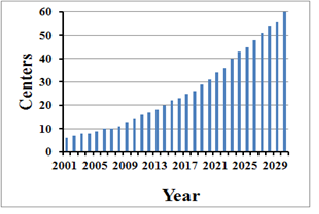
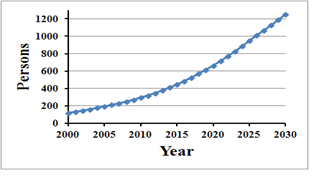
In this subsection, we further implement our simulation model for the location of DC centers and predict the number of elderly persons who will use these centers up to 2030. This experiment was also repeated 30 times. The corresponding forecasts are indicated by Figures 19 to 23. The simulated results predicted 60 DC centers and 1,252 attending elderly agents to 2030. The number of DC centers and elderly persons who will use them in 2030 increased 4.3- and 4.2-fold, respectively, from 2010.
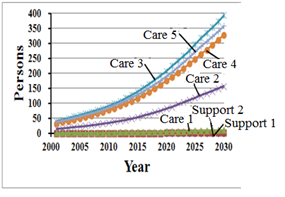
However, as shown in Figures 18 and 22, the numbers of elderly persons at S1, S2, and C1was almost zero. This result seemed unreasonable to the committee. We explained that the reason for this was probably because we had no dataset for the health status of the elderly, and we therefore had to simulate this for each elderly agent using the random process introduced in section 3.2.2. A reliable dataset would solve this problem. This confused the committee members, and suggested that if agent-based simulation is used for a planning strategy, a reliable and complete actual dataset relevant to the simulation inputs and model parameters is necessary. Otherwise, there is a risk that the committee may not fully trust the simulation, making an ABM less useful in planning practice.
Planning Strategies for DC Centers
It was evident from the results in subsection 4.13 that obvious predictions could be made to the year 2030, i.e., that the number of elderly persons will continue to increase rapidly, and that DC center services need to increase accordingly; the committee reached consensus on this matter. Our simulation informed planners and governors that local governments must work on the planning of care facilities in the area. By 2030, nearly four times the total number of DC centers in 2010 will be needed. The committee accepted our simulated prediction of this trend, but doubted our predicted results based on the relative amount of different care levels required to 2030 because we did not use an actual health status dataset in our simulation. Despite our explanation that the related health status parameters were repeatedly adjusted throughout the model validation process to fit the actual situation, the committee continued to express doubt.
Our simulation results suggest that new DC centers will be mostly centralized in the CCA area, and the committee accepted this location trend. However, there was also consensus that the locations of DC centers in our simulation could not truly represent the future locations of new DC centers, and the simulation could only show the spatial needs of the elderly for DC centers based on the current situation. The simulation results can be used as reference for the spatial planning of DC centers, but they cannot be used to replace the actual location trends of DC centers. Center locations may need to be adjusted based on factors such as market demand and competition. In summary, our simulation assisted the planning committee with information on the increasing numbers of elderly persons over a 30-year time period and their potential need for DC center services. Furthermore, we assisted the planning committee in recognizing the mechanisms of the demographic aging process and DC center demand, as well as related factors affecting future DC center locations. Although the results could not be used directly for DC center planning, planners were provided with more comprehensive information for their planning strategies.
Conclusions and Future Work
Based on our findings, conclusions can be drawn on two distinct aspects: agent-based simulation for DC center location planning in Kanazawa city, Japan, and the application of agent-based simulation to inform planners in planning practice. For the former, an ABM simulating the process of DC center development in a local Japanese city was introduced and illustrated. This model was developed based on the institutional mechanism of Japanese DC center development. We combined with our model with household lifecycle simulation to predict the future age structure of the population of Kanazawa city. A representative characteristic of this Japanese-style model is that it includes data on government-issued health certificates for the elderly and the supply of DC center services. With the government-issued health certificates, elderly persons, the elderly agents in the model, may use DC centers with their health insurance. Therefore, the agent-based DC center location model could competently simulate the entire Japanese DC center development process.
The outcomes of the 30 simulation experiments proved to be statistically stable, validated by census survey data from 2010. The number of elderly persons who used DC centers in 2010 increased 2.3-fold from 2000, which was close to the simulated result of 2.5-fold, confirming that this increase could be statistically predicted by our model. Our model was also able to predict the future distribution of DC centers in Kanazawa city and the number of elderly persons who will use them. The potential distribution of DC centers in different urban areas to 2030 suggests the need for different levels of DC center services. Compared with traditional methods of statistical analysis, our model used complex interactive behaviors based on existing DC center issues, providing planners with a more vivid visualized reference.
Some consensus was reached by the committee based on our results. First, the total number of DC centers needs to increase in accordance with the increase in the elderly population, an observation that was evident from our simulation and useful to planners. The planning committee accepted our prediction of this trend for 2010 to 2030, but doubted our prediction on the demand for different care levels due to the lack of an actual health status dataset for the elderly population in our simulation. Although we adjusted for this in the model validation process, doubts remained. Second, although the planning committee could accept location trends based on our simulation, they felt this could only be spatial demand based on the current situation, and that our simulation could not accurately represent the future location of new DC centers because their location may need to be adjusted based on market competition.
Although the simulation results were not used directly for DC center planning, they did assist the committee with information on trends affecting the elderly and the need for DC center services in different urban areas. The modeling also helped the committee recognize the complex factors affecting future DC center locations. Most of the doubts remaining among the committee stemmed from uncertainty regarding the reliability of the dataset used in the simulation, which lacked information on health status.
Within the planning process, our simulation could be used at the very beginning to provide planners with knowledge on the mechanisms of DC center demand and assist them in planning further strategies. Our findings suggest that it is necessary for planners and policy makers to consider demographic aging processes, operative management processes of facility owners, and other factors when considering the future locations of new DC centers. In addition, the design of an ABM should be based on relevant regulations and laws in order to reflect actual human decision-making processes, which represents one type of interaction between agents in a simulation. Furthermore, our results suggest that for an agent-based simulation to be useful and trusted by planners, a reliable and complete dataset is necessary.
References
ARSANJANI, J.J., Helbich, M. & de Noronha Vaz, N. (2013) Spatiotemporal simulation of urban growth patterns using agent-based modeling: The case of Tehran. Cities, 32, 33-42. [doi:10.1016/j.cities.2013.01.005]
BATTY, M., Torrens, P. M. (2005). Modelling and prediction in a complex world. Futures, 37, 7, 745-766. [doi:10.1016/j.futures.2004.11.003]
CHEN, P., Shen, Z. & Kawakami, M. (2006). Study on development and application of MAS for impact analysis of large-scale shopping center development. Journal of the City planning institute of Japan, 41, 3, 271–276.
D'ALESSANDRO, S. (2007). Non-linear dynamics of population and natural resources: The emergence of different patterns of development. Ecological Economics, 62, 3, 473-481. [doi:10.1016/j.ecolecon.2006.07.008]
DAVIS, P., Lay-Yee, R. & Pearson, J. (2010). Using micro-simulation to create a synthesised data set and test policy options: The case of health service effects under demographic ageing. Health Policy, 97, 2, 267-274. [doi:10.1016/j.healthpol.2010.05.014]
DEKLE, R. (2004). Financing consumption in an aging Japan: The role of foreign capital inflows and immigration. Journal of Japanese and International Economies, 18, 4, 506-527. [doi:10.1016/j.jjie.2004.08.003]
FAROOQ, B., Bierlaire, M., Hurtubia, R. & Floeoed, G. (2013). Simulation based population synthesis. Transportation Research Part B, 58, 243-263. [doi:10.1016/j.trb.2013.09.012]
FARUQEE, H., Mühleisen, M. (2003) Population aging in Japan: demographic shock and fiscal sustainability. Japan and the World Economy, 15, 2, 185-210. [doi:10.1016/S0922-1425(02)00017-8]
FILATOVA, T., Parker, D. & van der Veen, A. (2009) Agent-Based Urban Land Markets: Agent’s Pricing Behavior, Land Prices and Urban Land Use Change. Journal of Artificial Societies and Social Simulation, 12(1), 3: https://www.jasss.org/12/1/3.html.
FOGARTY L., Creanza N., Feldman M.W. (2013), The role of cultural transmission in human demographic change: An age-structured model. Theoretical Population Biology, 88, 68-77. [doi:10.1016/j.tpb.2013.06.006]
FOUGÈRE, M., Harvey S., Mercenier J. & Mérette M. (2009). Population ageing, time allocation and human capital: A general equilibrium analysis for Canada. Economic Modelling, 26, 1, 30-39. [doi:10.1016/j.econmod.2008.05.007]
FRAUENTHAL, J. C. (1975). A Dynamic Model for Human Population Growth, Theoretical Population Biology, 8, 1, 64-73. [doi:10.1016/0040-5809(75)90039-8]
GUEST, R. S. (2006). Population ageing, capital mobility and optimal saving. Journal of Policy Modeling, 28, 1, 89-102. [doi:10.1016/j.jpolmod.2005.05.010]
HE J.H, Liu Y.L, Yu Y., Tang W.W., Xiang W.N., Liu D.F. (2013). A counterfactual scenario simulation approach for assessing the impact of farmland preservation policies on urban sprawl and food security in a major grain-producing area of China. Applied Geography, 37, 127-138. [doi:10.1016/j.apgeog.2012.11.005]
HOSSEINALI, F., Alesheikh, A.A., Nourian, F. (2013). Agent-based modeling of urban land-use development, case study: Simulating future scenarios of Qazvin city. Cities, 31, 105-113. [doi:10.1016/j.cities.2012.09.002]
HUANG, A. & Levinson, D. (2011). Why retailers cluster: an agent model of location choice on supply chains. Environment and Planning B: Planning and Design, 38, 1, 82-94. [doi:10.1068/b36018]
IHIRO, T., Kato, R. R., Kawade, M. & Bessho, S. (2011). Health insurance reform and economic growth: Simulation analysis in Japan. Japan and the World Economy, 23, 4, 227-239. [doi:10.1016/j.japwor.2011.07.003]
JIMENO, J. F., Rojas, J. A. & Puente, S. (2008). Modelling the impact of aging on social security expenditures. Economic Modelling, 25, 2, 201-224. [doi:10.1016/j.econmod.2007.04.015]
LE, Q. B., Park S. J., Vlek Paul L. G. (2010). Land Use Dynamic Simulator (LUDAS): A multi-agent system model for simulating spatio-temporal dynamics of coupled human - Landscape system 2. Scenario-based application for impact assessment of land-use policies. Ecological Informatics, 5, 3, 203-221. [doi:10.1016/j.ecoinf.2010.02.001]
LONG, Y., Shen, Z., Du, L., Mao Q. & Gao, Z. (2008). BUDEM: An urban growth simulation model using CA for Beijing metropolitan area.The Geoinformatics and Joint Conference on GIS and Built Environment: Geo-simulation and Virtual GIS Environments, SPIE 2005. 2005, 7143-71431D.
MA, Y., Shen, Z. & Kawakami, M. (2013). Agent-Based Simulation of Residential Promoting Policy Effects on Downtown Revitalization. Journal of Artificial Societies and Social Simulation 16(2), 2: https://www.jasss.org/16/2/2.html. [doi:10.18564/jasss.2125]
MAOH, H., Kanaroglou, P, Scott, D., Paez, A. & Newbold, B. (2009). IMPACT: An integrated GIS-based model for simulating the consequences of demographic changes and population ageing on transportation. Computers, Environment and Urban Systems, 33, 3, 200-210. [doi:10.1016/j.compenvurbsys.2008.10.004]
MERCADO, R., A. Páez, K. B. Newbold (2010). Transport policy and the provision of mobility options in an aging society: a case study of Ontario, Canada. Journal of Transport Geography, 18(5), 649-661. [doi:10.1016/j.jtrangeo.2010.03.017]
MIELCZAREK, B. (2013). Simulation modelling for contracting hospital emergency services at the regional level. European Journal of Operational Research, 235, 1, 287-299. [doi:10.1016/j.ejor.2013.10.061]
NINTEICHOUSAINMANYUARU (2006) (認定調査員マニュアル, 2006) (in Japanese).
PETERSON, P. G. (1999). Gray Dawn: The Global Aging Crisis. Foreign Affairs (January/February), 42-55. [doi:10.2307/20020238]
PULESTON, C. O., Tuljapurkar S. (2008). Population and prehistory II: Space-limited human populations in constant environments. Theoretical Population Biology, 74(2), 147-160. [doi:10.1016/j.tpb.2008.05.007]
SATO, Y. (2001). Comparative Analysis of health care costs in Japan and the United States: a simulation of productivity and savings behavior. Japan and the World Economy, 13, 4, 429-454. [doi:10.1016/S0922-1425(01)00066-4]
SCHULZ, E., Leidl, R. & König, H.-H. (2004). The impact of ageing on hospital care and long-term care - The example of Germany. Health Policy, 67, 1, 57-74. [doi:10.1016/S0168-8510(03)00083-6]
SHEN, Z., Ma, Y., Kawakami, M. & Nishino, T. (2012). Development of Agent-Based Model for Simulation on Residential Mobility Affected by Downtown Regeneration Policy, (pp. 201–211). Springer. [doi:10.1007/978-3-642-29934-6_20]
SHPAK, M., Orzack, S. H. & Barany, E. (2013). The influence of demographic stochasticity on evolutionary dynamics and stability. Theoretical Population Biology, 88, 47-56. [doi:10.1016/j.tpb.2013.06.005]
TABATA. K. (2005). Population aging, the costs of health care for the elderly and growth. Journal of Macroeconomics, 27, 3, 472–493. [doi:10.1016/j.jmacro.2004.02.008]
ur RAHMAN, S., Smith, D. K. (2000). Use of location-allocation models in health service development planning in developing nations. European Journal of Operational Research, 123, 3, 437-452. [doi:10.1016/S0377-2217(99)00289-1]
VALDEMARSSON M., Jernryd, E. & Iwarsson, S. (2005). Preferences and frequencies of visits to public facilities in old age- A pilot study in a Swedish town center. Archives of Gerontology and Geriatrics, 40, 1, 15-28. [doi:10.1016/j.archger.2004.05.010]
VAN SONSBEEK, J.-M. (2010). Micro simulations on the effects of ageing-related policy measures. Economic Modelling, 27, 5, 968-979. [doi:10.1016/j.econmod.2010.05.004]
VANHAVERBEKE, L. & Macharis, C. (2011). An agent-based model of consumer mobility in a retail environment. Procedia Social and Behavioral Sciences, 20, 186-196. [doi:10.1016/j.sbspro.2011.08.024]
WARD, R. H. & Weiss, K. M. (1976). The Demographic Evolution of Human Population. Journal of Human Evolution, 5, 1-25. [doi:10.1016/0047-2484(76)90096-8]
YANG Y., Wong, K. K. F. & Wang, T. (2011). How do hotels choose their location? Evidence from hotels in Beijing. International Journal of Hospitality Management, 31(3), 675-685. [doi:10.1016/j.ijhm.2011.09.003]