
Introduction
There is widespread consensus that people participate in social gathering during emergency egress (Aguirre et al 2011a, b; Chu et al 2012; Moussaïd et al. 2010; Pluchino et al. 2014). Group members are often connected through pre-existing social relationships, e.g. familial or friendship, and their behavior is significantly affected by such social affiliations (Santos et al. 2004; Moussaïd et al. 2010; Aguirre et al. 2011b; Chu et al 2012). Participants tend to interact with each other and stay together, potentially increasing the dangers they collectively face (Johnson et al. 1994; Cornwell 2003). Yet, of the many egress models that have been published to date, only a few are able to adequately handle social interaction and social emergence involving groups of evacuees (Santos et al 2004; Aguirre et al 2011a). Moreover, aside from a few cases, most existing models lack validation of their simulated results by real-world processes (Aguirre et al 2011a).
To address such gaps, this paper employs the agent-based egress simulation tool, EgressSFM, developed by Fang et al. (2016a and 2016b). Agent-Based Modeling (ABM) is broadly considered one of the most realistic and promising simulation techniques for modeling group effects during egress because of its ability to build an artificial society and generate emergent features of evacuation (Aguirre et al 2011a). In ABM, evacuees are represented by autonomous entities, termed agents. Agents have stochastic characteristics, are adaptive, and capable of interacting with the surrounding environment and other agents (Fang et al 2016b). EgressSFM is based on the Scalar Field Method (SFM), which quantitatively and comprehensively addresses agents’ autonomous behavior and the effects of social interaction among them (Fang 2015; Fang et al 2016b). EgressSFM simulates the rational ‘thinking’ process of an agent and simultaneously takes into account a complex network of relationships at the social level. EgressSFM has also been extensively validated, as described in Fang et al. (2016a and 2016b). The implications of these validation exercises are discussed later on in the paper.
This study offers the results of a numerical study using EgressSFM of social relationships among the more than four hundreds evacuees of The Station Nightclub fire. The theory behind the computational platform is first summarized and background about the social organizational features of the gathering at the venue is presented. Key modeling parameters in EgressSFM are calibrated to detailed data from The Station Nightclub event. After calibration, parametric studies are conducted to quantitatively investigate the influences of the presence of social relationships and familiarity of the building floor plan on the death and injury tolls. Field information first collected by Aguirre et al. (2011b) about the persons and groups that were present at the Station during the fire is used to evaluate the validity of the results of this study.
Background
The Scalar Field Method (SFM): Theory and validation
The SFM developed by Fang et al (2016a and 2016b) assumes that the behavior of each evacuee is controlled by a rational thinking process. Agents representing evacuees can perceive surrounding entities, evaluate different potential avenues of action, desired goals and social relationships, and represent those factors through locomotion. These goals may comprise the evacuee’s need to escape through an exit, avoid collision with walls and obstacles, move towards related agents, keep given spacing to other agents, and respond to social relationships. By assuming that agents are analogous to charged particles in an electrical field, the SFM quantitatively evaluates these effects as a series of scalar quantities, termed virtual potential energies (VPEs). The VPEs from various sources can be directly added together to form a comprehensive field around an agent that signifies the additive or subtractive effects of issues of importance to the agent. Based on charged-particle-in-field analogy, an agent will seek to minimize its VPE, i.e. the lower the value of VPE, the greater will be the desire of the agent to take action, and vice versa.
The VPEs are computed through a series of functions of distances to other agents or objects in the environment. While detailed equations can be found in Fang et al. (2016b), some governing equations are shown next for the sake of completeness:
| $$E_1=c_1(d_1+D_{1a}-D_{1e}\cos(\Delta\theta_1))$$ | (1) |
| $$\begin{array}{ll} E_2 =\left\{ \begin{array}{cl} c_2\Bigl(\frac{1}{(d_2-R_A-R_{T,other})}-\frac{1}{D_{20}}+E_{2,counter}\Bigr) &\hspace {-0.4cm}, \quad d_2-2R_A < D_{20}\\ 0 &\hspace {-0.4cm}, \quad d_2-2R_A\geq D_{20}\\ \end{array} \right.\\ \end{array} $$ | (2) |
| $$\begin{array}{ll} E_3 =\left\{ \begin{array}{cl} c_3\Bigl(\frac{1}{(d_3-R_T-R_S)}-\frac{1}{D_{30}} \Bigr) &\hspace {-0.4cm}, \quad d_3-R_T-R_S < D_{30}\\ 0 &\hspace {-0.4cm}, \quad d_3-R_T\geq D_{30}\\ \end{array} \right.\\ \end{array}$$ | (3) |
Along with the desired goals, two categories of social relationships are outlined: kin-relationship (such as spouses and dating partners) and friend-relationship (such as friends and co-workers). The former is assumed to be effective over distances and stronger than the latter. The friend relationship is assumed valid for a limited distance beyond which it is considered ineffective. The governing equations for these two cases are as follow:
| $$\begin{array}{ll} E_4=\left\{ \begin{array}{cl} c_4(d_4-d'_4) &\hspace {-0.4cm}, \quad D_{4b} < d_4\\ c_4D_{4b} &\hspace {-0.4cm}, \quad D_{4b}\geq d_4\\ \end{array} \right.\\ \end{array}$$ | (4) |
| $$\begin{array}{ll} E_5=\left\{ \begin{array}{cl} c_5\sqrt{D_{50}^2-d_5^2} &\hspace {-0.4cm}, \quad D_{50}\geq d_5\\ 0 &\hspace {-0.4cm}, \quad D_{50} < d_5\\ \end{array} \right.\\ \end{array}$$ | (5) |
The computational process is described in Fang et al. (2016b). Each agent in the simulation processes a sequence of algorithmic steps of “decision-making” in every time-increment: observe and update perception; refresh sampling points for VPE computation; compute an evacuation route; estimate others’ movements; calculate VPEs to reach a locomotion decision; and execute the decision. In the second-to-last step, an agent’s locomotion is decomposed into translation and rotation. The agent needs to first consider whether to rotate or not and afterwards translates when an orientation decision is made. Both rotation and translation decisions are dependent on VPEs computations.
The value of the parameters used in EgressSFM and detailed validation studies can be found in Fang et al. (2016a and 2016b). The validation exercises undertaken in Fang et al. (2016a and 2016b) include comparison of simulation results to those of field experiments and other refined models.
The Station Nightclub Building Fire
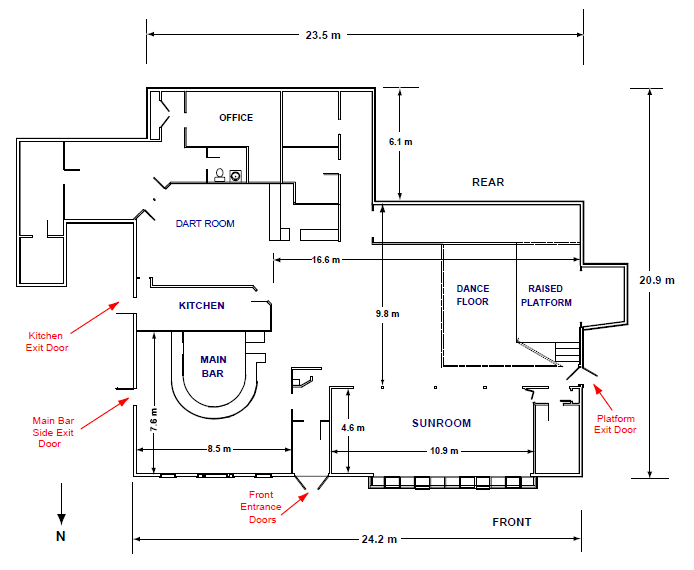
Once pyrotechnics ignited polyurethane foam lining the walls and ceiling of the band platform and dance floor, the fire spread aggressively. Film shows that at 90 seconds after initiation, the dense black smoke layer was near the floor, while “…the entire club was engulfed in flames within 3 minutes of initiation (Gill and Laposata 2010).” The fire occurred on February 20, 2003 during a heavily attended night. The building, which had accumulated a number of risks, some quite severe, over the years mainly through the practice of grand fathering the structure from recent and safer municipal building code requirements (Barylick, 2012), was a single-story wood frame building shown in Figure 1. It was comprised of multiple spaces or ecologies, including a dance floor and a raised platform in front of it for the performers, a sunroom, a dining room, main bar, kitchen, dart room, bathrooms and office. It had four exit accesses: front door entrance, main bar side, kitchen side, and platform side. The crowd began to evacuate as soon as it became clear that the fire was occurring, or about twenty five seconds after ignition. The last person to escape came out 4 minutes and 8 seconds after ignition, although most survivors got out during the first 150 seconds (other details of the fire and a timeline are in Tubbs and Meacham, 2007). For the purposes of this study, the simulation’s timeline count starts the moment the crowd began to evacuate (considered to be 30 seconds after ignition).
The platform´s side exit (see Figure 1, west side of building) was blocked by the spreading fire and became impassable about 20 seconds after ignition. Only 24 occupants escaped through it, while on the other side of the building only 17 escaped through the kitchen door, probably because of its very poor signage and lack of visibility. The remaining survivors evacuated through the front entrance and the main bar side exit, 128 and 78 respectively. When other would-be evacuees clogged the spaces near the main hall, main bar and the corridor of the front entrance, some of the other occupants at the back of these queues searched for alternative egresses, eventually breaking the windows of the main bar room and sunroom about 100 seconds after the fire started. In this manner another 105 occupants escaped the fire. Clearly, attendees were not blindly following others to the main entrance in a herd-like manner but showed initiative and creativity as they tried to exit the building. Nevertheless, 100 occupants died from severe burns and smoke injuries, making it the fourth deadliest fire in the nation's history.
The social organization of the Station Nightclub the night of the fire
The Station Nightclub in West Warwick, Rhode Island was a popular dance hall for people in the city and region. 72 percent of the patrons the night of the fire had visited the nightclub previously. An even greater percent (98 percent) saw the sparks that started the fire. The gathering was composed of older than average concert goers (median age = 32 years) and had an unusually high degree of sociality, amity and goodwill among its members (for an in-depth, affecting although tragic reconstruction of the often intimate relations among the people in attendance see Barylick 2012). Only 10 percent of the 465 people in the Station that evening were by themselves. The rest were members of 210 groups. 29 percent of them were in groups of 2 persons, 32 percent were in groups of 3 and 4, and 39 percent were in groups of 5 or more members. Almost half (40 percent) of these groups were made up by coworkers and friends, dating partners, and kin and spouses (Aguirre et al. 2011a, b; Aguirre et al. unpublished; Torres 2010; Best 2013). 51 percent of the members of groups were in close proximity of each other when the fire started (with the average distance of group members to each other less than 12 linear feet.) Size of group and distance among group members are highly statistically correlated (Pearson R .85).
The social cohesion produced by the norms shared by members of these groups can be measured "in extremis" even if ghoulishly, by examining the extent to which group members stayed with other members of their groups in the midst of this fire even if by doing so they augmented their chances of death and injury, showing the strengths of systems of social control that operated in this instance. For, as with injury (Pearson R .86 between size of group and the chance of injury), the mean number of dead increased almost monotonically with the sizes of the groups (Pearson R .70). Thus, the groups of 2 persons had a .40 mean number of dead persons; groups of 3 had a .60 mean number of dead; groups of 4 had a mean of .53; groups of 5 a mean of 1.56; groups of 6 a mean of .67; groups of 7 a mean of 3.00; groups of 8 had a 2.50 mean number of dead; and groups of 9 or more persons had a 3.41 mean number of dead members (similar finding are reported, among others, by Cornwell 2003). A somewhat unusual characteristic of this gathering is that when the fire struck, there tended to be a division by space and gender inside the building, for males separated from the other members of their groups tended to congregate at or near the bar while their female counterparts congregated in the dance floor. The result is that once the fire commenced, there was a good deal of movement in opposite directions of men and women searching for each other and unintentionally creating "knots" of people who blocked the paths of other would be evacuees, in an environment that was deteriorating very rapidly as flames engulfed the building.
Human density (number of persons per square foot) of the ecologies inside the building was also an important predictor of deaths and injuries (Pearson R .55). The highest death rate occurred in the ecology to the north of the main bar in front of the bar windows (.453 death per square feet). Perhaps many of those who perished in this area migrated to the space trying to reach the main entrance nearby and were overtaken by smoke and fire due to delays in evacuating caused by the large number of people in front of them who were also hoping to exit through the front door. The high percent of dead and injured in this fire is partly the result of these social organizational features. Many victims lost precious seconds in the search for their group members, while others were inconvenienced by the knots of people that formed in the middle of the building. For these and other reasons, the resulting delays in evacuating placed many of these victims in the back of the throngs of people who were also trying to escape the fire.
In the next sections, the Scalar Field Method is presented and the relationships of these groups are comprehensively modeled and quantitatively analyzed.
Assumptions and Model Implementation
Environmental Hazards
Environment hazards are harmful to an evacuee’s health. In particular, fire can lead to burn injuries and fatality, and the toxic effects of smoke will reduce an evacuee’s stamina (Bryan 2002; Best 2013). An agent’s mobility is related to whether or not its “health” is impaired (Pauls 1977; Klote 1992). To describe an agent’s health, stamina is quantified as a scalar number termed energy level, or EL (terminology adapted from Aguirre et al 2011a and Best 2013; Aguirre et al. unpublished), not to be confused with the VPE used by agents to model their rational thinking process. EL is a non-negative quantity, and the agent’s mobility is assumed to be dependent on its EL. The lower the energy level is, the more injured the agent is and the less likely it can move and exit the building. Once the energy level is zero, the agent is assumed to have died.
The building and environment model of the EgressSFM takes into account fire and smoke hazards. Fire is presented herein as a series of rectangular areas with stochastic sizes and start times. The progression of fire is hardwired into the simulation platform based on an analysis of the event documented by the National Institute of Standards and Technology (Grosshandler et al. 2005). The documented spread of fire is shown as shaded areas in Figure 2a through Figure 2e. An agent that cannot move away from an activated fire zone at the end of the simulation is considered to have been killed by the fire.
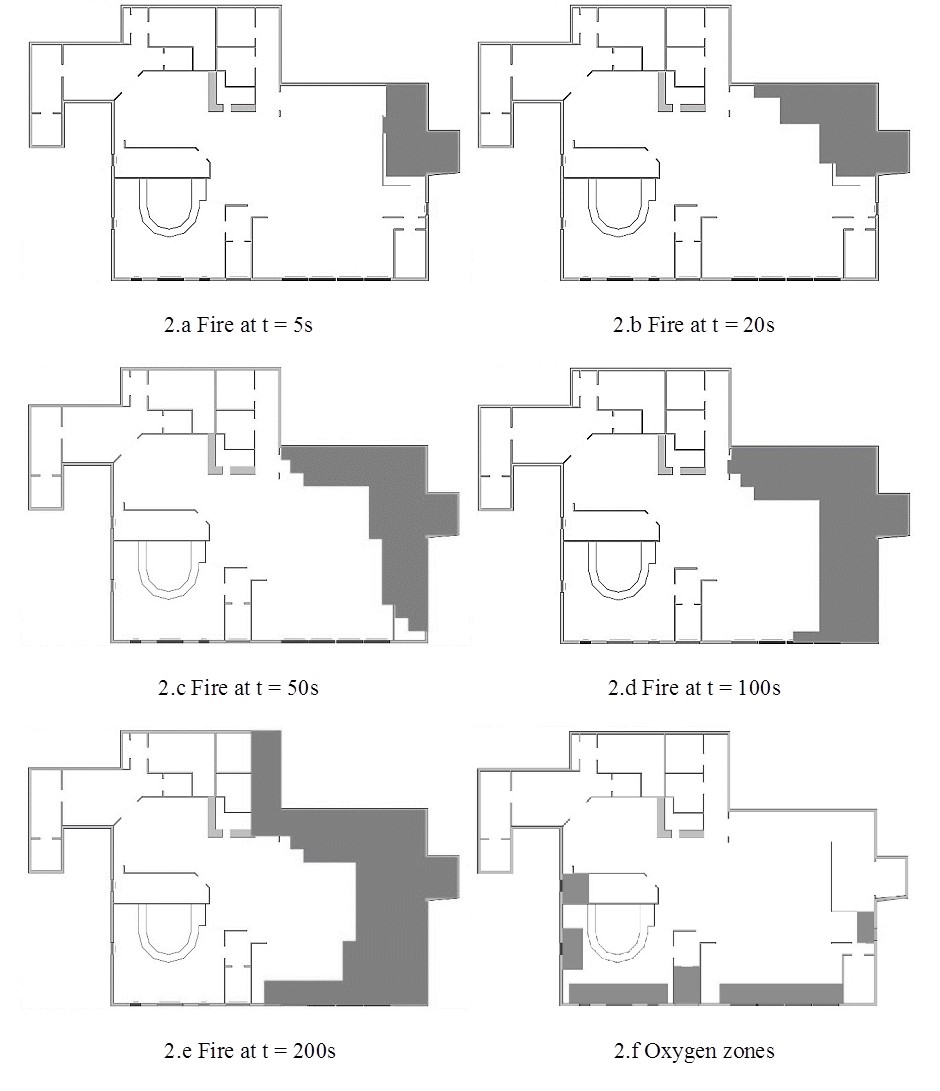
Smoke has a toxic effect on agents and gradually reduces their energy level over the entire building as soon as the fire starts. As shown in Aguirre et al. (unpublished), Aguirre et al (2011a), and Best (2013), the impairment due to smoke takes effect gradually. This toxic effect is assumed to be eliminated in oxygen zones (shown as dark areas in Figure 2f) Due to the availability of fresh air, agents entering oxygen zones start to recover their energy levels.
An Agent’s Energy Level
Before the fire occurs in the simulation, each agent is assumed to have an initial EL based on occupant demographics with a stochastic element added to account for variability. The initial EL values are taken from Aguirre et al. (2011b), Torres (2010), and Best (2013). After the simulation begins, each agent in the building suffers smoke damage over time, manifested by a reduction in energy level, until it either evacuates or is killed. An agent’s energy level is computed as follows (based on Best 2013):
- When an agent does not move from an active fire region, its energy level drops instantaneously to zero. This signifies that it is deceased.
- . Smoke leads to a gradual reduction in an agents’ energy levels in all building spaces except as noted next. The EL changes at the rate of -0.6, -0.8, and -1.2 EL/second during the time periods of 0 – 50 second, 50 – 100 second, and after 100 second, respectively.
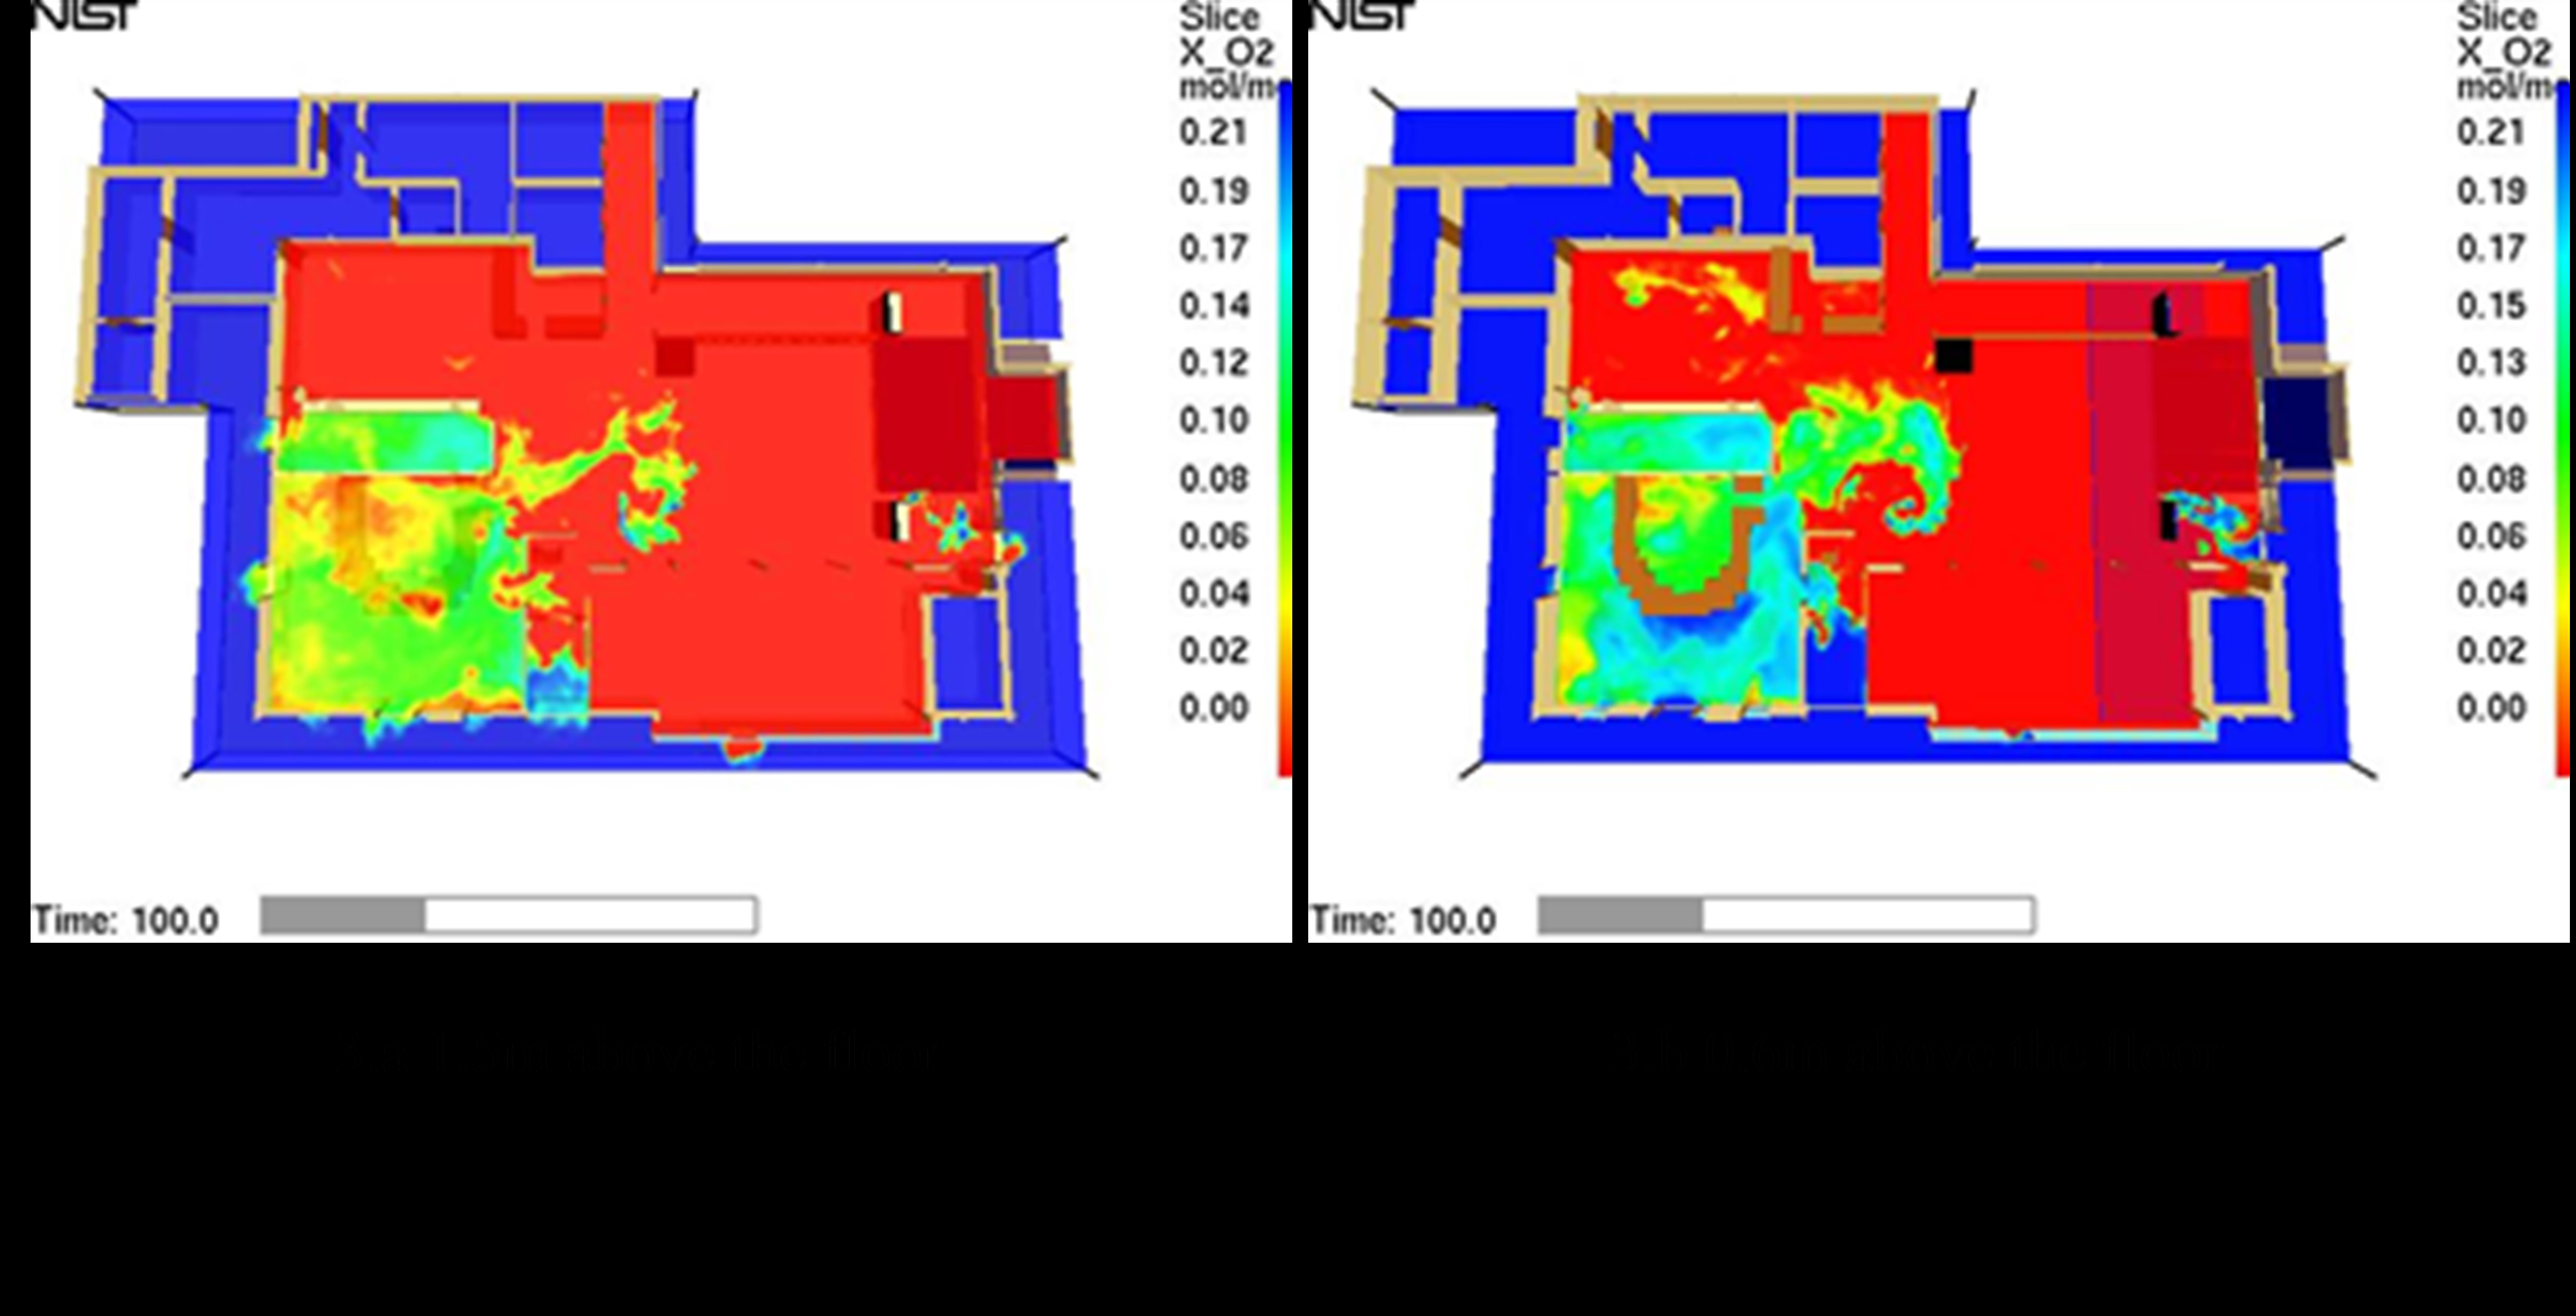
- Based on an analysis of oxygen volume fractions conducted by Grosshandler et al. (2005), as shown in Figure 3, agents in the main bar room are assumed to suffer damage at a lower rate (80% of values specified above) because: 1) this room is far away from the fire, and the fire and smoke are impeded by the walls of the front entrance corridor and kitchen; and 2) this room has access to one side exit and multiple windows that can provide more fresh air than other rooms.
- When an agent is present in an oxygen zone, the damage rates of EL are divided by a factor of -1.2 (Gill et al. 2010) to recognize the beneficial effects of oxygen. As a result, the EL gradually increases in oxygen zones.
An injured agent is assumed to suffer mobility loss that is linearly dependent on the ratio of its current energy level to its initial energy level. If the energy level is equal to or higher than 80% of the initial amount of energy, the agent’s maximum velocities are not influenced. Otherwise, the agent’s maximum velocities in various directions are lowered in a linear manner with the remaining energy level, as shown in Equation 6.
| $$ \frac{max.v}{original \, max.v}= \begin{cases} 0.2+\frac{energy \, level}{initial \, energy \, level} & ,\frac{\, \, \, energy \, level}{initial \, energy \, level} < 0.8 \\ 1.0 & ,\frac{\, \, \, energy \, level}{initial \, energy \, level}\geq 0.8 \end{cases}$$ | (6) |
Egress Model Implementation
As modeled in EgressSFM (Fang et al 2016a and Fang et al 2016b), the Station Nightclub building model is comprised of a collection of exits, doors, windows, and interior spaces. Agents that reach exits are considered to have safely exited. Each exit has an open and close time that determines whether this exit is available (passable) or not, respectively. Application of such open/close times is necessary to account for dynamic conditions during the fire, e.g. the side exits became impassable as the fire progressed. Windows are a special set of exits that are normally impassable. They can switch functions to enable egress after a specified open time is reached, reflecting the possibility of breaking them during an emergency (Best 2013; Aguirre et al., unpublished). The building model automatically updates functions and availability of exits and windows according to the specified open times and close times shown in Table 1. Such times are based on the simulation timeline starting when the crowd begins to evacuate, as initially estimated by Grosshandler et al. (2005).
| Locations | Open Time | Close Time |
| Front Entrance | 0 | None |
| Platform Side Exit | 0 | 30 |
| Main Bar Side Exit | 15 | None |
| Kitchen Side Exit | 30 | None |
| All Windows | 100 | None |
The agent’s normative behavior is controlled by the Scalar Field Method as discussed earlier. The agent model is implemented to address the demographic and interview data of the Station Nightclub fire as follows:
- Personal demographic information of age, gender, initial energy level, and prior visit experience are considered. The term ‘prior visit experience’ pertains to whether the agent has visited the building before the night of the fire, i.e. it accounts for familiarity with the floor plan, which presumably facilitates successful evacuation from the building.
- Initial location and orientation. Initial location of each occupant is determined based on coding of survivor interviews (Aguirre et al. 2011b; Torres 2010). Each agent’s initial orientation is randomly selected for each simulation.
- Social affiliation. The majority but not all agents are members of one of the 179 social groups, which are characterized by a specified type of relationship: they were either alone, with co-workers, or with friends, dating partners, family members, and multiple group types. The first term refers to an individual without pre-existing relationship to others. The last term means an agent is in more than one group type.
- Group leader. A social group can have a leader that influences other members’ decisions in this group. In the case of the Station Nightclub scenario, group leaders were identified and coded based on survivor interview data (Aguirre et al., unpublished ; Torres 2010; Best 2013).
Age determines an agent’s mobility before being injured. The maximum speeds of each agent are dependent on its age category. Adult agents (ages 15 to 65) are assumed to have a maximum forward speed that is randomly selected from a range of 0.95 m/s to 1.55 m/s to reflect the stochastic nature of moving individuals. Agents in the “children + seniors” category have a maximum forward speed in the range between 0.55 m/s to 1.25 m/s. The lateral speed limit is selected as 0.5 m/s and the backward limit 0.2 m/s for the “adults” and as 0.3 m/s and 0.1 m/s for “children + seniors”. The maximum rotational capability is randomly determined between 3 rad/s to 4 rad/s for the “adults” and half of that value for “children + seniors”. These speeds are based upon on information in previous studies (Tang 2008; Thompson 2004). The initial orientation of each agent is allocated randomly.
Prior visit experience influences an agent’s awareness of side exits, so that if they had never visited the Station Nightclub they lacked awareness and would have a higher probability of missing an exit near to them. The data generated by Torres (2010) and Aguirre et al (2011a, b) show that close to half of the evacuees had no prior visit experience. Grosshandler et al. (2005) mentions that approximately 66 percent of the occupants believed the main entrance to be the only exit. In this study, prior visit experience is assumed to determine an agent’s knowledge of the floor plan when the evacuation starts: an agent without prior visit experience is aware of the front entrance exit and main bar side exit only, and is assumed to be unaware of other side exits. An agent who visited the building previously is assumed to know all the exits. However, an agent can learn from the surrounding environment and updates its knowledge and considers other exits as alternative potential destinations.
For simplicity, this study assumes a dichotomous coding of social relationships, either friend- or kin-related. Thus, each agent has the same type of social relationships to other group members in the same group. Spouses and dating partners are interpreted as kin-related in the SFM, and co-workers and friends are categorized as friend relationships. Members of more than one group are also assumed to be friend-related. If a group leader is specified in a strongly bonded relationship like spouses, the group leader is responsible for leading the group, and the other group members are assumed to follow the leader. To do so, the leader establishes kin-related interactions with each of the other group members, but non-leader members only set up a social relation with the leader. In addition, the non-leader members duplicate the leader’s decision to follow a specific escape route.
An agent has multiple potential choices of destination for egress, since there are four exits and two walls with windows. Selecting the exit, particularly the platform exit, was discussed by previous researchers such as Grosshandler et al. (2005) and Pan (2006). Both studies assumed the occupants to always select the closest exit and applied algorithms to control their decisions. The former used two software packages, buildingEXODUS and Simulex. In the simulation with buildingEXODUS, the platform exit was assumed to be impassable after 30s, and the front entrance was blocked at 90s. In the Simulex simulation, Grosshandler et al. (2005) first calculated number of occupants who would use the platform exit, which resulted in 39 people, and then made the platform exit only visible to these 39 occupants. The latter study conducted by Pan (2006) assumed that only 20 occupants were aware of the existence of the platform exit and that 2/3 of the occupants believed that the main entrance was the only exit.
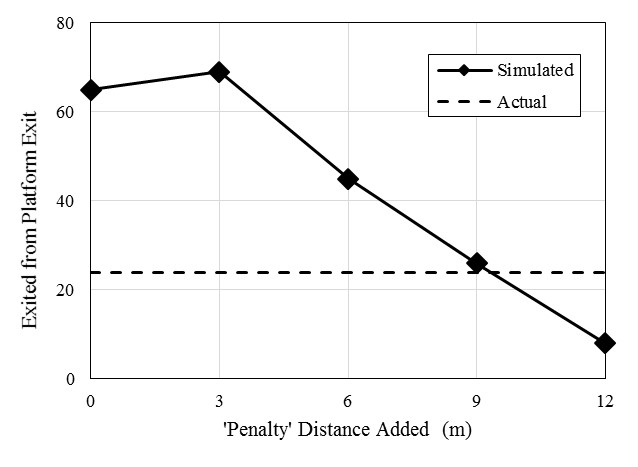
In this study, the agent generally selects one exit to which the travel distance from the agent’s current location is the shortest, although the agent is not forced to use it. The final choice of exits is dependent on availability of exits, prior visit experience, and group leadership, as discussed previously. To address the fact that only a limited number of people escaped through the platform exit, a penalty is added to each agent’s perception of this particular exit’s distance, so as to make it less desirable as an exit. This empirical approach is motivated by two facts: 1) this exit door swung inwards rather than outwards, and hardware on the door was broken (Grosshandler et al. 2005), and 2) the exit was close to the fire and covered by heavy smoke shortly after the fire ignited. A 9-meter penalty is selected to use as shown by the parametric study shown in Figure 4, in which the number of agents using the platform exit is simulated with various penalty distances. As can be seen, the correct number of agents using the exit corresponds to the use of a 9 m penalty.
Simulation and Hypothetical Investigations of Social Traits
The egress scenario in the Station Nightclub Building Fire is modeled in EgressSFM. The simulation results are shown in Table 2. Because of the stochastic nature of the simulations, twenty simulations are conducted and average values and standard deviations are reported. The computed number of occupants using each exit and people dying are compared to the actual values as reported by Aguirre et al. (2011a; 2011b) (see also Best 2013). Note that the sum of ‘actual’ occupants in Table 2 adds up to 452 and not the 465 agents simulated herein. The difference is due discrepancies in the published literature about the actual number of patrons in the nightclub, e.g. as reported in Grosshandler et al. (2005). Nevertheless, the difference between the sum of actual and simulated people is less than 3%. As shown in Table 2, the simulation results match the actual statistical data reasonably well. The implications of this favorable match are discussed later on.
| Main exit | Bar exit | Kitchen exit | Platform exit | Windows | Deceased | |
| Actual | 128 | 78 | 17 | 24 | 105 | 100 |
| Simulated | 135 | 81 | 12 | 26 | 106 | 105 |
| Standard Deviation | 14 | 9 | 6 | 1 | 6 | 12 |
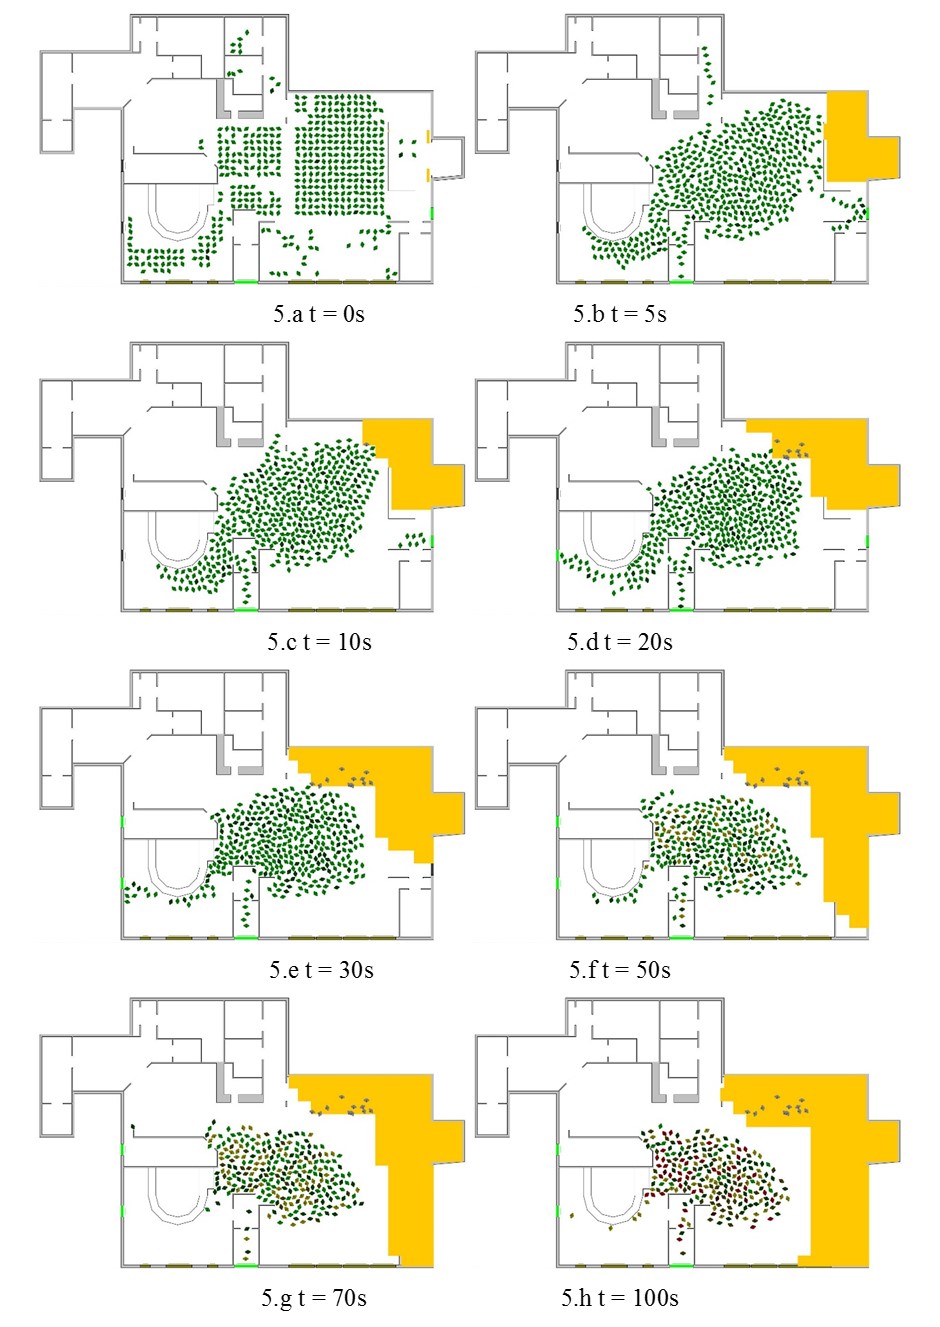
To give an impression of how the simulation progresses, snapshots at the initial starting point and a series of intermediate times during one run of simulation are taken and presented in Figure 5. An important observation is that the egress process lasted for most victims less than 180 seconds due to the extreme severity and rapidity of the fire and smoke that enveloped the building. During the egress process, pre-existing social relationships took place and influenced agents’ decisions and behaviors. Group behavior driven by strong interactions, influenced neighboring agents and led to clogging and delays in egress (c.f., Aguirre et al., unpublished). For example, agents in social groups are involved in kin-related interactions at a particular instant of time rather than in prompt evacuation thereby delaying themselves and others. In the remainder of Figure 5, the color variation of the agents signifies different degrees of impairment, specifically an agent changes color gradually from green (and its variations) to yellow to red based on the remaining energy level compared to the initial level. Dead agents are colored light gray. Generally, the main exit, bar exit, and windows played primary roles for egress, and other side exits were ignored by the majority of the agents, perhaps due to loss of visibility. Moreover, the toxic effect of smoke impaired agents’ health and lowered injured agents’ mobility and their ability to egress from the building.
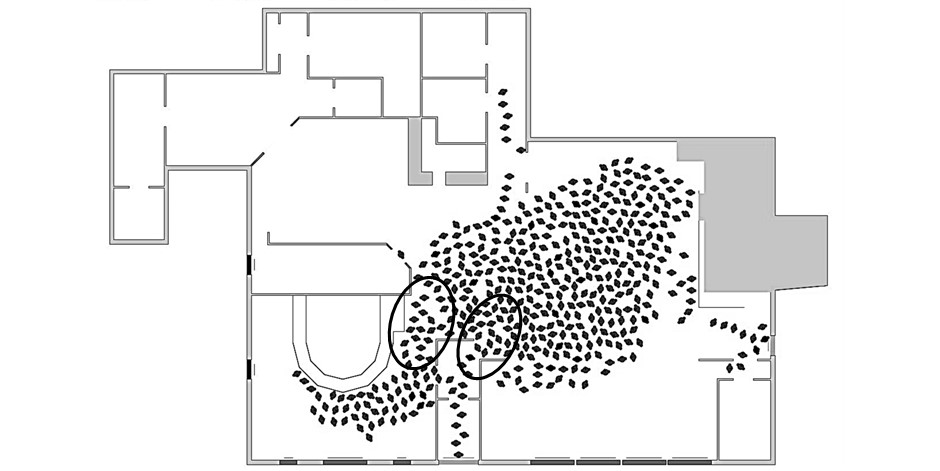
Two areas, as highlighted in Figure 6, are found to be critical for overall egress efficiency of the occupants in the building. These areas are the connection between the main bar and main hall and the connection between the front entrance and main hall. Along with the corridor of the front entrance exit, these areas are filled with agents and become problematic because of the presence of strong social bonding, e.g. spouses and dating partners. Agents driven by such interactions tend to congregate with their groups, and such gatherings lead to traffic congestion in the connection areas. As a result, as initially reported by Best (2013) and Aguirre et al. (unpublished) and confirmed herein, the overall egress is delayed by these bottlenecks.
To investigate the influence of social traits in a quantitative manner, two series of parametric simulations are conducted. The first is based on “break down”, which is defined as the degree by which an agent ignores its social affiliations. The second focuses on the effect of prior-visit experience. Each simulation shown hereon is conducted twenty times to account for the stochastic nature of the problem.
Break Down of Social Relationships
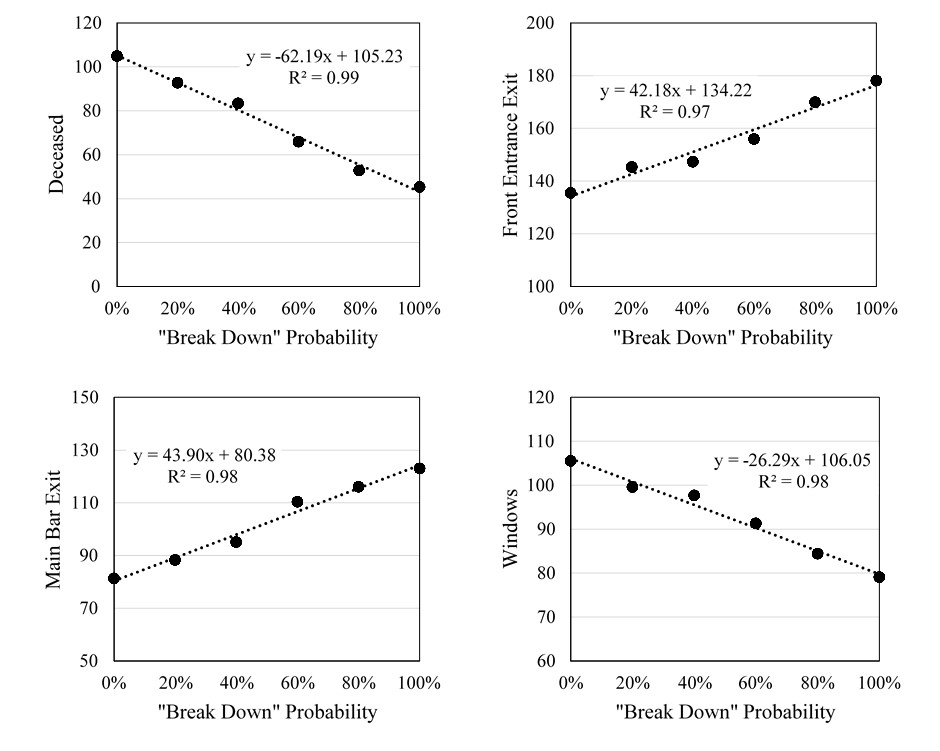
As shown in Table 3, the numbers of agents using various exits and those that are deceased are compared in a sensitivity study of “break down” probabilities of 0%, 20%, 40%, 60%, 80%, and 100%. In particular, the case of 0% assumes that every agent responds to its pre-existing relationships, and the case of 100% assumes that all agents ignore their social affiliations and egress alone as individuals. Four plots are drawn in Figure 7 to showcase the tendencies of using front entrance exit, main bar exit, window exit, and deceased agents versus the “break down” probability, respectively. As shown, they are generally linearly dependent on the break down probability. More agents successfully evacuate through the front entrance exit and main bar exit as the break down probability increases, i.e., as more of them become free agents.
| Probability | Main exit | Bar exit | Kitchen exit | Platform exit | Windows | Deceased |
| 0% | 135 | 81 | 12 | 26 | 106 | 105 |
| 20% | 145 | 88 | 13 | 26 | 100 | 93 |
| 40% | 147 | 95 | 15 | 27 | 98 | 83 |
| 60% | 156 | 110 | 14 | 27 | 91 | 66 |
| 80% | 170 | 116 | 14 | 28 | 84 | 53 |
| 100% | 178 | 123 | 11 | 29 | 79 | 45 |
| Actual | 128 | 78 | 17 | 24 | 105 | 100 |
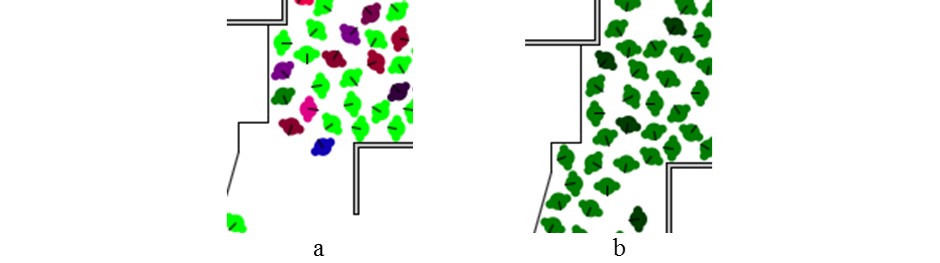
An example of the case of 0% (pre-existing relationships fully active) is given in Figure 8a, which shows the difference of congestion near a narrow area when compared to the case of 100% (all evacuees are free agents) in Figure 8b. In Figure 8a, like-colored agents are members of the same group. As they attempt to congregate, they slow down all other agents by blocking their path. In Figure 8b, the variation in green color implies agents with differing EL, the darker the shade, the lower the EL. These variations in mobility contribute to an overall slowdown in the evacuation process.
The number of agents using windows to evacuate decreases because the number of remaining agents in the building decreases when the windows become passable at 100 seconds. As a result, the number of deceased agents decreases and is almost half of the 0% condition when every agent drops its social relationships. Clearly, the presence of social relationships increases potential risk and delays the overall egress. This result is consistent with many previous studies, e.g. Johnson et al (1994), Cornwell (2003), Aguirre et al (2011b) and Aguirre et al. (unpublished).
Prior Visit Experience
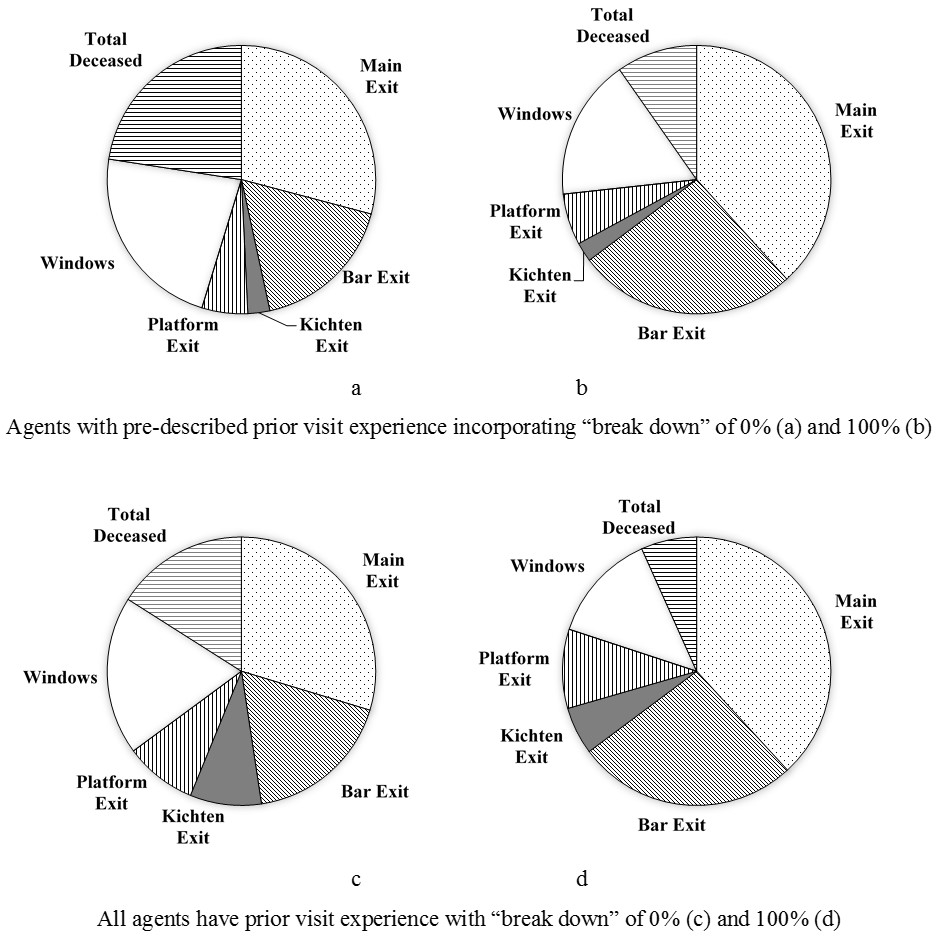
An agent who has no prior visit experience is considered to be only aware of the main and bar exits and unaware of others such as the kitchen and platform exits. To explore the influence of such limitations, a set of control tests, which are comprised of 0% and 100% “break down” cases are conducted under a hypothetical situation in which all agents are assumed to have prior visit experience and awareness of the full floor plan. The simulation results are drawn in four pie charts as shown in Figure 9, in which the numbers of agents using various exits and the number of deceased agents are divided by the total number of agents and presented as different components. Figure 9a and 9b show results extracted from the exercises conducted previously where agents’ prior visit experience were pre-described according to the survey data (Aguirre et al 2011a, b), followed by the results where all agents are aware of the full floor plan shown in Figure 9c and 9d. Comparing Figure Figure 9a to 9c and Figure 9b to 9d, the effect of no prior visit experience can be viewed for both 0% and 100% “break down” conditions. As expected, significantly more agents evacuate through the platform exit and kitchen exit, so the deceased agents are fewer. On the other hand, the number of agents who use the front entrance exit and the main bar exit are not affected.
Meaningfulness and Implications of the Computational Study
Even though EgressSFM was extensively validated in Fang et al. (2016a and 2016b), it was not validated under the same conditions for which it was exercised in this work. The Station Nightclub scenario modeled is complex and incorporates many levels of multi-dimensional interactions that occur between numerous actors in the simulation, i.e. agents, physical building components such as walls and exits, fire regions and oxygen zones. Each of these interactions are modeled based on key assumptions as outlined in the manuscript. Thus, it is naturally difficult to draw strong conclusions about the fidelity of the simulation results. Yet, the observed reasonable comparison to field data lends credence to the simulation model and suggests that it is capable of capturing some key aspects of the event. Obviously, this is not rigorous validation of the model given the extent of uncertainties and assumptions. However, it is acceptable since the methodology employed is the only way available at present to carry out ethical studies of these crisis evacuations and conduct quantitative parametric research on a uniquely complicated and multi-disciplinary problem that has implications for life safety within facilities.
Summary and Conclusions
This paper reports on the use of the EgressSFM platform that used the Scalar Field Method (SFM) to model a historical egress scenario, the Station Building Fire. The platform is modified to incorporate environmental hazards of fire and smoke, and computes each agent’s stamina as an energy level, which impacts the agent’s mobility. The study considers demographics and social relationships of the occupants in the building when the fire happened. When calibrated, the simulation captures the realism of the actual data, and shows EgressSFM’s ability to reasonably handle the complex social relationships and group behaviors present during egress. The parametric simulation exercises show in a quantitative manner that the presence of intimate social affiliations delay the overall egress, and that lack of knowledge of the building floor plan limits exit choices and adversely affect the number of safe evacuations.
Acknowledgements
This work was supported by the University of Michigan, University of Delaware and the US National Science Foundation (NSF) through grant ACI-1638186. Any opinions, findings, conclusions, and recommendations expressed in this paper are those of the authors and do not necessarily reflect the views of the sponsor.References
AGUIRRE, B. E., Eric Best, Sherif El-Tawil (Unpublished manuscript). Crisis Evacuations as Complex Systems: Agent Based Model of the Station Nightclub Fire. Submitted for evaluation as an article.
AGUIRRE, B. E., El-Tawil, S., Best, E., Gill, K. B., & Fedorov, V. (2011a). Contributions of Social Science to Agent-Based Models of Building Evacuation. Contemporary Social Science, 6(3), 415-432. [doi:10.1080/21582041.2011.609380]
AGUIRRE, B. E., Torres, M. R., Gill, K. B., & Lawrence Hotchkiss, H. (2011b). Normative Collective Behavior in the Station Building Fire. Social Science Quarterly, 92(1), 100-118. [doi:10.1111/j.1540-6237.2011.00759.x]
BARYLICK, J. (2012). Killer Show. The Station Nightclub Fire, America’s Deadliest Rock Concert. Libanon, NH: University Press of New England.
BEST, E. (2013). Incorporating Groups, Collective Behavior, and Information Visualization in Agent-Based Models of Evacuation. PhD Dissertation, Disaster Research Center, University of Delaware, DE, USA.
BRYAN, J. (2002). 'Behavioral Response to Fire and Smoke.' In M. Hurtley (Ed.), SFPE Handbook of Fire Protection Engineering. 3rd edition, pp. 315-340, Bethesda: SFPE
CHU, M. L., & Law, K. (2012). Modeling Social Groups and Roles in Egress Simulation. Proceedings of the 5th International Symposium on Human Behaviour in Fire, Cambridge, UK, pp. 569-574.
CORNWELL, B. (2003). Bonded Fatalities: Relational and Ecological Dimensions of a Fire Evacuation. Sociological Quarterly, 44(4), 617–38. [doi:10.1111/j.1533-8525.2003.tb00528.x]
FANG, J. (2015). Computational Study of Social Interactions and Collective Behavior during Human Emergency Egress. PhD Dissertation, Department of Civil and Environmental Engineering, University of Michigan, Ann Arbor, MI, USA.
FANG, J., El-Tawil, S. and Aguirre, B. (2016a). Leader-Follower Model for Agent Based Simulation of Social Collective Behavior during Egress. Safety Science Journal, 83(3), 40–47. [doi:10.1016/j.ssci.2015.11.015]
FANG, J., El-Tawil, S., and Aguirre, B. (2016b). New Agent-Based Egress Model Allowing for Social Relationships. Journal of Computing in Civil Engineering, 30(4), 04015066. [doi:10.1061/(ASCE)CP.1943-5487.0000532]
GILL, K., & Laposata, E. A. (2010). Factors Impacting Injury and Fatality in the Station Nightclub Fire. Unpublished manuscript, available from authors (please contact Benigno Aguirre).
GILL, K., Laposata, E. A., Dalton, C. F., and Aguirre, B. E. (2010). Analysis of Severe Injury and Fatality in the Station Nightclub Fire. Newark, DE: University of Delaware.
GROSSHANDLER, W., Bryner, N., Madrzykowski, D., Kuntz, K. (2005). Report of the Technical Investigation of the Station Nightclub Fire. NIST NCSTAR 2: Vol. I. Building and Fire Research Laboratory, National Institute of Standards and Technology, USA.
JOHNSON, N. R., Feinberg, W. E, & Johnston, D. M. (1994). 'Microstructure and Panic: The Impact of Social Bonds on Individual Action in Collective Flight from the Beverly Hills Supper Club Fire.' In R. R. Dynes and K. Tierney (eds.), Disasters, Collective Behavior and Social Organization. Newark, Delaware: University of Delaware Press, pp. 168-189
KLOTE, J. H., Alvord, D. M., Levin, B. M., & Groner, N. E. (1992). Feasibility and Design Considerations of Emergency Evacuation by Elevators. National Institute of Standards and Technology, Building and Fire Research Laboratory. [doi:10.6028/NIST.IR.4870]
MOUSSAÏD, M., Perozo, N., Garnier, S., Helbing, D., & Theraulaz, G. (2010). The Walking Behaviour of Pedestrian Social Groups and Its Impact on Crowd Dynamics. PLoS ONE, 5(4), e10047. [doi:10.1371/journal.pone.0010047]
PAN, X. (2006). Computational Modeling of Human and Social Behaviors for Emergency Egress Analysis. Doctoral dissertation, Stanford University, Stanford, CA.
PAULS, J. L. (1977). Movement of People in Building Evacuations. Community Development Series, 34, 281-292.
PLUCHINO, A., Garofalo, C., Inturri, G., Rapisarda, A., & Ignaccolo, M. (2014). Agent-Based Simulation of Pedestrian Behavior in Closed Space: A Museum Case Study. Journal of Artificial Societies and Social Simulation, 17 (1), 16: https://www.jasss.org/17/1/16.html. [doi:10.18564/jasss.2336]
SANTOS, G., Aguirre, B. E. (2004). A Critical Review of Emergency Evacuation Simulation Models. Proceedings of Building Occupant Movement during Fire Emergencies, Maryland, USA, 27-52.
TANG, F., & Ren, A. (2008). Agent-Based Evacuation Model Incorporating Fire Scene and Building Geometry. Tsinghua Science & Technology, 13(5), 708-714. [doi:10.1016/S1007-0214(08)70115-9]
THOMPSON, P. (2004). Simulex: Simulated People Have Needs Too. NIST Workshop on Building Occupant Movement during Fire Emergencies.
TORRES, M. R. (2010). Every Man for Himself? Testing Multiple Conceptual Approaches of Emergency Egress on Building Evacuation During a Fire. Department of Sociology, University of Delaware, Newark, DE.
TUBBS, J. and Meacham, B.J. (2007). Egress Design Solutions: A Guide to Evacuation and Crowd Management Planning. John Wiley & Sons, New York.