The electricity generation and distribution system in many developed economies is based primarily on the centralised grid. However, there is a need to shift from this traditional system to a newly more decentralised electricity system. This paper explores possible scenarios of adoption and diffusion of Micro-Grids (MGs) in Italy. An agent-based model is formulated to simulate the diffusion process as function of regional factors, subsidies and people's attitude. It assumes that MGs are purchased directly by communities of neighbours, which benefit from cost sharing. Results show high dependence of the diffusion process on regional factors: electricity demand, renewable potential and population. The model confirms that subsidies boost diffusion, mainly when they are regional-based rather than national-based. Higher green attitude accelerates diffusion and reduces environmental impact of the electricity system.
Keywords:
Micro-Grids, Agent-Based Model, Innovation Diffusion, Energy Transition
Introduction
Generation of electricity and heat represents the main cause of CO2 emissions; in 2010, they accounted for 41% of world greenhouses gas (GHG) emissions (IEA/OECD, 2012). Countries are challenging global warming and climate change by addressing household energy use in a number of ways: improving efficiency, adopting zero- emission technologies and fostering diffusion of decentralised generation systems (DGs). DGs aim at a more sustainable production and distribution of electricity and, consequently, they have attracted interest from the technical and scientific community (Ackermann et al. 2001; Asmus 2001 ; IEA 2002; Hatziargyriou & Meliopoulos 2002; Lasseter 2002). DGs are defined as “any source of electric power of limited capacity, directly connected to the power system distribution network where it is consumed by the end users” (Akorede et al. 2010, p. 726). Moreover, since DGs combine “cluster of loads and micro-sources operating as a single controllable system”, these are also defined Micro-Grids (MGs) (Lasseter 2002, p. 305).
The interest on DGs and MGs is driven by three main factors that might positively impact the transition to a more sustainable production and use of energy. These are: (i) minimise transmission losses by reducing the distance between electricity generation and final users (Ackermann et al. 2001; Pepermans et al. 2005 ;) (ii) deploy higher share of renewable technologies and, consequently, reduce CO2 emissions (Hadley & Van Dyke 2005; Chiradeja & Ramakumar 2004); and (iii) improve energy security (Asmus 2001). Along with these studies, stressing the importance of DGs and MGs in the transition towards a more efficient, sustainable and inclusive electricity production system, there are others that indicate the parallel need of public and private investments (Block et al. 2008; Lopes et al. 2007; Driesen & Katiraei 2008; Marnay et al. 2008; Battaglini et al. 2009; Agrell et al. 2013). In fact, the ownership structure and the relative market dynamics are important in the diffusion process of MGs. The growing market liberalisations in the energy sector have facilitated adoption of decentralised systems Madlener & Schmid 2003; Markard & Truuer 2006, where energy utilities have been the major beneficiaries of this deregulation Siddiqui & Maribu 2009.
Over the next decades, demand for electricity is estimated to increase along with population growth and consumer budgetary constraints. For these reasons, citizens are requested to be engaged in the challenge against the threats of global warming and climate change (European Commission 2015; Hyysalo et al. 2016; Schot et al. 2016; Vasiljevska et al. 2017). Micro-Grids can facilitate this process since consumers become the central node in this new energy infrastructure (Watson 2004): they are not only the final users but also, simultaneously, generators of electricity (so-called prosumers). Hence, adoption and diffusion of MGs necessitate users’ direct involvement: they are requested to commit individual effort into the capital investment and to be willing to install MGs in their neighbourhood (Sauter & Watson 2007). Nonetheless, such types of initiatives become profitable primarily when they generate savings to users compared to the current status (i.e. purchasing electricity from the centralised system). In conclusion, building a decentralised electricity system is an emerging bottom-up process requiring a comprehensive understanding of consumers’ behaviour and perspective (Groh 2014).
The assumption that MGs may speed up the transition towards a decentralised electricity system, which is expected to be more inclusive, sustainable and secure compared to the current centralised system, raises the following question: what are the drivers that could favour diffusion of Micro-Grids? This paper addresses this question and develops an agent-based model (ABM) for this scope. It models an economy in which agents are users that evaluate the option to shih from the current centralised electricity system towards Micro-Grids. The shih is modelled as a common decision which requires a collective action. Agents are clustered in neighbours and individual electricity demand depend on their geographical location. Electricity production is heterogeneous since renewable potential differs among locations. Regional variations in demand and production lead to a distribution of take-up in new energy systems.
The model is calibrated to the Italian electricity system which is representative of many other developed countries that have a well-established centralised electricity infrastructure. Italy presents inefficiencies in the transmission system, it is highly dependent on imports, but, at the same time, it has a high renewable potential. In these contexts, the transition towards a decentralised system is more difficult since new technologies face the incumbent technologies, which prevent the (desired) smooth process of substitution or co-existence and integration. Results show that the diffusion process of MGs is influenced by regional heterogeneity (demand, renewable potential and population). Subsidy boosts diffusion, mainly when they are regional-based rather than national-based, and higher green users’ attitude accelerates diffusion and generates reduction of CO2 emissions. Therefore, policy instruments tailored to consumers’ attitudes and regional characteristics can encourage the shih from the traditional centralised grid to a new decentralised electricity system. Beyond the Italian case, this paper provides policy implications that can be generalised and applied to other national contexts.
The paper is structured as follows. Section 2 reviews the classic literature on diffusion and it shows how ABM have contributed to this discussion, particularly on the topic of diffusion of eco-innovations. The model is presented in Section 3 and results are discussed in Section 4. Section 5 concludes.
Literature Background
A Micro-Grid (MG) is an indivisible and capital-intensive good and, when purchased by users only, it requires a common action (Olson 1971) in order to cover the high fixed costs. In this way, MG can be considered a common pool resources (Wolsink 2012) for which the theory of governing common properties has suggested that local interactions are preferred over other approaches, namely privatisation and external regulation (Ouchi 1980; Ostrom 1990 ; Ostrom et al. 1994). Users organise themselves into communities and cooperate in order to reach the maximum benefit from the common property. Consequently, adoption of MGs is a case of technology diffusion that takes place collectively. Rogers defines this action as a “collective innovation decision where there is consensus among the members of a systems” and they “must conform to the system’s decision once it is made” (Rogers 2003, p. 28). Accordingly, this paper studies diffusion of MGs driven by the adoption decision that is taken commonly by a group of neighbours (Bollinger et al. 2016).
However, diffusion of eco-innovations often focuses on individual adoption. This is the case, for example, of the adoption of electric vehicles (Diamond 2009), more efficient boilers (Weiss et al. 2009) or solar photovoltaic panels (Bollinger & Gillingham 2012). This literature considers adoption as a decision conditioned by continuous and complex interactions between different actors (Antonelli & Ferraris 2011). Agent-based models (ABM) are used in order to study these phenomena that emerge from cooperation among people (Gilbert 2004; Tesfatsion 2003; Borrill & Tesfatsion 2011; Garcia & Jager 2011). Furthermore, by means of ABM it is possible to model policy interventions (Safarzyńska et al. 2012) and to study their implications on technological transitions and consumer demand (Faber & Frenken 2009). Given these relevant peculiarities, ABM have contributed to the literature of diffusion of eco-innovation in a number of ways.
Schwarz & Ernst (2009) examine the diffusion of three water-saving innovations in Germany, considering real geographical data. An ABM simulates the householders’ decision which reflects sociological and psychological theories rather than only economic perspectives. Faber et al. (2010) explore the diffusion of micro-cogeneration technology in the Netherlands driven by cost-related decision. Their agent-based model simulates the market competition between two technologies, traditional boiler and micro-CHP, in which gas and electricity prices varies and subsidy schemes shape different adoption scenarios. Hamilton et al. (2009) develop an ABM to assess the possibility to shih from a centralised gird to a decentralised electricity supply. The authors consider spatial externalities in the decisional process and the fashion effect. Zhang et al. (2011) evaluate the adoption trend of alternative fuel vehicles (AFVs) in the United States. In their model, interaction among consumers, manufacturers and policy makers determines different diffusion scenarios for AFVs. Zhang & Nuttall (2008 ) examine with ABM diffusion of smart electricity meters in the UK and evaluate the effectiveness of policy options. Their goal is to provide stakeholders (namely suppliers and government agencies) with a ABM-related tool able to analyse diffusion policies.
In all these contributions, ABMs have been applied to study diffusion of eco-innovations for which the adoption decision is made individually. However, as pointed out earlier in this section, capital-intensive goods, such as MG, can be also purchased by a group of people in order to mitigate the high investment costs. There exists, therefore, a gap in literature concerning the analysis of diffusion processes that depend on the adoption decision which is taken by a group of consumers rather than individual users. This paper aims at contributing to this area and it develops an agent-based model in which aspects of diffusion theories (i.e. bandwagoneffect, fashion effect, technology progress, people attitudes, etc.) are combined to the condition that the adoption decision is taken commonly by a group of people. This paper is distinguished from other works since it expands the notion of individual technology adoption to common adoption, which is driven by the high fixed costs of MG. Moreover, the model simulates policy interventions and evaluates their impact on the diffusion process.
The Model
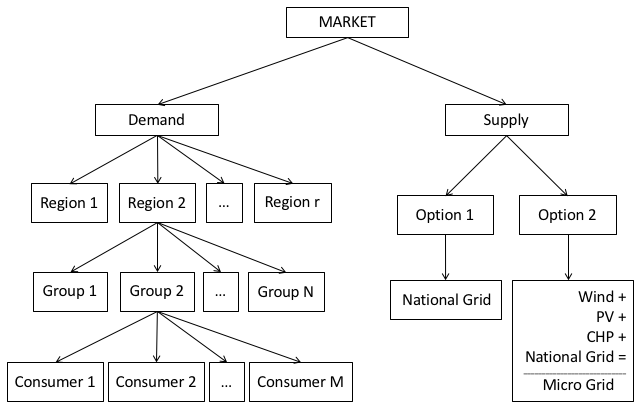
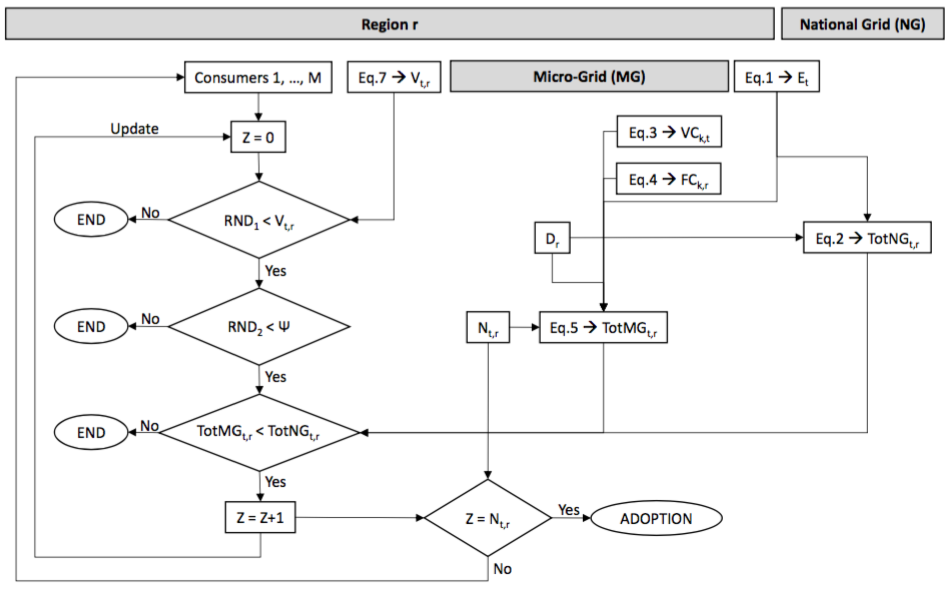
The model simulates a market economy, which consists of a demand side and a supply side (Figure 1). The demand side contains several regions in which consumers are split into groups. Groups represent neighbourhoods where people live in proximity, which is important since MGs are small-scaled energy infrastructure and require to be installed and used by consumers living in the same geographical area. Regions define specific characteristics, both in the demand side (i.e. consumers’ electricity demand, share of adoption) and in the supply side (i.e. functioning hours of renewable technologies).
Figure 1. Model diagram.
In the model, groups of citizens make the choice to invest into a micro-grid solution on the basis of cost considerations. At the beginning of the simulation all consumers are connected to the national grid, which is one of the two options in the supply side. The alternative is the Micro-Grid which requires a common investment. Three technologies form the Micro-Grid: solar photovoltaic panels (PV), micro wind turbines (&alt;50 kW) and micro combined heat and power systems (micro-CHP, &alt;50 kW).
There are two options available to agents: (i) maintain the current energy supply system, which is the national grid, and pay only the cost of energy consumed; or (ii) shih to a quasi-independent MG energy system, where costs are shared with others. Costs of the two alternatives change over time, and consumers adapt their decision accordingly. The two options are compared based on the same investment horizon: it is assumed that components of the MG become obsolete and they have to be removed and substituted after a certain period. Substitution implies that agents evaluate the two alternatives based on cost conditions that have changed compared to previous judgments. Evaluation consists on the comparison between the total cost of the two options: the option with the lowest cost is chosen. Importantly, consumers evaluate the MG option only if they are aware of this opportunity and if they demonstrate positive attitude towards the common investment. The components of the adoption decision are summarised in the schema in Figure 11 in Appendix A.
The supply side
The market gives consumers two alternatives to satisfy their electricity needs: national grid (NG) and micro- grid (MG). In option 1, the electricity price (\(E_t\) in \euro//kWh) is the only cost component for consumers. The price is not constant over time, but it varies continuously, and its value is defined endogenously every time step in the simulation as in Equation 1:
$$E_{t}=E_{t-1}*(1+v)$$
(1)
\(v \in [v_{min}; v_{max}]\) is a random number generated in order to keep the raising trend in the price of electricity similar to that one observed in Italy in recent years. Values \(v_{min}\) and \(v_{max}\) are respectively computed as the average of negative and positive changes in percentage between two consecutive observations of electricity price in Italy, from January 2005 to June 2013. Consumers connected to NG pay a total cost (\(TotNG_{t,r}\)) which depends on their demand (\(D_r\), function of regional characteristics) and on the time horizon \(T\), as in Equation 2:
$$TotNG_{t,r}=E_{t}*D_{r}*T$$
(2)
Electricity generated and distributed by the national grid serves as a back-up to MGs. Therefore, \(E_t\) enters in the computation of the cost in option 2 (as in Equation 5). The overall cost of MG depends on technologies that form the MG itself. The cost for every technology \(k\) is defined through a variable and a fixed component. The variable cost (\(VC_{k,t}\) in Equation 3 and measured in \euro/kWh) is dependent on fuel cost (\(F_{k,t}\)), operation cost (\(O_{k,t}\)) and incentive granted to each technology (\(S_{k,t}\)).
$$VC_{k,t}=F_{k,t}+O_{k,t}-S_{k,t}$$
(3)
The fixed technology cost is \(I_k\), measured in \euro. The fixed cost of the entire MG (calculated as in Equation 4), consisting of three technologies (\(k\)=3), includes the cost of batteries (\(B\)), which are needed to store the electricity produced by the intermittent renewable sources, and the possible subsidy (\(SP_t\)), that can be provided to stimulate adoption of MG.
\(I_k\) is the investment cost of the technology \(k\) involved in MG [€];
\(B\) is the cost of battery [\euro];
\(SP_t\) is the subsidy received by the group of consumers to adopt a MG [€];
\(NC_{t-1,r}\) is the number of MGs adopted in a region \(r\);
\(\alpha\) is a parameter exogenously set which reflects the rate of cost decrease and determines the progress rate (\(PR=2^{\alpha}\)) (Faber et al. 2010). In Equation 4, \(\alpha\) reduces also the value of subsidies provided to MG adoption since it is assumed that these decrease together with the technological progress.
The total investment cost relative to MG is regional-dependent. Regional differences depend on how many hours the three technologies can work and satisfy consumers' electricity needs. It is assumed that MG can work continuously for 8760 hours per year and that Micro-CHP has a constant utilisation share (\(x_{CHP,r}\)), regardless its regional location. Time covered by PV (\(x_{PV,r}\)) and wind (\(x_{Wind,r}\)) varies among regions and it depends on weather and climate conditions. If needed, national grid will work as back-up for the remaining hours (\(x_{NG,r}\)). In this way, the model takes into account the regional utilisation factor in order to capture regional characteristics. At regional level, wind and PV cover a different percentage of the yearly production while the cogeneration system is stable in its utilisation. The national grid satisfies the remaining demand. MG can supply electricity to a maximum number of users only (\(N_{t,r}\)), which defines the size of regional communities. The fixed cost (\(FC_{t,r}\)) is equally split among consumers that adopt commonly a MG. Users' demand (\(D_r\)) defines the contribution of the variable cost (\(VC_{r,t}\) and \(E_t\)) which, in turn, depends on the technology utilisation share (\(x_{k,r}\)). Therefore, the individual cost at time \(t\), in region \(r\) and for the time horizon \(T\) is computed as in Equation 5[1].
H2:Demand increases the total cost of MG, but this effect is balanced by regional renewable potential, which decreases the share of electricity supplied by the national grid
H3:Diffusion is boosted when the fixed of MG decreases, hence with low cost of battery and high subsidy
The demand side
The demand side of the market economy concerns consumers and their characteristics. MG supplies electricity to a restricted local area where communities are formed among people living in the same neighbourhood. In order to represent geographical proximity, the model defines exogenously a number of groups of consumers in each region with similar characteristics. In order to be able to evaluate option 2, every consumer has to be (i) aware if this opportunity and then (ii) willing to invest commonly into a MG.
The model endogenously defines people awareness by means of a variable, visibility (\(V_{t,r}\)), which is function of regional characteristics. It is computed every time-step as in Equation 7, and it represents the extent to which the MG alternative is known in the region (Faber et al. 2010). The higher the regional diffusion share, the higher consumer’s probability to know the option to invest in MG.
Willingness to invest jointly with neighbours in MG is defined through consumers’ attitude towards green in- vestments (Balram & Dragićević 2005; Hansla et al. 2008). The model uses a parameter ((\(\Psi\))) exogenously set, to establish the probability that a consumer is inclined to invest in a decentralised electricity system. This is user’s green attitude and, the higher its value, the higher the opportunity to evaluate the common investment.
In conclusion, in each regional group, all consumers check their awareness and willingness towards MG. Those that satisfy these preliminary conditions are involved in the evaluation process. Each agent declares as optimal the option that generates the lowest individual cost; when it concerns MG, agent becomes a potential adopter. MG produces electricity that permits to satisfy a limited demand, although its capacity varies among regions. This implies that regional communities have a fixed number of participants. If the number of potential adopters reaches the fixed size of regional communities (or a multiple of its value), these agents adopt the MG.
The following hypothesis is therefore proposed regarding the relationship between diffusion of MG and characteristics of the demand side:
H4:Higher users’ green attitude positively influences diffusion of MG
H5:Transition towards MG is limited only to users that are aware and willing to do so, hence MG will not reach full diffusion
Table 1: Model Initialisation. * Parameter analysed
Consumers' demand (\(D_r\)) is heterogeneous across regions but it is homogenous within regions. Its value is initialised based on the regional average of consumption per capita In Italy (Table 7 in Appendix B). Consumers' attitude towards green investments, \(\Psi\), is exogenously set. They have 5.4% probability to be green. Assessing or quantifying the attitude needed to adopt eco-innovations is not straightforward. Difficulties are more acute when the focus is on the specific case of MG, which implies self-generation and self-consumption of electricity. While many studies propose surveys to assess consumers’ attitude regarding environmental friendly products, no contribution related to autonomous electricity generation has been found. To work around these difficulties, the share of electricity produced in Italy for self-consumption over the total production is used as proxy of green attitude.[2] However, acknowledging the high relevance of this parameter, a sensitivity analysis is presented and discussed later in the paper.
Consumers belong to regional groups of 1000 people each. This size represents the proximity constraint among people. In order to simulate the Italian case, the model defines 20 regions. The total number of groups per region is set proportional to the number of residents in each region. Moreover, in order to maintain some speed in the simulation, the number of people considered in the analysis is only 2% of the total Italian citizens; this proportion has been maintained in regions as well. Table 8 in Appendix B shows the number of groups of thousand people per region.
Table 2 presents initialisation of parameters regarding the three technologies included in the MG. There are two data sources. The values of incentives are taken from the Italian national regulation D.M. 6 Luglio 2012 and D.M 5 Luglio 2012. All the other costs are taken from a report published by Politecnico di Milano (2010). In this study, costs have been computed through the levelised cost of electricity (LCOE) and are already discounted for 20 years. The cost of battery (B) is set to \euro100000. The value is an approximation of values reported in literature and online specialised websites. The innovation process and technological improvement is at its starting point
and the cost estimates are very disparate (Nykvist & Nilsson 2015). To test this variability, a sensitivity analysis is presented later in the paper.
Table 2: Starting values for technologies in MG
Technology, \(k\)
Wind (\(k\)=1)
PV (\(k\)=2)
CHP (\(k\)=3)
Power
[kW]
30
20
50
Investment (\(I_k\))
[€]
135000
110000
70000
[€/kW]
4500
5500
1400
Fuel Cost (\(F_{k,t}\))
[€/kW]
0.098
Operation Cost (\(O_{k,t}\))
[€/kW]
0.083
0.108
0.111
Incentive (\(S_{k,t}\))
[€/kW]
0.268
0.196
0.257
Regional utilisation factor (\(x_{k,r}\)) see Table 9 in Appendix B.
The regional utilisation factor (\(x_{k,r}\)) for each technology included in the MG infrastructure is calculated in relation to the functioning hours. The two renewables technologies, wind and photovoltaic, supply electricity for a number of hours which depends on regional weather and climate conditions. In order to estimate their potential, online databases and software are consulted. For wind technology, the average wind speed[3] in each region is used and then the potential for wind plants[4] computed. A similar procedure is used to obtain the values for PV plant, for which the main parameter is the solar irradiation[5]. The micro-CHP system, is assumed to work for 3000 hours per year in all regions. The number of hours in which the micro grid uses electricity from the national grid is the remaining time. Assuming that option 2 supplies electricity during the whole year (8760 hours), Table 9 in Appendix B summarises the share of hours during which each technology supplies electricity power and the share of time the MG necessitates back-up from nation grid. As an example, consumers in the region of Abruzzi compute the variable cost of MG as follows: 8.09% is due to the Wind cost, 14.11% to PV, 34.25% to CHP and the remaining part, 43.55%, is due to the electricity cost purchased from the national grid.
In order to calculate the maximum number of users that can receive electricity from a MG in each region (\(N_{t,r}\)) it is necessary to estimate how much can be produced and supplied by a MG. To do so, the power installed for each technology (Table 2) is multiplied with the respective number of functioning hours (Table 9) Then, since the regional demand per capita is known (Table 7), it is also possible to measure the maximum number of users that can join a community in a specific region (Table 10 in Appendix B).
Adoption and diffusion of Micro-Grids in Italy is analysed for 200 years. The time horizon T is 20 years. Each time step represents one year. The model runs 10 simulations for each configuration, with different random seeds, in order to control the random effect of the stochastic variables of the model. Therefore, the result of a configuration is presented as an average between those ten simulations.[6]
Results and Discussion
This section presents and discusses the results of the model simulation. A first overview of the outcomes is given in relation to the classic literature on diffusion of innovations. Three sub-sections analyse different topic areas: (i) regional factors that influence diffusion of MGs; (ii) policy scenarios to assess the effectiveness of subsidy schema; (iii) sensitivity analysis on user’s green attitude and on the cost of the battery.
National diffusion
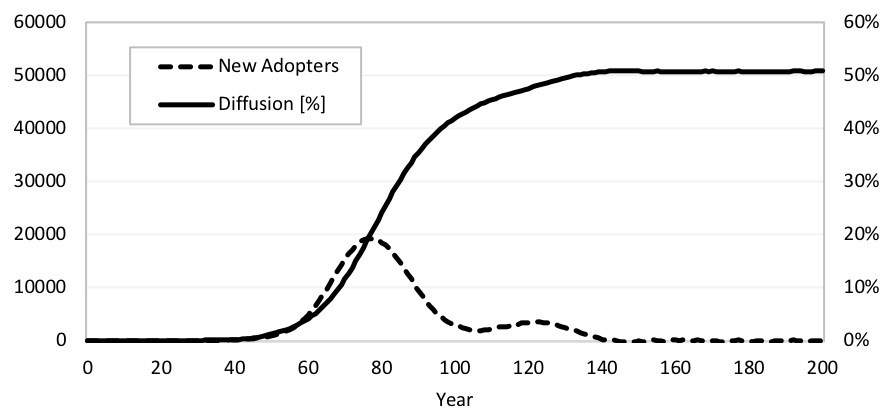
The diffusion process of MGs in Italy follows an S-shaped curve (Figure 2) and the adoption curve follows a bell- shape trend, as theorised by Rogers (2003). It is the result of the cost function and increasing returns to scale in adoption in each region (without subsidies, \(SP_t\)=0).
Figure 2. Diffusion and Adoption of Micro-Grids in Italy, Baseline case without subsidies.
The diffusion curve shows a slow trend during the first third of the time horizon analysed. In this phase, early adopters opt for MG and decide to move to the decentralised electricity system. Early adoption increases the visibility of MG across the population, which becomes more attractive. The subsequent take-off period determines a rapid surge of MG diffusion: in a very short time, it reaches (almost) its maximum value. The steady level is about 50%, meaning that only half of the population embraces MG, as in hypothesis H5. The low diffusion share is not surprising but is common in diffusion of eco-innovations (Faber et al. 2010; Higgins et al. 2012;
Shafiei et al. 2012). Consumers do not shih to MG because of two main reasons. The first one regards the fact that communities in regional groups have a limited size ((\(N_{t,r}\))). Not all consumers have the opportunity to join a community if it reaches its maximum capacity. The second reason is related to the previous one and to the social system. People’s awareness regarding option 2 increases with diffusion (see Equation 7), hence with the fashion effect determined by what other citizens have done in previous steps. Since diffusion does not reach an elevate share of the population, the individual chance to know the option to invest in MG is less probable. Moreover, the degree of adoption is also influenced by the individual green attitude and by the initial cost of the battery (B). These two factors will be analysed later in the paper.
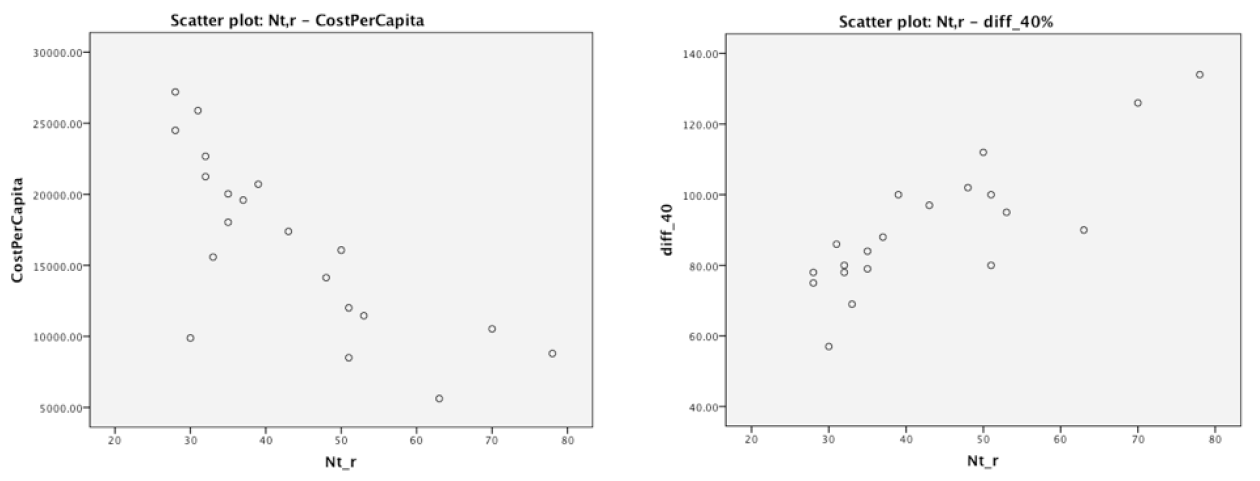
The model permit to study adoption and diffusion of MGs as a collective innovation decision. This means that people have to take a decision together. According to diffusion theory involving network externalities, large communities have a double and opposite effect: on the one hand, they reduce the individual cost, and, on the other hand, they slow down diffusion (Olson 1971). A correlation analysis helps to verify whether or not this prerogative is confirmed. It evaluates correlation between the maximum number of people in a regional community with the regional per capita investment cost and the number of years necessary to reach 40% of diffusion at a regional level. The per capita investment cost is the total amount requested to buy a MG when a consumer joins a regional community, computed as the average cost during the full duration of the analysis. The rate of 40% diffusion has been chosen because it is a value reached by all the regions and it represents 80% of the steady diffusion level. Table 3 shows the normal distributed variables considered in the analysis, and Figure 3 maps these variables in two scatter plots.
Table 3: Variables considered in the correlation analysis
Region
\(N_{t,r}\) max value
CostPerCapita [€]
diff40%[years]
Abruzzo
39
20711,99
100
Basilicata
48
14135,35
102
Calabria
78
8798,07
134
Campania
70
10529,97
126
Emilia Romagna
32
22673,29
78
Friuli Venezia Giulia
30
9885,14
57
Lazio
53
11456,76
95
Liguria
50
16070,19
112
Lombardia
28
27204,18
75
Marche
43
17386,90
97
Molise
51
12009,06
100
Piemonte
35
20030,50
79
Puglia
51
8501,18
80
Sardegna
33
15585,00
69
Sicilia
63
5621,35
90
Toscana
37
19593,25
88
Trentino Alto Adige
32
21243,80
80
Umbria
35
18034,59
84
Valle d’Aosta
28
24500,53
78
Veneto
31
25895,49
86
Figure 3. Relation between the maximum number of people in a regional community, the cost per capita and the years at 40% diffusion.
The correlation analysis is significant (Table 4) and confirms what is shown in Figure 3. The correlation between the maximum number of people in a regional community and the per capita investment cost are negatively correlated. Therefore, the cost of MG decreases when the number of people in a community is high (hypothesis H1). Conversely, the correlation between \(N_{t,r}\) and the time horizon necessary to reach 40% of regional diffusion is positive and strong. This means that the more the people in a community, the longer the time to reach
a certain degree of diffusion. This result conforms with classical diffusion theories (Rogers 2003) saying that diffusion process dependent on collective decisions requires more time to be accomplished than if it occurs by means of individual adoption decisions. These two results further validate the model, since they conform to theoretical assumption of the phenomenon studied.
Table 4: Correlation analysis: results. **. Correlation is significant at the 0.01 level (2-tailed).
Nt_r
CostPerCapita
diff_40
Nt_r
Pearson Correlation
1
-.764**
.830**
Sig. (2-tailed)
.000
.000
N
20
20
20
CostPerCapita
Pearson Correlation
-.764**
1
-.347
Sig. (2-tailed)
.000
.134
N
20
20
20
diff_40
Pearson Correlation
.830**
-.347
1
Sig. (2-tailed)
.000
.134
N
20
20
20
Regional diffusion
The analysis presented in this section studies the duration of the diffusion process at regional level. It additionally identifies what are the factors influencing diffusion at regional level. These analyses concern the baseline scenario without subsidies.
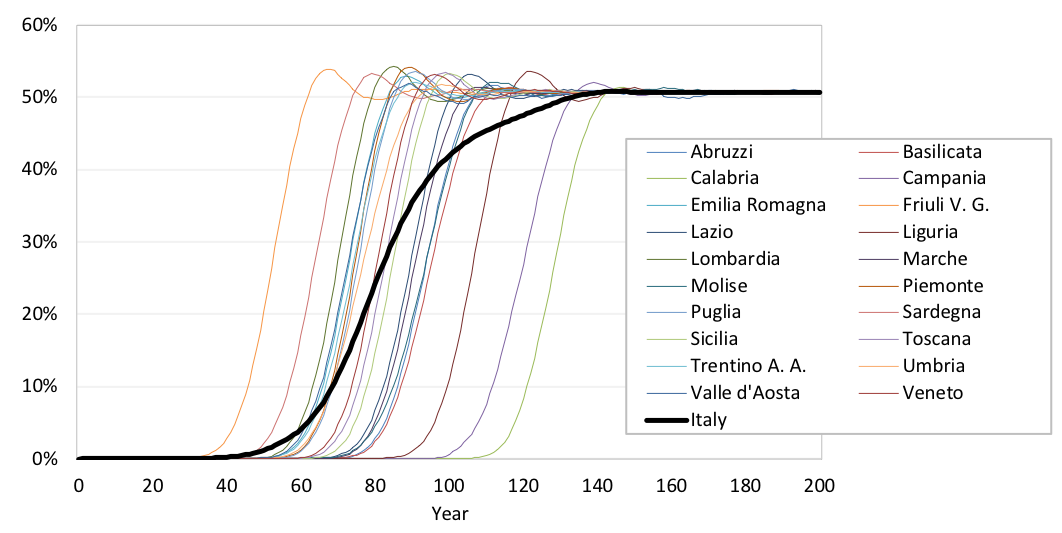
Figure 4. Regional diffusion of MGs, Baseline case.
Figure 4 shows regional diffusion curves that follow the S-shaped trend. After the take-off period, they present a peak of diffusion, which is higher than the steady level of the maturity period. This trend depends on fact that the investment duration is 20 years long and that, after this time, agents dismiss the installed MG and look for substitution. It happens that a large number of adopters simultaneously abandon the MG installed during the take-off period. These consumers may decide to substitute the MG and start a new decisional process by finding a new group of people willing to adopt once again the decentralised system. Hence, the combined desertion causes the short decrease in the diffusion curve, after the peak point. The second decisional phase, however,
is faster than before since MG has already achieved a certain degree of visibility. After a transitory moment, the steady state is reached in every region.
Curves in Figure 4 differentiate for speed of diffusion. Therefore, it is important to analyse regional factors that may have an impact on this process. A linear regression model is applied for this scope. The dependent variable is the number of years needed to reach a 40% level of diffusion at regional level, and the independent variables are the regional electricity demand, the sum of wind and PV regional potential (expressed in hours) and the number of regional residents (expressed in thousands, see Table 8). These are normally distributed, and Table 5 summarises their values.
Table 5: Variables considered in the regression analysis
Region
\(diff_{40\%}\) [years]
Demand [kWh/y]
Wind+PV [hours]
Population in 1000
Abruzzi
100
4913
1945
26
Basilicata
102
4497
2654
11
Calabria
134
2819
2790
40
Campania
126
3014
2481
116
Emilia Romagna
78
6242
2106
88
Friuli Venezia Giulia
57
8118
3596
24
Lazio
95
4077
2748
114
Liguria
112
4029
2121
32
Lombardia
75
6674
1789
198
Marche
97
4768
2263
31
Molise
100
4403
2923
6
Piemonte
79
5701
2214
89
Puglia
80
4597
3304
81
Sardegna
69
6728
2979
33
Sicilia
90
3836
3605
101
Toscana
88
5400
2190
74
Trentino Alto Adige
80
6406
2374
20
Umbria
84
6022
2630
18
Valle d’Aosta
78
7490
2546
2
Veneto
86
6060
1752
98
The regression model (Table 6) is significant and explains 88% of the total variation in the dependent variable. The three independent variables have a positive effect on the speed of diffusion since they, ceteris paribus, decrease the time needed to reach 40% diffusion of MG at regional level. An increase by 1 kWh in the regional demand reduces the dependent variable by 0.012, holding constant all the other independent variables. It means that each additional kWh demanded by the consumer increases the speed of diffusion by about 5 days. In other words, the speed of MG diffusion is faster when the regional electricity demand is high. Why? People living in regions where the electricity demand is elevated, at the starting point of the simulation, pay a higher price for electricity than in regions where demand is lower, since the electricity price (\(E_t\)) is equal in all national territory. Furthermore, the price of the electricity provided by the national grid increased every time step (as explained in Equation 1, and supposed in H2). For these reasons, over time, the option to invest in Micro-Grids is more profitable for people living in regions where electricity demand is high. Similarly, the combined wind and PV regional potential variable positively affects the speed of regional diffusion. An increase by one hour in the regional potential affects the dependent variable by decreasing its value of 0.01 (four days). Micro-Grid diffusion, therefore, is strictly related to the renewable potential because it reduces the variable cost of Micro-Grids. Lastly, population also increases the speed of diffusion. An increment by 1000 people at a regional level, ceteris paribus, decreases the number of years necessary to reach 40% diffusion by 0.083, which means about one month in time. This result is explained by the fact that, since early adoption causes more visibility, it increases fashion effect.
In conclusion, regional adoption and diffusion of Micro-Grids in Italy is a process susceptible to many variables. Since the adoption decision involves a community of final users, the speed of diffusion decreases along with the increase of the maximum number of people that can enter in that community. Moreover, electricity demand, wind and PV potential and the number of residents influence positively the speed of regional MG diffusion.
The role of subsidy
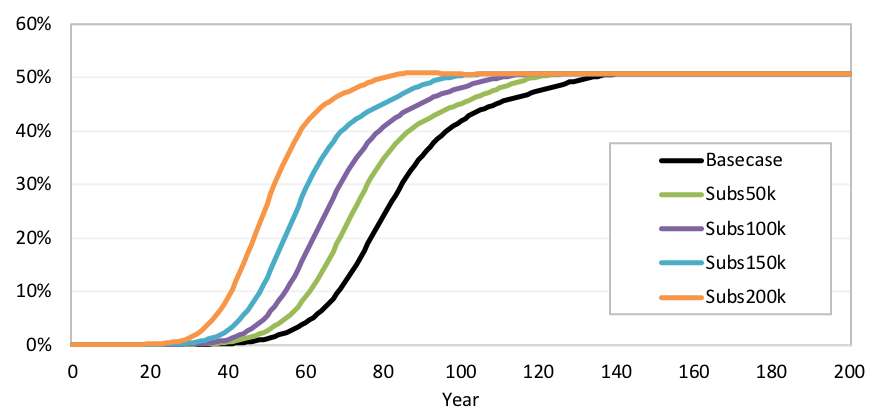
This section analyses the role of subsidies and how they influence diffusion of MG. The baseline scenario, which does not include subsidy, reaches 30% of diffusion share after 85 years. In order to see whether subsidies stimulate adoption and accelerate diffusion, four different policy scenarios are simulated. A the begin of the simulation, communities receive subsidy that reduces the cost of the total investment by a fixed amount: e50k, e100k, e150k and e200k. However, the amount granted decreases along with adoption (see Equation 4). Figure 5 shows the diffusion curves under the four policy scenarios. Not surprisingly, the higher the amount subsidised the faster the diffusion (as in hypothesis H3). The most effective scenario, Subs200k, permits to reach 26% diffusion, that is half of the maximum share, in only 50 years. However, it is also the most expensive policy intervention: based on the cumulative expenses, it amounts to e70.12 Bn.
Figure 5. MG diffusion in Italy, under subsidy scenarios.
According to diffusion theory, efficient policy interventions should stimulate rapidly the formation of a critical mass which are necessary to the take-off of the adoption process (Gersho & Mitra 1975). Therefore, to increase the probability of a faster diffusion it is important to incentivise early adopters. Rogers affirms that “once a
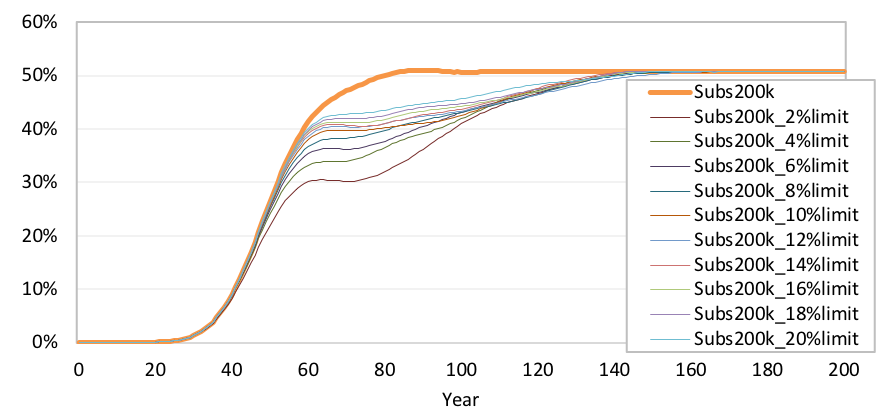
level of, say, 20 percent adoption is reached in a social system, the economic incentive is discontinued” (Rogers 2003, p. 238). In order to verify whether these theoretical assumptions are met by the model, different policy scenarios are simulated. These grant subsidy (e200k) only until a certain rate of diffusion is reached at national level.
Figure 6. Diffusion curves with 200k subsidy and national limitations.
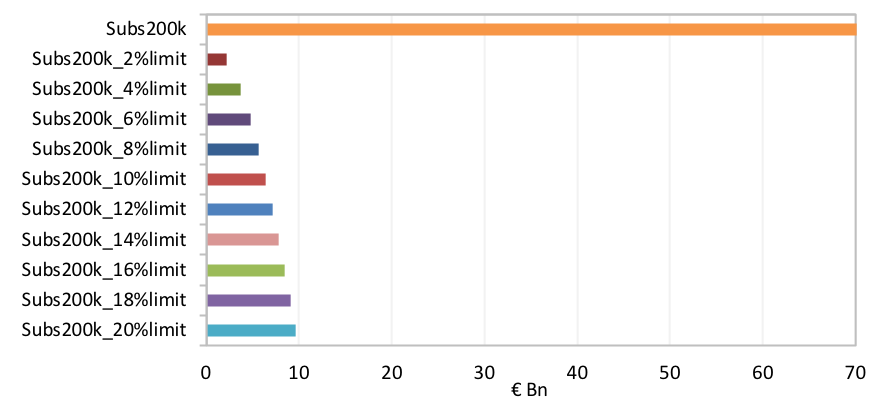
Diffusion curves in Figure 6 have the same trend until 30% of share. After this value, and depending on the limit set to subsidy, curves change their trend: those with higher limitations proceed faster than others. Although subsidy accelerates diffusion processes, some regions do not benefit from this policy intervention because their diffusion process takes-off after the limit is reached at national level. Therefore, this policy intervention, which is based on national threshold, does not have an equal impact on all regions. Moreover, although these scenarios reduce the overall expenditure (see Figure 7), the small acceleration of the diffusion does not justify entirely the cost of these policy interventions.
Figure 7. Cumulative subsidy expenditure under the 200k subsidy and different limitations.
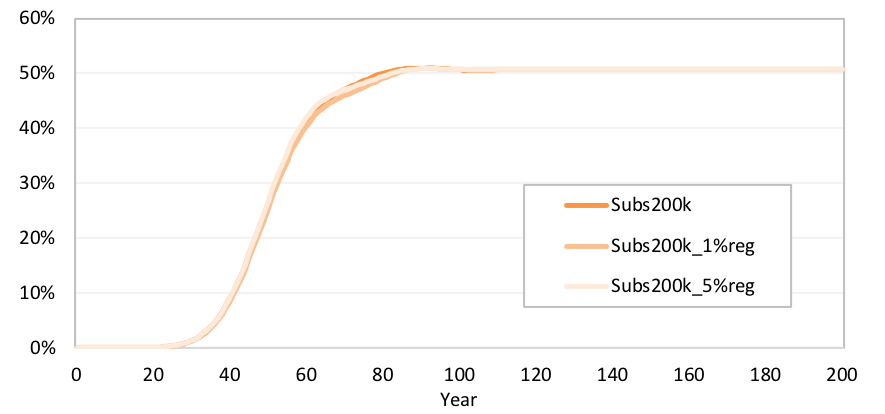
In order to analyses diffusion of MG when policy interventions are bounded at regional level, two additional scenarios are simulated. Here the threshold for subsidy is set based on regional diffusion shares rather than at the national level. Figure 8 illustrate the resulting diffusion curves. This policy intervention generates diffusion curves that are very similar to the \(Subs200k\) scenario. Subsidy ends when regions reach 1% or 5% of diffusion. This strategy permits to allocate subsidy fairly among regions, maintaining efficiency and effectiveness of the policy intervention. In fact, the cumulative expenditure is much lower than the case with limits are based on national diffusion share: in the \(Subs200k_{1\%reg}\) it amounts to \euro 2.14 Bn while in the \(Subs200k_{5\%reg}\) to \euro 5.76 Bn.
Figure 8. Diffusion curves with 200k subsidy and regional limitations.
In conclusion, this analysis suggests that, in order to accelerate diffusion and adoption of decentralised electricity systems, policy interventions are more effective when they are based on regional characteristics rather than when these are national-based. This depends on the fact that regional areas, such as those in the Italian territory, are heterogeneous, particularly in terms of demographic, climatic and demand characteristics. Therefore, policy-makers have to take into account these factors during the process of policy design.
Sensitivity Analysis
This last section focuses on the impact that two factors have on the diffusion of MG. The first regards the green
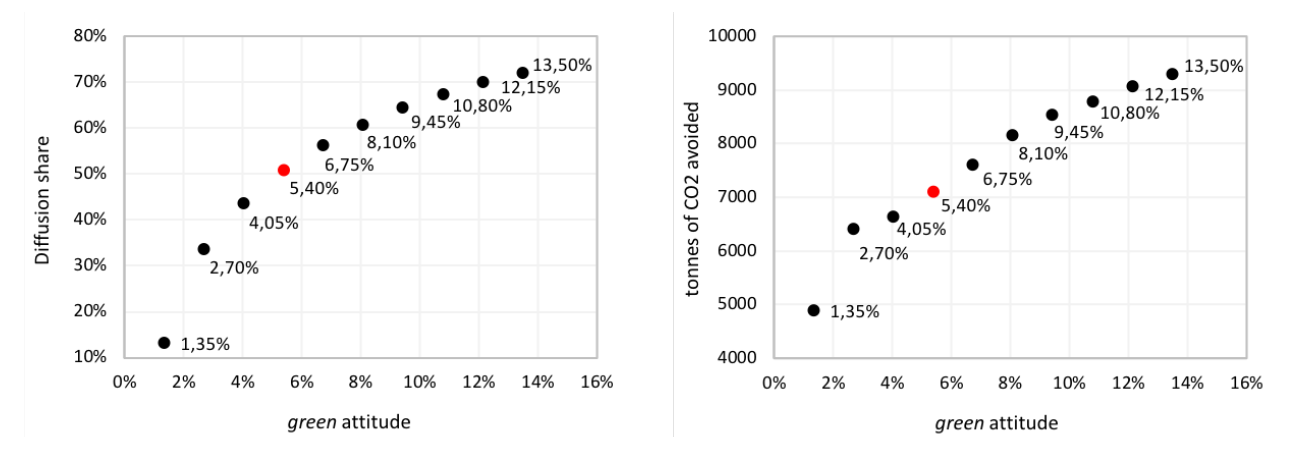
attitude of users and how this influences the potential environmental benefits of MG system, while the second regards the initial cost of the battery (B). Micro-grids have the very likely potential to improve environmental performances since they incorporate renewable technologies bringing to cleaner electricity production and to higher share of self-consumption. Therefore, the bottom-up process driving diffusion of MG is a key strategy to achieve countries’ environmental goals. The energy mix resulting from the baseline scenario simulated in this paper allows a constant increment of the renewable power installed every year (+6.3 MW). MG adoption, hence, reduces by 7,097 tonnes the production CO2 emissions every year in Italy[7].
Users’ green attitude is a key aspect of the diffusion process, since it defines agents’ probability to be willing to invest in a MG. It would be expected that the higher the green attitude the higher the diffusion of MG (hypothesis H4) and, consequently, the higher the environmental benefit. In order to test this hypothesis, a sensitivity analysis is conducted on this parameter. The baseline scenario, where the green attitude is set at 5.4%, is compared with other scenarios where users have different attitude. Figure 9 summarises the outcome of the sensitivity analysis. As expected, higher green attitude generates higher diffusion and better environmental performances. However, this is not a linear relation, but it follows a logarithmic growth: diffusion of MG and its environmental benefit increases with a growth rate which decreases along with the increase of users’ green attitude. From a policy point of view, this result implies that, although it is necessary to nudge people’s attitude toward decentralised electricity systems in order to generate positive environmental outcomes, it is equally important to evaluate carefully ex-ante the cost-benefit relation of possible policy interventions.
Figure 9. Diffusion share and CO2 avoided under different individual green attitudes.
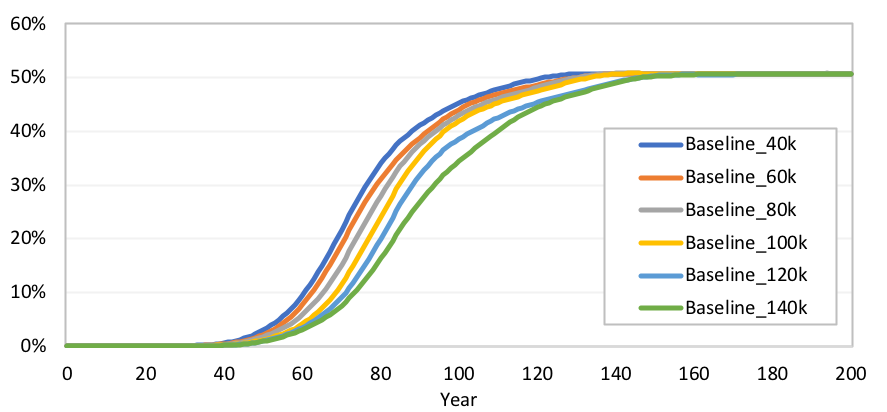
The cost of battery (B) is another important factor that impact on the fixed cost of the entire MG, and on its diffusion. Its value is also difficult to estimate with high degree of certainty due to the recent and continue progress in terms of technological efficiency and capacity. The baseline scenario simulates adoption and diffusion of MG with a cost of battery set to e100000. Figure 10 shows the result of the sensitivity analysis conducted on this parameter, where the impact of different costs are tested. Low cost of battery generates faster diffusion of MG, which, however, remains constant in terms of overall diffusion share (as in hypothesis H5). Batteries are important components for decentralised electricity systems, particularly for those that combine together renewable technologies, which require storage systems to fully take advantage of their intermittent production.
Therefore, this result is important since the learning curve related to batteries will certainly produce a reduction of initial cost that positively impacts the speed of diffusion of MG.
Figure 9. Diffusion curves with different initial cost of battery (B).
Conclusion
This paper analyses the adoption and diffusion of Micro-Grids (MG). These are decentralised electricity systems working quasi-independently from the national centralised grid. MG involves a cluster of technologies that supply electricity to a limited number of users living in proximity of the system and that are directly connected to it. Renewable energy sources (RES), such as micro wind turbines and photovoltaic panels, and biomass-based micro-cogenerators are components of this infrastructure. Decentralised systems are expected to bring environmental benefits, energy security and reduction of transmission losses. However, although all technical elements surrounding MGs seem to be ready for implementation, a wide diffusion is not visible yet.
The paper develops an agent-based model that is used to analyse adoption and diffusion of MG in Italy. The Italian electricity supply infrastructure is strongly based on the centralised grid, it presents high inefficiencies (in 2010, losses in the transmission system amount for 6.2% of net electricity production) and it is highly import- dependent (83.8% of fuel was imported in 2010 and 15% of electricity was imported in 2011). However, the renewable potential is very high in Italy. The model simulates different scenarios in which several factors are studied.
Diffusion of MG in Italy depends on three main aspects: regional specificities, subsidies and people's attitude. Given the high heterogeneity of Italian regions in terms of electricity demand (mean: \(\mu\)=5290 and standard deviation: \(\sigma\)=1434 kWh/y per capita), renewable potential (\(\mu\)=2551 and \(\sigma\)=540 functioning hours per year) and population (\(\mu\)=3 and \(\sigma\)=2.5 millions of residents per region), MG diffusion differs substantially from one place to another (\(\mu\)=91 and \(\sigma\)=19 years to reach 40% of diffusion rate). On average, Italy shows a slow diffusion process, that reaches only 50% of the population. Subsidy accelerates diffusion (38 years less to reach a level of diffusion of 40% compared to a scenario without subsidies). However, total expenditure is elevated: the amount decreases when policies are designed and implemented based on regional criteria rather than national. Lastly, users’ attitude has a big impact on diffusion of MG: the higher people green attitude, the faster the diffusion and, consequently, the higher the reduction of CO2 emissions.
In conclusion, the agent-based model presented in this paper proposes a replicable tool to design policy interventions aiming at the promotion of diffusion of community-based eco-innovations. Transition towards a new decentralised electricity system implies that new technologies can substitute or integrate the existing centralised infrastructure. In order to achieve this goal, policy-makers should consider different aspects. The shih towards a sustainable and environmental friendly system is more rapid in areas where the renewable potential is higher and where there is an elevate electricity demand. This is because new technologies guarantee a more efficient electricity production, and a cheaper supply. Depending on country heterogeneity, policies would be more effective if tailored to regional areas rather than being national-based. Importantly, transition highly depends on people attitude since their decision shapes adoption. Therefore, it is important to implement policy strategies that can increase people awareness and willingness to invest in more sustainable and environmental friendly energy infrastructures.
This last point poses important basis for future development of this research. First, energy transition is characterised by uncertainties that can be assessed also by additional methods, such as exploratory modelling (Kwakkel & Pruyt 2013; Eker & van Daalen 2015; Moallemi et al. 2017). Second, the model assumes an exogenous inclination of consumers to invest in decentralised systems, defined as green attitude. Consequently, people do not change or adapt their attitude in relation to the evolving dynamics of the diffusion process. This aspect of the model can be questioned and certainly improved in future research. Furthermore, the current structure of the agent-based model presents groups of consumers that are established in advance. Instead, it would be interesting to make endogenous the preliminary phase of group formation based on people interaction. In other words, the continuation of this research consists of modelling the decisional process as an endogenous dynamic phenomenon which evolves with the diffusion of decentralised energy system. This will provide more meaningful insights to design effective and adequate policy interventions.
Acknowledgements
I would like to thank Tommaso Ciarli for his enlightening supervision. I am also grateful to the editor and to two anonymous referees of this journal and to two anonymous referees of the SPRU Working Paper Series (SWPS) for their valuable comments. The author is currently also working at European Commission, Joint Research Centre, Petten, Netherlands. The opinions expressed in this article are the author’s alone and cannot be attributed to the European Commission.
Notes
This equation, and those relative to the supply side, are developed by the author.
The amount of electricity produced for self-consumption in 2012 was 16056.5 kWh. The total electricity produced in the same year was 299275.9 kWh. Source: Terna (2013).
The value has been computed by multiplying the parameter of the CO2 avoided by renewable electricity production (Bechis & Marangon 2011) with the renewable electricity produced in MGs. This last value, on yearly average, is the net amount of new wind and PV installed capacity in new communities multiplied by the Italian average of functioning hours for both sources.
Appendix
A: Schema of Adoption Decision
Figure 11. Schema of the adoption decision.
B: Data Initialisation
Table 7: kWh consumed per citizen in each regional area in one year. Source: Terna (2011)
Region
Dr[kWh/y]
Abruzzi
4913
Basilicata
4497
Calabria
2819
Campania
3014
Emilia Romagna
6242
Friuli Venezia Giulia
8118
Lazio
4077
Liguria
4029
Lombardia
6674
Marche
4768
Molise
4403
Piemonte
5701
Puglia
4597
Sardegna
6728
Sicilia
3836
Toscana
5400
Trentino Alto Adige
6406
Umbria
6022
Valle d’Aosta
7490
Veneto
6060
Table 8: Number of people for each region in the simulation. Source: Comuni Italiani (2012)
Region
Residents
2% of Residents
Number of Groups (N)
Abruzzo
1342366
26847
26
Basilicata
587517
11750
11
Calabria
2011395
40227
40
Campania
5834056
116681
116
Emilia-Romagna
4432418
88648
88
Friuli-Venezia Giulia
1235808
24716
24
Lazio
5728688
114573
114
Liguria
1616788
32335
32
Lombardia
9917714
198354
198
Marche
1565335
31306
31
Molise
319780
6395
6
Piemonte
4457335
89146
89
Puglia
4091259
81825
81
Sardegna
1675411
33508
33
Sicilia
5051075
101021
101
Toscana
3749813
74996
74
Trentino-Alto Adige
1037114
20742
20
Umbria
906486
18129
18
Valle d’Aosta
128230
2564
2
Veneto
4937854
98757
98
Total
60626442
1212528
1202
Table 9: Regional functioning hours and relative yearly share
Wind
PV
CHP
NG
Region
hours
\(x_{Wind,r}\)
hours
\(x_{PV,r}\)
hours
\(x_{CHP,r}\)
hours
\(x_{NG,r}\)
Abruzzi
708
8.09%
1236
14.11%
3000
34.24%
3814
43.54%
Basilicata
1326
15.14%
1327
15.15%
3000
34.24%
3106
35.45%
Calabria
1460
16.67%
1329
15.17%
3000
34.24%
2970
33.9%
Campania
1218
13.91%
1261
14.4%
3000
34.24%
3279
37.43%
Emilia Romagna
1011
11.54%
1095
12.5%
3000
34.24%
3653
41.7%
Friuli Venezia Giulia
2495
28.48%
1100
12.56%
3000
34.24%
2163
24.69%
Lazio
1490
17.01%
1257
14.35%
3000
34.24%
3011
34.37%
Liguria
949
10.83%
1172
13.38%
3000
34.24%
3638
41.53%
Lombardia
671
7.66%
1117
12.75%
3000
34.24%
3970
45.33%
Marche
1018
11.62%
1245
14.21%
3000
34.24%
3496
39.91%
Molise
1646
18.79%
1276
14.56%
3000
34.24%
2837
32.38%
Piemonte
1015
11.59%
1198
13.67%
3000
34.24%
3545
40.47%
Puglia
1953
22.3%
1350
15.41%
3000
34.24%
2455
28.03%
Sardegna
1609
18.37%
1369
15.63%
3000
34.24%
2780
31.74%
Sicilia
2207
25.19%
1397
15.95%
3000
34.24%
2155
24.6%
Toscana
1042
11.89%
1147
13.1%
3000
34.24%
3570
40.75%
Trentino Alto Adige
1326
15.14%
1047
11.95%
3000
34.24%
3386
38.65%
Umbria
1393
15.91%
1235
14.1%
3000
34.24%
3130
35.73%
Valle d’Aosta
1326
15.14%
1219
13.92%
3000
34.24%
3213
36.68%
Veneto
657
7.5%
1095
12.5%
3000
34.24%
4007
45.74%
Table 10: Maximum number of users in an investment community, \(N_{t,r}\)
Technology
Wind
PV
CHP
Power [kW]
30
20
50
MG capacity
Demand (\(D_r\))
\(N_{t,r}\)
Region
[kWh/y]
[kWh/y]
[kWh/y]
[kWh/y]
[kWh/y/capita]
max value
Abruzzi
21261
24726
150000
195988
4913
39
Basilicata
39796
26546
150000
216342
4497
48
Calabria
43812
26586
150000
220399
2819
78
Campania
36565
25238
150000
211803
3014
70
Emilia Romagna
30340
21901
150000
202241
6242
32
Friuli Venezia Giulia
74860
22019
150000
246879
8118
30
Lazio
44720
25154
150000
219874
4077
53
Liguria
28471
23444
150000
201915
4029
50
Lombardia
20153
22344
150000
192498
6674
28
Marche
30547
24902
150000
205450
4768
43
Molise
49405
25521
150000
224926
4403
51
Piemonte
30475
23965
150000
204440
5701
35
Puglia
58610
27009
150000
235619
4597
51
Sardegna
48297
27384
150000
225682
6728
33
Sicilia
66218
27953
150000
244171
3836
63
Toscana
31266
22955
150000
204222
5400
37
Trentino Alto Adige
39796
20941
150000
210737
6406
32
Umbria
41817
24719
150000
216536
6022
35
Valle d’Aosta
39796
24395
150000
214192
7490
28
Veneto
19718
21901
150000
191620
6060
31
References
ABRAHAMSON, E. & Rosenkopf, L. (1993). Institutional and Competitive Bandwagons: Using Mathematical Modeling as a Tool to Explore Innovation Diffusion. The Academy of Management Review, 18(3), 487–517.
[doi:10.5465/amr.1993.9309035148]
ABRAHAMSON, E. & Rosenkopf, L. (1997). Social Network Effects on the Extent of Innovation Diffusion: A Computer Simulation. Organization Science, 8(3), 289–309.
ACKERMANN, T., Andersson, G. & Söder, L. (2001). Distributed Generation: a definition. Electric Power Systems Research, 57, 195–204.
[doi:10.1016/S0378-7796(01)00101-8]
AGRELL, P. J., Bogetoh, P. & Mikkers, M. (2013). Smart-grid investments, regulation and organization. Energy Policy, 52, 656–666.
AKOREDE, M. F., Hizam, H. & Pouresmaeil, E. (2010). Distributed energy resources and benefits to the environment. Renewable and Sustainable Energy Reviews, 14(2), 724–734.
[doi:10.1016/j.rser.2009.10.025]
ANTONELLI, C. & Ferraris, G. (2011). Innovation as an emerging system property: an agent based simulation model. Journal of Artificial Societies and Social Simulation, 14(2), 1: https://www.jasss.org/14/2/1.html.
ARTHUR, W. B. (1989). Competing Technologies, Increasing Returns, and Lock-in Events Historical. The Economic Journal, 99(394), 116–131.
[doi:10.2307/2234208]
ASMUS, P. (2001). The War against Terrorism Helps Build the Case for Distributed Renewables. The Electricity Journal, 14(10), 75–80.
BALRAM, S. & Dragićević, S. (2005). Attitudes toward urban green spaces: Integrating questionnaire survey and collaborative GIS techniques to improve attitude measurements. Landscape and Urban Planning, 71(2-4), 147–162.
[doi:10.1016/S0169-2046(04)00052-0]
BATTAGLINI, A., Lilliestam, J., Haas, A. & Patt, A. (2009). Development of SuperSmart Grids for a more efficient utilisation of electricity from renewable sources. Journal of Cleaner Production, 17(10), 911–918.
BLOCK, C., Neumann, D. & Weinhardt, C. (2008). A market mechanism for energy allocation in micro-CHP grids. In Proceedings of the Annual Hawaii International Conference on System Sciences, May 2006, pp. 1–11.
BOLLINGER, B. & Gillingham, K. (2012). Peer Effects in the Diffusion of Solar Photovoltaic Panels. Marketing Science, 31(6), 900–912.
[doi:10.1287/mksc.1120.0727]
BOLLINGER, L. A., van Blijswijk, M. J., Dijkema, G. P. & Nikolic, I. (2016). An Energy Systems Modelling Tool for the Social Simulation Community. Journal of Artificial Societies and Social Simulation, 19(1), 1: https://www.jasss.org/19/1/1.html.
BORRILL, P. L. & Tesfatsion, L. (2011). Agent-Based Modeling: The Right Mathematics for the Social Sciences? Iowa State Universitiy, Working Paper No. 10023, (November 2010).
CHIRADEJA, P. & Ramakumar, R. (2004). An approach to quantify the technical benefits of distributed generation. IEEE Transactions on Energy Conversion, 19(4), 764–773.
DIAMOND, D. (2009). The impact of government incentives for hybrid-electric vehicles: Evidence from US states. Energy Policy, 37, 972–983.
DRIESEN, J. & Katiraei, F. (2008). Design for distributed energy resources. IEEE Power and Energy Magazine, 6(3).
EKER, S. & van Daalen, E. (2015). A model-based analysis of biomethane production in the Netherlands and the effectiveness of the subsidization policy under uncertainty. Energy Policy, 82(1), 178–196.
EUROPEAN Commission (2015). Delivering a New Deal for Energy Consumers. Brussels, 15.7.2015: COM(2015) 339 final.
FABER, A. & Frenken, K. (2009). Models in evolutionary economics and environmental policy: Towards an evolutionary environmental economics. Technological Forecasting and Social Change, 76(4), 462–470.
FABER, A., Valente, M. & Janssen, P. (2010). Exploring domestic micro-cogeneration in the Netherlands: An agent- based demand model for technology diffusion. Energy Policy, 38(6), 2763–2775.
[doi:10.1016/j.enpol.2010.01.008]
GARCIA, R. & Jager, W. (2011). From the Special Issue Editors: Agent-Based Modeling of Innovation Diffusion. Journal of Product Innovation Management, 1(28), 148–151
GERSHO, A. & Mitra, D. (1975). A Simple Growth Model for the Diffusion of a New Communication Service. IEEE Transactions on Systems, Man, and Cybernetics (2), 209-216.
[doi:10.1109/TSMC.1975.5408474]
GILBERT, N. (2004). Agent-based social simulation: dealing with complexity. The Complex Systems Network of Excellence, 9, 1–14.
GROH, S. (2014). The role of energy in development processes - The energy poverty penalty: Case study of Arequipa (Peru). Energy for Sustainable Development, 18, 83–99.
[doi:10.1016/j.esd.2013.12.002]
HADLEY, S. & Van Dyke, J. (2005). Emissions benefits of distributed generation in the Texas market. April. DOE, Department of Energy.
HANSLA, A., Gamble, A., Juliusson, A. & Gärling, T. (2008). Psychological determinants of attitude towards and willingness to pay for green electricity. Energy Policy, 36(2), 768–774.
HATZIARGYRIOU, N. D. & Meliopoulos, A. P. S. (2002). Distributed energy sources: technical challenges. In Power Engineering Society Winter Meeting, 2002. IEEE, (Vol. 2, pp. 1017-1022). IEEE.
[doi:10.1109/PESW.2002.985163]
HIGGINS, A., Paevere, P., Gardner, J. & Quezada, G. (2012). Combining choice modelling and multi-criteria analysis for technology diffusion: An application to the uptake of electric vehicles. Technological Forecasting and Social Change, 79(8), 1399–1412.
HYYSALO, S., Johnson, M. & Juntunen, J. K. (2016). The diffusion of consumer innovation in sustainable energy technologies. Journal of Cleaner Production, 162, S70-S82.
[doi:10.1016/j.jclepro.2016.09.045]
KWAKKEL, J. H. & Pruyt, E. (2013). Exploratory Modeling and Analysis, an approach for model-based foresight under deep uncertainty. Technological Forecasting and Social Change, 80(3), 419–431.
[doi:10.1016/j.techfore.2012.10.005]
LASSETER, R. (2002). MicroGrids. 2002 IEEE Power Engineering Society Winter Meeting. Conference Proceedings (Cat. No.02CH37309), 1, 305–308.
LOPES, J. A. P., Hatziargyriou, N., Mutale, J., Djapic, P. & Jenkins, N. (2007). Integrating distributed generation into electric power systems: A review of drivers, challenges and opportunities. Electric Power Systems Research, 77(9), 1189–1203.
[doi:10.1016/j.epsr.2006.08.016]
MADLENER, R. & Schmid, C. (2003). Adoption and diffusion of decentralised energy conversion technologies: the success of engine co-generation in Germany. Energy and Environment, 14(5), 627–662
MARKARD, J. & Truuer, B. (2006). Innovation processes in large technical systems: Market liberalization as a driver for radical change? Research Policy, 35, 609–625.
[doi:10.1016/j.respol.2006.02.008]
MARNAY, C., Asano, H., Papathanassiou, S., & Strbac, G. (2008). Policymaking for microgrids. IEEE Power and Energy Magazine, 6(3).
MOALLEMI, E. A., de Haan, F., Kwakkel, J. & Aye, L. (2017). Narrative-informed exploratory analysis of energy transition pathways: A case study of India’s electricity sector. Energy Policy, 110, 271–287.
[doi:10.1016/j.enpol.2017.08.019]
NYKVIST, B. & Nilsson, M. (2015). Rapidly falling costs of battery packs for electric vehicles. Nature Climate Change, 5(4), 329–332.
OLSON, M. J. (1971). The Logic of Collective Action. Public Goods and the Theory of Groups, Second printing with new preface and appendix. Harvard Economic Studies.
OSTROM, E. (1990). Governing the Commons. The Evolution of Institutions for Collective Action. Cambridge: Cambridge University Press.
OSTROM, E., Gardner, R. & Walker, J. (1994). Rules, Games, and Common-Pool Resources. Ann Arbor, MI: Michigan University Press.
[doi:10.3998/mpub.9739]
OUCHI, W. G. (1980). Markets, Bureaucracies, and Clans. Administrative Science Quarterly, 25(1), 129–141.
PEPERMANS, G., Driesen, J., Haeseldonckx, D., Belmans, R. & D’haeseleer, W. (2005). Distributed generation: Definition, benefits and issues. Energy Policy, 33(6), 787–798.
[doi:10.1016/j.enpol.2003.10.004]
ROGERS, E. M. (2003). Diffusion of innovations. New York: Simon & Schuster, 5th edn.
SAFARZYŃSKA, K., Frenken, K. & van den Bergh, J. (2012). Evolutionary theorizing and modeling of sustainability transitions. Research Policy, 41, 1011–1024.
SAUTER, R. & Watson, J. (2007). Strategies for the deployment of micro-generation: Implications for social acceptance. Energy Policy, 35, 2770–2779.
[doi:10.1016/j.enpol.2006.12.006]
SCHOT, J., Kanger, L. & Verbong, G. (2016). The roles of users in shaping transitions to new energy systems. Nature Energy, 1(5), 16054.
SCHWARZ, N. & Ernst, A. (2009). Agent-based modeling of the diffusion of environmental innovations - An empirical approach. Technological Forecasting and Social Change, 76(4), 497–511.
[doi:10.1016/j.techfore.2008.03.024]
SHAFIEI, E., Thorkelsson, H., Ásgeirsson, E. I., Davidsdottir, B., Raberto, M. & Stefansson, H. (2012). An agent- based modeling approach to predict the evolution of market share of electric vehicles: A case study from Iceland. Technological Forecasting and Social Change, 79(9), 1638–1653.
SIDDIQUI, A. S. & Maribu, K. (2009). Investment and upgrade in distributed generation under uncertainty. Energy Economics, 31(1), 25–37.
[doi:10.1016/j.eneco.2008.08.007]
SMALLWOOD, D. E. & Conlisk, J. (1979). Product Quality in Markets Where Consumers are Imperfectly Informed. The Quarterly Journal of Economics, 93(1), 1–23
TARDE, G. (1962). The laws of imitation. Peter Smith Publisher
TESFATSION, L. (2003). Agent-based computational economics: modeling economies as complex adaptive systems. Information Sciences, 149(4), 262–268.
VALENTE, M. (2008). Laboratory for Simulation Development: LSD. LEM Working Paper Series, (No. 2008/12): http://hdl.handle.net/10419/89554.
VASILJEVSKA, J., Douw, J., Mengolini, A. & Nikolic, I. (2017). An Agent-Based Model of Electricity Consumer: Smart Metering Policy Implications in Europe. Journal of Artificial Societies and Social Simulation, 20(1), 12: https://www.jasss.org/20/1/12.html.
[doi:10.18564/jasss.3150]
WATSON, J. (2004). Co-provision in sustainable energy systems: the case of micro-generation. Energy Policy, 32, 1981–1990.
[doi:10.1016/j.enpol.2004.03.010]
WEISS, M., Dittmar, L., Junginger, M., Patel, M. K. & Blok, K. (2009). Market diffusion, technological learning, and cost-benefit dynamics of condensing gas boilers in the Netherlands. Energy Policy, 37(8), 2962–2976.
WOLSINK, M. (2012). The research agenda on social acceptance of distributed generation in smart grids: Renewable as common pool resources. Renewable and Sustainable Energy Reviews, 16, 822–835.
[doi:10.1016/j.rser.2011.09.006]
ZHANG, T., Gensler, S., & Garcia, R. (2011). A Study of the Diffusion of Alternative Fuel Vehicles: An Agent‐Based Modeling Approach. Journal of Product Innovation Management, 28(2), 152-168.
ZHANG, T. & Nuttall, W. J. (2008). Evaluating Government’s Policies on Promoting Smart Metering in Retail Electricity Markets via Agent Based Simulation. Energy, (August), 169–186.