
Introduction
The recent rise in electric vehicle (EV) adoption is generally seen as positive, as EVs potentially provide a cleaner alternative to traditional vehicles. Yet for EVs to realize this potential, individual consumers do not only need to adopt EVs, they also need to use the technologies and infrastructure in a sustainable way (Steg 2016). EVs are a clean mode of transport when charged with energy from renewable sources, such as wind energy and photovoltaic (PV) solar energy. Furthermore, EVs could contribute to the integration of intermittent renewable energy sources into the grid; as a source of flexible demand or as storage in vehicle-to-grid (V2G) systems (van der Kam et al. 2018). However, charging large EV-fleets poses challenges to the electricity grid, since both total and instantaneous peak demand might increase significantly, possibly leading to severe local congestion at transformer stations (Eising, van Onna and Alkemade 2014) and higher electricity market prices (Ensslen et al. 2018b). Currently, EVs are typically charged in the early evening, when electricity demand of households is high and renewable energy production is low (E-Laad 2013). EV users should thus be encouraged to act in a more sustainable way, by actively or passively shifting charging demand or to take part in smart charging or vehicle-to-grid schemes operated by parties such as aggregators.
There are several types of interventions to encourage people to act in a more sustainable way (Steg 2016) (e.g. charging their EV’s at times of surplus of sustainable energy) including different policy instruments, for instance regulations, financial incentives or information campaigns. Other factors influencing sustainable EV charging include the driving needs of EV drivers, the available charging infrastructure, renewable energy capacity, and other sources of energy demand, such as households. In the present study, we capture the influence of different policy instruments on sustainable EV charging with an agent-based model (ABM). Such models are useful tools for investigating strategies stimulating behavioural change, as they allow systematic explorations of changes in social systems over long time periods, which would be costly and impractical to test in real life. Furthermore, the flexible architecture of ABMs allows the incorporation of empirical data, where available, leading to more realistic scenarios.
Given the complexity of many energy systems, it is not surprising that ABMs are an increasingly popular tool among energy scholars. Typical topics of ABMs are diffusion of innovations (e.g., of electric vehicles, Dijk, Kemp & Valkering 2013; Eppstein et al. 2011; Kangur et al. 2017; McCoy & Lyons 2014; Mueller & de Haan 2009; Noori & Tatari 2016; Shafiei et al. 2012; Zhang, Gensler & Garcia 2011), PV solar panels (Opiyo 2015; Palmer, Sorda & Madlener 2015; Robinson & Rai 2015), green electricity contracts (Krebs 2017), smart meters (Zhang, Siebers & Aickelin 2016)), energy transitions (Holtz et al. 2015; Köhler et al. 2018; Li, Trutnevyte & Strachan 2015), and energy demand (Gotts & Polhill 2017; Jensen, Holtz & Chappin 2015). Most ABMs in the field of energy are focused on ex ante policy evaluation (Rai & Henry 2016). Recognizing the many uncertainties of future energy systems, exploring scenarios through ABMs can provide insight in the potential effect of policies, thereby supporting the identification of robust policies for the energy transition (Holtz et al. 2015).
Several ABMs have been proposed to study the future of electric vehicle charging. Mallig et al. (2016) model EV ownership and electricity demand in the Greater Stuttgart area, for three scenarios with different market penetration and charging opportunities. Agents are household members, and only the agents with travel ranges suitable for EVs, own an EV. All agents charge at home or, when possible, at the workplace or shopping area, and are not subject to a specific charging strategy. Study results indicate that EV charging peaks occur in the evening, at times when no surplus of renewable energy can be expected. This indicates a need for intelligent charging strategies, which shift the charging of EVs to times when a surplus of renewable energy is available. Olivella-Rosell, Villafafila-Robles & Sumper (2015) propose a probabilistic agent-based model of electric vehicle charging demand to analyse the impact on distribution networks in Barcelona. Agents can charge at trip destinations and base their charging behaviour on range anxiety and energy price. The electricity market and aggregator are also represented as an agent. It is concluded that direct or indirect control of EV charging can reduce the negative impact of EVs on the grid. Waraich et al. (2013) use an agent-based traffic demand model to model electricity demand of EVs. They build on the existing model MATSim (MATSIM-T 2008), which is a large scale agent-based traffic model, with four hubs, and includes roads and traffic jams. Several charging schemes are simulated; dumb charging, dual tariff charging and smart charging. In the dual tariff charging scheme, agents determine their charging behaviour based on the electricity price. In the smart charging scheme, a central utility controls the charging behaviour. The model determines whether EV charging and other loads violate physical network conditions. They conclude that smart charging schemes including communication between EVs and the grid can overcome grid issues that arise from dual tariff charging schemes.
The discussed simulation models let user behaviour be determined by driving needs and costs. Although financial (e.g. costs and benefits) or hedonic (e.g. pleasure and comfort) considerations affect the likelihood to engage in pro-environmental behaviour, normative considerations (e.g. the right thing to do) also are an important factor promoting pro-environmental behaviour. More specifically, a growing body of research shows that individuals are not rational decision makers who carefully balance costs and benefits to maximise the utility of their behaviour, and that normative considerations are important predictors for pro-environmental behaviour in general (Lindenberg & Steg 2007; Steg 2016; Steg et al. 2014; Steg, Perlaviciute & van der Werff 2015; Abrahamse & Shwom 2018). Research suggests that normative considerations may in some cases even be a more important predictor of pro-environmental behaviour than financial incentives (Kobus, Mugge & Schoormans 2013; Schmalfuß et al. 2015). Moreover, the effect of financial incentives may decrease when the incentive is no longer in place (Bolderdijk et al. 2011). Hence, simulation models of EV charging rely too much on cost and benefit assumptions, ignoring important psychological drivers of behaviour (Sovacool et al. 2015).
We incorporate recent theory from environmental psychology on the concept of environmental self-identity in the modelling of EV charging to address these normative considerations. Environmental self-identity is the extent to which one sees oneself as an environmentally friendly person, and has been found to promote different pro-environmental behaviours (Van der Werff, Steg & Keizer 2013a, 2014a, 2014b), including sustainable charging (Peters, van der Werff & Steg 2018). Furthermore, we incorporate range anxiety, that is the anxiety about the loss of flexibility in individual mobility, as research has shown that this is an important factor influencing the acceptance of sustainable charging behaviour (Franke & Krems 2013; Will & Schuller 2016). Especially the more unexperienced EV-drivers do not estimate their range needs accurately, resulting in range anxiety (Franke & Krems 2013).
Our ABM consists of EV drivers, charging stations, renewable energy supply, and the built environment. EV drivers decide where and when to charge their vehicle, depending on driving needs, agent characteristics and policy interventions. We mainly use data sources from the Netherlands, a front-runner country in EV deployment. The Netherlands had the third most EV sales within the EU in 2018, after Germany and France (ACEA 2018), and the Dutch government has the ambition that by 2030 all new vehicles sold in the Netherlands are zero-emission vehicles (VVD, CDA, D66 & ChristenUnie 2017). Furthermore, several on-going projects experimenting with and develop smart charging of EVs and V2G[1]. This makes the Netherlands an excellent case for studying the transition towards the integration of clean transport and renewable energy.
The purpose of this paper is to present a proof-of-principle ABM, demonstrating the viability of our approach in modelling EV charging demand. In particular, our aim is to demonstrate how ABMs can be used for a systematic comparison of potential policy interventions that target sustainable charging of consumers. Contrary to earlier ABMs focussing exclusively on financial incentives, we include a model incorporating important psychological drivers of behaviour, such as environmental self-identity and range anxiety. In order to ensure realistic scenarios, our model is based on empirical data as much as possible. However, some psychological variables in our model are difficult to parameterize. We explore the importance of these uncertainties with model exploration techniques (Kwakkel & Pruyt 2013). We evaluate agent behaviour on the system level by using energy demand and supply, and user satisfaction as indicators.
This paper is further organised as follows: we first describe the model used in more detail, then present several simulation runs and end with a discussion of our model and simulation results.
Model Description
This section describes our model. We first present an overview and then discuss the separate elements in depth.
Model overview
Figure 1 presents an overview of our model. Agents represent EV drivers that either move, charge, or do nothing. The agents move towards and over grid cells, which have a function (residential, commercial, office or none). At some grid cells agents can charge their EV. Included in their environment are local sources of energy demand and energy supply, and policy interventions targeting charging behaviour. These factors influence how the agents charge. We measure model output using the indicators (1) self-sufficiency, (2) self-consumption, (3) peak net demand, (4) peak oversupply, and (5) kms – electric. The first four are related to the balance of energy demand (of the buildings and EVs) and supply (of local intermittent energy sources). The last indicator is related to whether the EVs are charged sufficiently to meet driving demands and thus to user satisfaction.

Sources of electricity demand in the model are the households of the agents and the service sector (offices, shops, hospitals, schools, etc.) scaled to the number of agents using Dutch statistics. Sources of electricity supply are PV solar energy and wind energy. At each time-step, the energy balance between the total electricity demand of the residential and service sector and the total electricity supply from renewable energy sources is calculated. The agents either drive towards a destination or stay at their location. If the agents are not moving, they can charge their EV if a charging station is available. The agents can charge their vehicle in three different modes. We distinguish these modes by how much renewable energy is used to charge the EVs. The three modes are:
- Mode 1: the EV always charges at maximum capacity (until the battery is full)
- Mode 2: the EV always charges at maximum capacity until the battery level is at a specific minimum level chosen by the agent, and only charges additionally in times of renewable energy surplus
- Mode 3: the EV only charges at times of renewable energy surplus.
Mode 1 is considered the least sustainable charging mode, and mode 3 the most sustainable charging mode. The modes available to agents depends on the policy in place. Table 1 shows which modes are available for the different policy interventions. In what follows, we discuss each policy intervention and how this is operationalized in our ABM.
| Policy intervention | Possible charging modes |
| No intervention | Mode 1 |
| Dual tariff scheme | Mode 2 |
| Automated smart charging | Mode 3 |
| Information and feedback | Mode 1, 2, or 3 (depending on environmental self-identity and range anxiety) |
Under the policy intervention information and feedback, the mode that the agent chooses to charge in is dependent on the numerical difference between its environmental self-identity and its range anxiety. A high value for environmental self-identity leads to an agent charging more sustainable, while a high value for range anxiety leads the agent to charge less sustainable.
In our implementation of the model, we use discrete time-steps, with one time-step representing five minutes. Each grid cell represents 2 km x 2 km and the model landscape comprised 66 km x 66 km, i.e. 4356 square km2.
Tables 2-4 present the state variables for the agents, grid cells and environment respectively.
| Name | Description | Domain | Static? |
| Location | Location of agent | Coordinates | N |
| Vehicle model | Specific EV model, this determines battery size | EV models in NL | Y |
| Home | Grid cell where the agents' home is located | Coordinates | Y |
| Home-charge? | Whether an agent can charge at home | {true, false} | Y |
| Destination | Destination of trip (can also be current location of agent) | Coordinates | N |
| Next-trip | Time when agent will start its next trip (and change destination) | minutes | N |
| SOC | State-of-charge of the battery in the EV | [0;1] | N |
| Charging? | Whether the agent is charging | {true, false} | N |
| Environmental self-identity | Score for environmental self-identity | [-1;1] | N |
| ωESI | Weighing factor for environmental self-identity | [0;1] | N |
| IncESI | Increment in environmental self-identity | [0;1] | N |
| DecESI | Decrement in environmental self-identity | [0;1] | N |
| Range anxiety | Score for range anxiety | [0;1] | N |
| ωRA | Weighing factor for range anxiety | [0;1] | N |
| IncRA | Increment in range anxiety | [0;1] | N |
| DecRA | Decrement in decreasing range anxiety | [0;1] | N |
| Name | Description | Domain | Static? |
| Location | Location of the grid cell | Coordinates | Y |
| Function | The function of the grid cell | {residential, commercial, office, none} | Y |
| Charging-point? | Whether an EV can be charged at this cell | {true, false} | Y |
| Charging-power | Maximum charging power of charging station at this point | kW | N |
| Available? | Whether a charging-point is available (not occupied or reserved by an agent) | {true, false} | N |
| Name | Description | Domain | Static? |
| Time | Time of the year | minutes | N |
| PV capacity | Total installed PV capacity in the model | MWp | Y |
| PV production | Real-time power supply from PV | kW | N |
| Wind capacity | Total installed wind energy capacity | MW | Y |
| Wind production | Real-time power supply from wind turbines | kW | N |
| Energy demand residential | Real-time power demand of residential buildings | kW | N |
| Energy demand service sector | Real-time power demand of service sector | kW | N |
| Policy intervention | Which policy intervention, aimed at increasing use of renewable energy for EV charging, is implemented | {No intervention, dual tariff scheme, automated smart charging, information and feedback} | Y |
| Unlimited-charging? | Whether every destination has an available charging point | {true, false} | Y |
| Social-charging? | Whether agents move their EV away from a public or semi-public charging station if battery is full | {true, false} | Y |
| Central control? | Whether there is a central control system (relevant for the policy intervention automated smart charging | {true, false} | Y |
EV fleet
The EV fleets in the model are based on the current EV fleet in the Netherlands, using data from the Netherlands Vehicle Authority (RDW, in Dutch: Rijksdienst voor het Wegverkeer). Agents are assigned an EV from this dataset randomly. We chose to only use FEVs in our model, and not plug-in hybrid electric vehicles (PHEVs). We think modelling FEVs is more interesting than PHEVs because they have a larger battery capacity than PHEVs and can therefore have a larger impact on the grid. Furthermore, FEVs are dependent on charging infrastructure, unlike PHEVs, and its drivers will therefore more likely experience range anxiety than PHEV drivers. The relevant characteristic is the battery capacity of the EV. As an alternative, the model allows for a manual input of battery size, which is then the same for all agents. The number of EVs is a variable in our model. In the simulations, the total EV fleet consists of 500 vehicles. As long as the vehicle fleet is not very small (e.g. <50 vehicles), our final results are not sensitive for the number of EVs, since in our model energy demand and charging infrastructure scale with the number of EVs.
To determine the speed of the EVs we use data from a large, annually recurring study into Dutch mobility, “Onderzoek Verplaatsingen in Nederland (OViN) 2016”. The average speed found in the OViN database is 19 km per hour, so at each time-step an EV can move 0.8 patch.
Layout of area
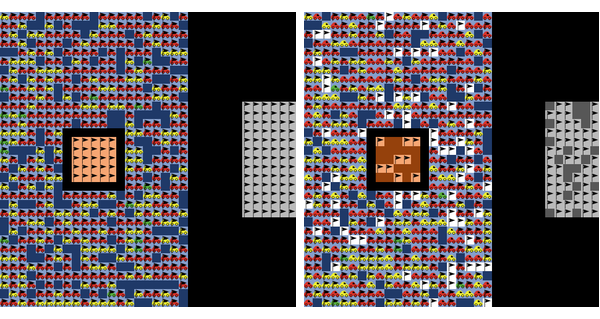
In our model, the world consists of a residential area, an office area and a commercial area. Figure 2 shows a screenshot of the area as implemented in NetLogo (Wilensky 1999). The layout of the area is based on design by the modellers. The residential area, commercial area and office area are fixed for each simulation. However, the exact location of both houses and charging stations is determined randomly, and varies for each simulation. In order to determine the distance between patches, we compared the average annual distance driven by agents in the model to the average annual distance driven by passenger vehicles in the Netherlands in 2016 (CBS 2018), which is 11800 km. By doing so, we have set the distance represented by patches to 2 km per patch.
Charging stations
Agents can charge a depleted battery at private charging stations (at their house), semi-public charging stations (at an office or at a shop) and public charging stations (in the residential area). One parameter in our model is the availability of charging stations. This parameter can be changed between unlimited availability, in which case every house has a charging station and offices and shops have enough charging stations available for each agent, and limited availability, in which case we base the number of private, public, semi-public and fast charging points in our model on the Dutch situation per July 31 2017 (RVO 2017), see Table 5.
| Type of charging station | # of charging stations per 500 passenger EVs |
| Private | 324 |
| Public | 62 |
| Semi-public | 67 |
| Fast charging | 3 |
Many agents have a private charging station at their house. This means that only that agent can access this charging station. In our model, private charging stations have a maximum power capacity of 6 kW.
Public charging stations are accessible by all agents. In our model, public charging stations are randomly distributed over the residential area. Only agents that do not have a private charging station use the public charging stations. When these agents go home, they select a public charging station that is not occupied and as close to their home as possible. When all public charging stations are occupied they go to their house, and are thus not able to charge their vehicle. The model has the option that, when an EV is fully charged, the agent will drive the vehicle home, and thus frees the charging station. When this option is not selected, the EV will occupy the charging station until the agent needs the EV for a trip to the office area or the shops. The public charging stations have a maximum power capacity of 6 kW.
Semi-public charging stations are private charging stations made accessible to others by their owners. Such charging stations are common in for instance shopping malls, office buildings and parking garages (RVO 2017). In our model, semi-public charging stations can be found in the office area and the commercial area. In order to determine how the total number of semi-public charging stations is divided between these two areas, we have investigated the charging demand of the agents in both areas. Through running simulations, we found that charging demand in the office area is 6.7 times greater than the charging demand in the commercial area, and we have divided the semi-public charging stations accordingly. To our knowledge, there is no data available to check whether this division is accurate for the Netherlands. When all charging stations are occupied, the agents have to wait to charge their vehicle. The model has the option that, when an EV is fully charged, the agent will free the charging station. When this option is not selected, the EV will occupy the charging station until the agent needs the EV for a trip to house or the shops. The public charging stations have a maximum power capacity of 6 kW.
Fast charging stations are public or semi-public charging stations with a maximum power capacity of 46 kW (AC) or 50 kW (DC). For the sake of simplicity, we have not integrated fast charging stations in the present model. When we would implement fast charging stations, agents would have to weigh fast charging their EV at a location far from their destination against slow charging their EV at a location close to their destination. We think that adding this consideration would make our model more complicated, while it does not contribute to the research objective.
Calculating the energy balance
As the model runs, the energy balance influences the charging process. The energy demand comes from the households and the service sector. The household demand profiles are estimated using a dataset containing 400 unique household profiles with a time resolution of 15 minutes as provided by Claessen et al. (2014). The dataset is based on measurements from distribution system operator Liander. The demand profiles of the service sector are based on an American dataset (Deru et al. 2011), adapted to Dutch conditions by (Voulis et al. 2017). The dataset includes demand profiles with a time resolution of 1 hour for hospitals, hotels, offices, schools, shops, and restaurants, which in our model are scaled to the number of households (agents) as in Table 1 in (Voulis et al. 2017). The demand profiles for households and the service sector are interpolated to 5 minutes time resolution.
Renewable energy supply can be from either PV or wind. We model PV yield with a time resolution of 5 minutes with the open source package PVLIB (Andrews, Stein, Hansen, & Riley 2014), based on Royal Netherlands Meteorological Institute (KNMI) solar irradiation data (KNMI 2018). Specifications of the Sanyo HIP-225HDE1 module and the Enphase Energy M250 inverter were used as input for the model. The modelled PV modules have an azimuth of 180 degrees (directed South) and a tilt of 37 degrees, which are the optimal conditions for PV energy generation in the Netherlands (Litjens, Van Sark, & Worrell 2017). We assume the specific annual PV yield to be 875 kWh/kWp, which is the current average PV yield for the Netherlands (van Sark et al. 2014). There is no data on wind energy generation with a fine time resolution available for the Netherlands. Therefore we use aggregate 15 minute data from Belgian onshore wind farms (Elia 2018), as it can be expected that Belgian results can be used for the Dutch case given that they are relatively small, neighbouring countries, both with a coast at the North Sea. According to this data, 1 MW installed wind capacity produces 1.8 GWh per year, i.e. a capacity factor of 20.5%. We have interpolated the data to a 5 minutes time resolution.
The total energy demand is dependent on the number of agents in the model. The energy demand of the households and the service sector is scaled to the number of agents. The energy supply is dependent on the installed capacity for PV and wind. Equations (1)-(3) describe the calculation:
| $$\text{total energy demand} = N_{\textit{agents}} (E_{\textit{household}} + E_{\textit{service,profile}})$$ | (1) |
| $$\text{energy supply} = C_{PV} E_{PV,\textit{profile}} + C_\textit{wind} E_\textit{wind,profile}$$ | (2) |
| $$\text{energy balance} = \text{energy supply} - \text{totale energy demand}$$ | (3) |
With Nagents the number of agents in the simulation, Ehousehold the energy demand for 1 household, Eservice,profile the profile for energy demand of the service sector per household, CPV the installed PV capacity, EPV,profile the profile for PV energy supply, Cwind the installed wind energy capacity, and Ewnd,profile the profile for wind energy supply.
Driving behaviour of agents
In order to simulate realistic driving behaviour, we use the OViN 2016 dataset (CBS 2016). This dataset contains one-day transport diaries of a randomly chosen set of correspondents in the Netherlands. From this dataset we have extracted all one-day diaries of vehicle owners. Then, we selected all one-day diaries in which the vehicle owner travels between home and work or a shop. From this subset of the data, we extract the start times of the trips and the destination. At the start of each day in the simulation, an agent randomly chooses a one-day diary from a corresponding day of the week (Monday, Tuesday, Wednesday, Thursday, Friday, Saturday, Sunday). At the corresponding time, the agent will then drive the vehicle to home, the office or a shop. Based on the OViN dataset, we have calculated the number of vehicle-owners that do not make daily use of their vehicle. Agents have a corresponding chance to select an empty diary and stay at home during the day. The vehicle battery is depleted dependent on the distance driven and estimated energy use per km driven (0.2 kWh/km). The underlying assumption of using this data is that EVs will be used in the same manner as vehicles are used now.
Figure 3 presents an overview of how agents move and decide to charge. The agent reads in the diary the time it starts its next trip and what the destination of that trip is (home, office, or commercial area, see Figure 1 for the layout of the area). If the agent is not at its destination it will move in a straight line towards it with a speed of 0.8 patch per time-step. Our model does not consider roads. If the agent is at its destination and the battery is not completely full (SOC < 1) the agent can charge its vehicle (the charging process is described in the next item).

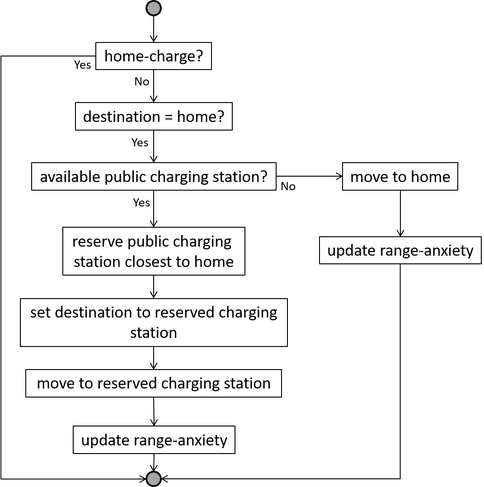
Not all agents can charge at their home. These agents thus have to charge at public or semi-public charging stations. The agents can charge at the semi-public charging stations when they visit the office or commercial area, otherwise they have to use public charging stations. In our model, the agents have to make a reservation for a charging station (e.g. via an app), see Figure 4. Note that if a simulation is run with unlimited charging agents can charge at each location and reserving is not necessary.
When running simulation with “social charging”, agents will receive a message when they are at a public or semi-public charging station and their battery is full. [2] The agent will then move its EV to the closest patch with no charging station. Note that if a simulation is run with unlimited charging agents can charge at each location and social charging is not necessary.
Charging behaviour of agents
As discussed in the model overview, agents can charge their vehicle in three different modes, which are distinguished by how much renewable energy is used to charge the EVs. The option available to agents depends on the policy intervention in place. We base our policy interventions on the strategies to encourage pro-environmental behaviour as classified by Steg (Steg 2016). In the model, we implement three policy interventions aimed at encouraging agents to charge their EVs in a sustainable way. These are (1) dual tariff scheme, (2) automated smart charging, and (3) information and feedback. The results of our ABM will show whether and how different interventions will lead to different outcomes, EV charging demand and user satisfaction at the system level, i.e. self-sufficiency, self-consumption and user satisfaction. Table 1 shows which modes are available for the different policy interventions. In what follows, we discuss each policy intervention and how this is operationalized in our ABM.
In the absence of a specific intervention, agents charge in mode 1, in which the agents always charge at maximum capacity, see Figure 5. This serves as a baseline scenario.

The intervention dual tariff scheme is based on the strategy changing costs and benefits of behaviour (Steg 2016). This intervention is similar to previous simulation studies cited in the literature review, in which the agent is assumed to be a rational actor optimizing costs and benefits. In order to stimulate sustainable charging, policies can be implemented that change the costs and benefits of charging at specific times. In our model, we implement a dual tariff charging scheme; the price of charging is high when there is a shortage of renewable energy to cover the electricity demand of the buildings, while it is low when there is a surplus of renewable energy. With this policy in place, we assume that agents will always charge their EV to a minimum level (mode 2). However, the agents will only charge their EV beyond this minimum when the price is low. EVs set this minimum level to the energy they need to drive from their home to the patch with a commercial or office function that is furthest away from their home, so that they can always make a trip. Even when people charge until their battery is full, this charging session will not strengthen environmental self-identity, as people will ascribe their charging decision to the fluctuating price rather than to themselves. Hence, subsequent sustainable charging will not be promoted. Therefore, agents always charge in mode 2, unless a different policy intervention will be adopted, see Figure 6.

The intervention automated smart charging is based on the strategy reducing cognitive effort (Steg 2016). Pro-environmental behaviours are often considered to be costly in terms of effort (Steg et al. 2014). Strategies to encourage sustainable charging can reduce the cognitive effort required for sustainable charging. In automated smart charging systems, EV drivers do not actively monitor sustainable energy production and decide when to charge their EV. EVs will automatically charge at times of renewable energy abundance, and not charge when there is no renewable energy available. In our model, we assume that all EV drivers will take part in an automated smart charging system. Our model simulates two variations of this system, one in which there is central control over the charging points and one in which there is no central control. When there is a central control system, the system can monitor exactly how much renewable energy is available, and let the EVs charge with limited power so that the total charging power used for the EVs does not exceed the amount of excess renewable energy. If there is no central control, the agents charge at maximum power when there is excess renewable energy, since they are not aware of how many other agents want to charge at that time step, and therefore cannot calculate the limit to prevent using more energy than the excess renewable energy. Again, both variations of the system are not likely to strengthen environmental self-identity, as people’s EVs will be charged automatically. Hence, agents will not ascribe this sustainable charging behaviour to themselves and subsequent sustainable charging will not be promoted. As long as this intervention is in place, the agents will charge in mode 3, see Figure 7.

The intervention information and feedback is based on a combination of the strategies information and feedback on costs and benefits and taking advantage of people’s desire to be consistent (Steg 2016). The charging option agents choose is dependent on their environmental self-identity and range anxiety, see Figure 8[3]. We assume that people with a stronger environmental self-identity are more willing to shift their charging behaviour than people with a weaker environmental self-identity. We assume that people with stronger range anxiety are less willing to shift their charging behaviour than people with weaker range anxiety.

Equations (4) and (5) show how agents choose a charge mode:
| $$\text{charging mode} = \begin{cases} \text{mode 1} & \textbf{if} & \omega_{ESI} ESI - \omega_{RA} RA \leq - \frac{1}{6} \\ \text{mode 2} & \textbf{if} &- \frac{1}{6} < \omega_{ESI} ESI - \omega_{RA} RA \leq \frac{1}{6} \\ \text{mode 3} & \textbf{if} & \omega_{ESI} ESI - \omega_{RA} RA > \frac{1}{6} \end{cases}$$ | (4) |
| $$\omega_{ESI} + \omega_{RA} = 1$$ | (5) |
With ESI the score for environmental self-identity, RA the score for range-anxiety, αESI the weighing factor for environmental self-identity and αRA the weighing factor for range anxiety, which together should add to 1. We want to set up the boundary values in such a way that agents that do not experience range anxiety but also do not act sustainably charge in mode 1, while agents with a high environmental self-identity charge in mode 3. To determine the boundary value between the charging mode we choose as a reference case ωESI = ωRA = 1/2. ESI varies between -1 and 1. We chose -1/6 and 1/6 as boundary values, because it divides the domain -1/2 to 1/2 in three equal parts.
Environmental self-identity can be strengthened by making agents aware of their past pro-environmental behaviour (Van der Werff, Steg, & Keizer 2014a, 2014b). More specifically, research has shown that individuals who became aware that they engaged in pro-environmental behaviour scored higher on environmental self-identity than agents who became aware that they often refrained from engaging in pro-environmental behaviour (Van der Werff, Steg, & Keizer 2014b) . Therefore, the agents receive individual feedback during their charging sessions. The feedback displays the amount of sustainably produced energy used for charging the EV battery compared to the total amount of energy used for the charging session. This proportion indicates the extent to which agents acted sustainably. The larger amount of the energy used for charging is sustainably produced, the more agents become aware that they acted sustainably and the more environmental self-identity will be strengthened. When only a small amount of the energy used for charging is sustainably produced, agents will become aware that they did not act sustainably and environmental self-identity will be weakened.
Updating environmental self-identity and range anxiety
In the beginning of the simulation, the agents are assigned a random value from a uniform distribution for both environmental self-identity and range anxiety [4]. Environmental self-identity is updated during charging (with policy intervention information and feedback) and range anxiety gets updated during moving. Equations (6) and (7) present the calculations:
| $$ESI(t) = \begin{cases} ESI(t - 1) + Inc_{ESI} & \textbf{if} & \text{charging?} & \textbf{and} &\text{energy balance} > 0 \\ ESI(t - 1) - Dec_{ESI} & \textbf{if}& \text{charging?} & \textbf{and} & \text{energy balance} < 0 \\ ESI(t - 1) & \textbf{else} \end{cases}$$ | (6) |
With IncESI the increment by which environmental self-identity can get increased, DecESI the decrement by which environmental self-identity can get decreased, and Pcharge the power used for charging. The minimum value of ESI is -1 and the maximum value is +1. Studies on environmental self-identity have typically focussed on strengthening environmental self-identity, and not on weakening. We can therefore not estimate the values of IncESI and DecESI based on empirical data. Based on findings by (Van der Werff, Steg, & Keizer 2013b ), we suspect that it is easier for environmental self-identity to strengthen than it is to weaken, which is reflected in our parameter estimation by setting the value of IncESI higher than the value of DecESI.
| $$RA(t) = \begin{cases} RA(t - 1) + Inc_{RA} & \textbf{if} & \text{moving?} &\textbf{and} & SOC = 0 \\ RA(t - 1) - Dec_{RA} & \textbf{if} & \text{moving?} & \textbf{and} & SOC > 0 \\ RA(t - 1) & \textbf{else} \end{cases} $$ | (7) |
With IncRA the c can get increased, DecRA the factor with which range anxiety can get decreased. The minimum value of RA is 0 and the maximum value is +1. Again, we cannot estimate the values of IncRA and DecRA based on empirical data. We expect not being able to drive has a large impact on range anxiety, and hence give IncRA a higher value than DecRA in our simulations. EVs can continue to drive if the battery is empty in our simulations, which is not possible in reality for FEVs. FEVs would not be able to drive with an empty battery and another solution for transportation would have to be found. We leave this out of our model, since incorporating this would add more complexity, while it does not serve our research objective, which is related to charging behaviour.
Indicators
We use five indicators to evaluate the simulation results: (1) self-sufficiency, (2) self-consumption, (3) peaks in net energy demand, (4) peaks in energy oversupply, and (5) kms driven using the battery as energy source. The first four indicators are related to the balance between demand and supply, while the fifth indicator is related to user satisfaction.
Self-sufficiency is the percentage of energy demand that can be met by locally produced renewable energy, while self-consumption is the percentage of locally produced renewable energy that is used within the area (Litjens et al. 2017). Sources of demand are the households, the service sector and the EVs. At times when production of renewable energy exceeds demand, the energy is sent elsewhere, since there is no storage or curtailment in our model. We implicitly assume that our model area has a grid connection to the surrounding world. Furthermore, we present the highest peaks of both demand exceeding supply (peak net demand) and supply exceeding demand (peak oversupply). From the perspective of an electricity grid manager, high levels of self-sufficiency and self-consumption and low peaks are beneficial, since it reduces the grid capacity is needed to manage energy flows.
To indicate user satisfaction, we calculate the percentage of kms driven using the battery as energy source (in our model agents still drive when their battery is empty). In reality, FEVs would not have been able to drive these kms. The reason that EVs are not charged sufficiently can be either because there was not enough renewable energy to charge the EV (when agents charge in mode 3), or an insufficient number of charging stations to cover all needed charging sessions.
Selected Simulation Experiments
In this paper, we focus on the effects of the different policy interventions on the balance of energy demand and supply and user satisfaction. First, we define two “main” scenarios; one in which 50% of energy demand can be met with renewable energy and one in which 100% of energy demand can be met with renewable energy. These results give insight on the impact of the type of policy intervention on our indicators. When available we used empirical data to ensure realistic outcomes of the simulation experiments. This was not possible for the parameters related to environmental self-identity and range anxiety. To address lack of empirical input, we both present time series, illustrating how ESI and RA have an impact on charging behaviour, and a sensitivity analysis showing the effect of the uncertainty in these parameters.
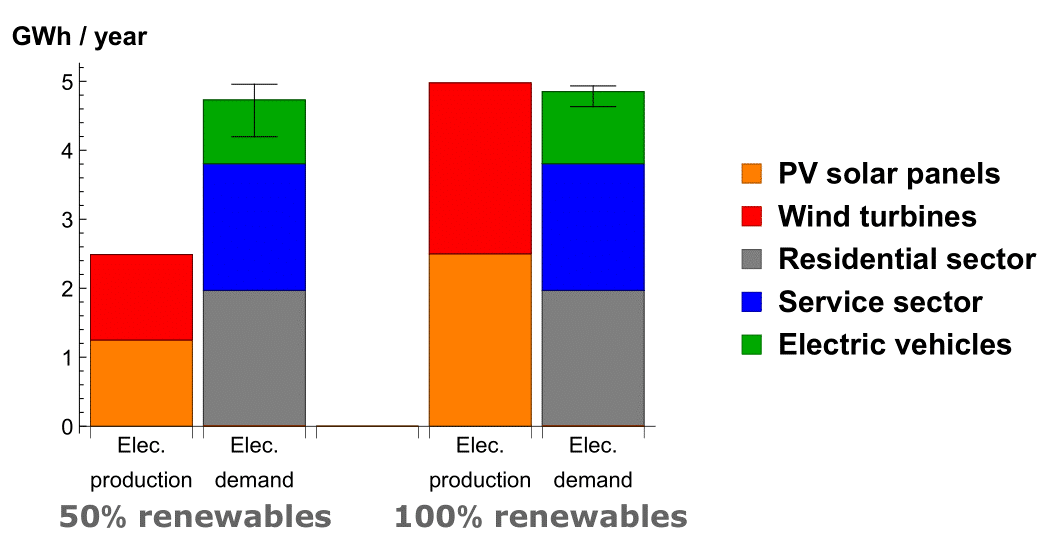
We ran several series of simulations to compare the effect of different policy interventions under different scenarios. Table 6 presents the settings for input parameters we have used. We have used different PV and wind capacities, based on a calculation of the energy demand from the households, service sector and electric vehicles. We determined the load of the EVs by running simulations with no policy intervention. In our first scenario, the total renewable energy production should cover about 50% of total energy demand, while in our second scenario this is about 100% (we use the term ‘about’ because the energy demand of EVs is not exactly the same in all simulations, due to variations in trips and availability of charging infrastructure across different simulations, see Figure 9). In these scenarios, PV and wind account for 50% of annual renewable energy production each. Finally, we have varied the charging infrastructure. We have run simulations with unlimited and limited charging stations, and have varied the availability of social charging (only relevant with a limited number of charging stations), and central control (only relevant for automated smart charging).
| Simulation experiment | Main | Solar versus wind | Sensitivity analysis |
| # of simulations | 150 | 330 | 7200 |
| Vehicle fleet | 500 FEVs | 500 FEVs | 500 FEVs |
| PV capacity (MWp) | {1.4, 2.9} | [0, 2.9] | {1.4, 2.9} |
| Wind capacity (MW) | {0.7, 1.4} | [0, 1.4] | {0.7, 1.4} |
| Policy intervention | {No intervention, dual tariff scheme, automated smart charging, information and feedback} | {No intervention, dual tariff scheme, automated smart charging, information and feedback} | Information and feedback |
| Unlimited-charging? | {True, False} | {True, False} | {True, False} |
| Social-charging? | {False, True} | {False, True} | {False, True} |
| Central control? | {False, True} | {False, True} | False |
| ωESI | 0.5 | 0.5 | [0, 1] |
| IncESI | 0.02 | 0.02 | [0, 0.05] |
| DecESI | 0.01 | 0.01 | [0, 0.05] |
| IncRA | 0.1 | 0.1 | [0, 0.5] |
| DecRA | 0.0001 | 0.0001 | [0, 0.0005] |
EV fleet composition, driving needs, available charging infrastructure, and the profiles for energy demand and renewable energy production are all based on real-life datasets. In absence of studies comparing the strength of the effects of environmental self-identity and range anxiety on charging behaviour, we have used the value 0.5 for ωESI, meaning that environmental self-identity and range anxiety have an equally important influence on which charging modes the agents choose, as (Equation 7). In order to estimate IncESI, DecESI, IncRA, DecRA, we have experimented extensively with the model, since it is not possible to derive estimations from empirical evidence. We tried to set these values in such a way that (a) average ESI has a tendency to increase in scenarios with high renewable energy supply, (b) the time-scale average ESI changes noticeably is neither too short (e.g. hours) or too long (e.g. months), (c) RA increases strongly when an agent has an empty battery as compared to the decrease when an agent can make the desired trip, and (d) the time-scale average RA changes noticeably is neither too short (e.g. hours) or too long (e.g. months). Even though this may be not be a strong method of parameterisation, the results can still give us valuable insights in what we could expect from such a policy intervention. To indicate how important these uncertainties are, we have varied these parameters in a sensitivity analysis with a wide uncertainty band, see Table 6.
For each of the possible settings in our two main scenarios, we have run 5 simulations covering one year of time in the model. The number of settings for each scenario is 4 [ policy interventions ] * 2 [ types of charging infrastructure ] * 2 [ social charging or not ] * 2 [ central control or not ] = 32. However, social charging is only possible if charging infrastructure is limited, and central control is only possible when the policy automated smart charging is implemented. Our total number of simulations is thus 2 [ scenarios ] * 15 [ settings ] * 5 [ simulations per setting ] = 150 simulations. In order to determine the variation of the results of these 5 simulations for the same set of parameters, we have calculated the ratio of the standard deviation and the average for each set of simulations. For the indicators self-sufficiency, self-consumption, and user satisfaction this ratio is in the order of magnitude of ~10-4, indicating very little variation. The variation is higher for the peaks in net energy the variation in some cases, with the ratio of the standard deviation and average varying between 0 and 0.07. This is still not a very large variation, indicating that 5 is a sufficient number of simulations; more simulations will not lead to significantly different results.
The sensitivity analysis covers the highly uncertain parameters related to environmental self-identity and range anxiety with 7200 additional simulations (1200 runs per setting of renewable energy capacity, charging infrastructure and social charging with wide uncertainty bounds, see Table 6). We used the Saltelli sampling technique (Saltelli 2002) in the SALib.analyze [5] package for Python. Additionally, we wanted to get insight in the effect of having either more PV solar energy or more wind energy in the energy mix. We performed additional simulation experiments varying the ratio of PV solar energy to wind energy from 0 to 1 with steps of 0.1 while keeping the total production of renewable energy constant. This has resulted in 2 [ scenarios ] * 15 [ settings ] * 11 [ simulations varying the ratio of PV solar energy to wind energy ] = 330 simulations.
Main results and solar versus wind
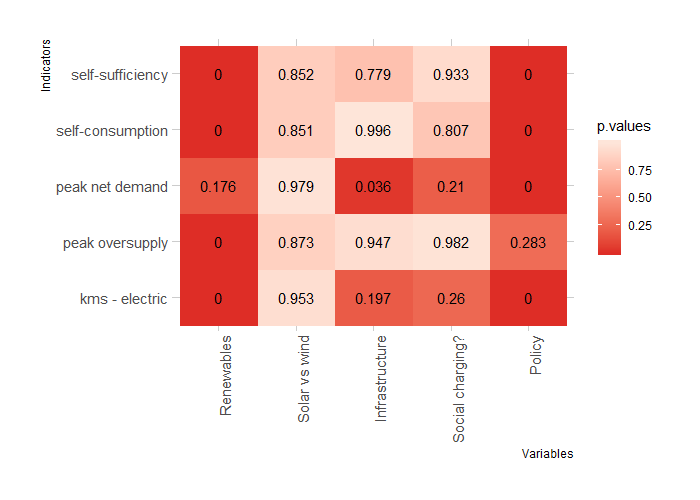
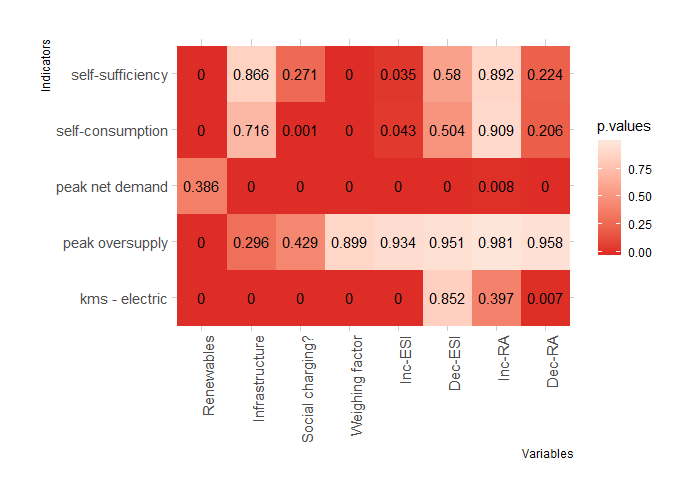
This section presents the results of our main scenarios and the solar-vs-wind simulations. In order to see which variables have the highest impact on the results we did an Analysis of Variance (ANOVA) test on the simulation outcomes. Figure 10 presents the p-values resulting from the ANOVA test. The results show that the renewable energy capacity and policy have the highest impact, while the ratio of PV solar capacity to wind capacity does not have a significant impact on the results. Hence, we exclude the ratio of PV solar capacity to wind capacity from our analysis in the rest of our paper.
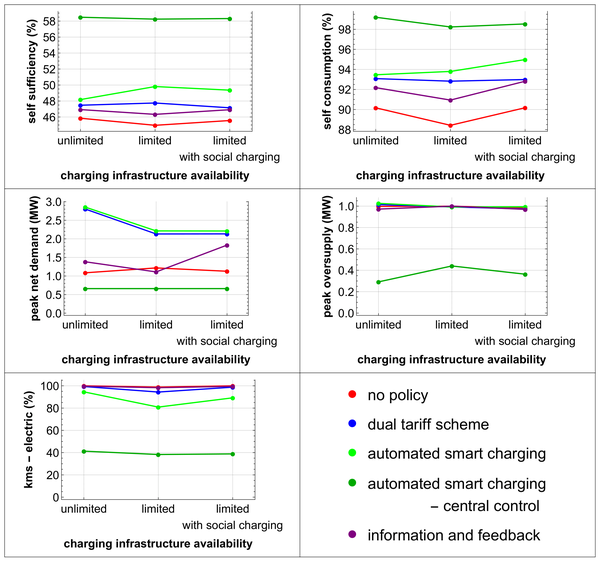
Scenario with 50% renewables
Figure 11 presents the results for our scenario with 50% renewables. The results of the simulations with unlimited charging show that all policy interventions increase the levels of self-sufficiency and self-consumption as compared to no intervention. The level of increase is similar for the interventions, except under the policy intervention automated smart charging with central control, which shows a significantly larger increase. Self-sufficiency is even higher than 50%, which is possible because of the lower demand for EV charging due to constraints in times where it is allowed to charge. This lower demand can be seen in the score for kms – electric, which is significantly lower than the kms driven in the other policy interventions. This makes implementing this policy intervention unpractical, because there is not enough renewable energy production to let the agents drive only on renewable energy. Even without a central control system, a significant amount of kms could not have been driven using the battery. Hence, automated smart charging, regardless the level of control, is not the preferred policy in scenarios with 50% renewables.
Another noteworthy result in this 50% renewables scenario is the large increase in peak net demand. The increase is so large because all agents with SOC < 100% at charging stations will start charging when the energy balance is positive. Furthermore, the peak in overproduction is not lowered under the policy interventions, except for automated smart charging with central control.
We have run simulations with limited charging capacity both with and without social charging. In general, the effects of the different policy interventions are similar as with simulation series 1. An extra variable to pay attention to is the difference between having social charging or not. While for most indicators having social charging or not has a very limited effect on our indicators, the scores for self-consumption and kms – electric are in general significantly higher when social charging is implemented, illustrating the potential benefits of such a system. The only real negative impact of social charging is found in the peak in net energy demand for the policy intervention information and feedback, which is 65% higher with social charging. With social charging the charging infrastructure is used more efficiently, so more agents will charge at times of renewable surplus, resulting in the higher peak in net energy demand.
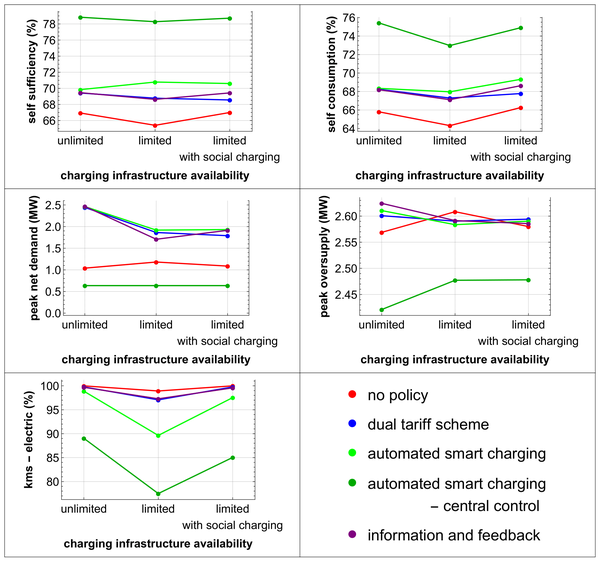
Scenario with 100% renewables
Figure 12 presents the results for our scenario with 100% renewables. In general, in the scenario with unlimited charging the effects of the different policy interventions are similar to effects observed in the scenario with 50% renewables. One difference we would like to discuss here is for automated smart charging with central control. While this policy intervention still has the lowest score by far for kms – electric, the score is much higher than in the scenario with 50% renewables. With so much renewables such a system might be acceptable for users if solutions are found for the remaining kms. However, the peak in supply is reduced only to a limited extent, indicating that peaks in renewable energy production are too high to be reduced using smart charging. This is also reflected in the scores for self-sufficiency and self-consumption. While all policy interventions increase these scores, self-sufficiency and self-consumption do not exceed 79% and 76% respectively.
We have run simulations with limited charging capacity both with and without social charging. In general, the effect of the different policy interventions are what one would expect given the results presented earlier, and the additional results found for the effects of limited charging stations, social charging, and high renewable capacity as discussed for the scenario with 50% renewables.
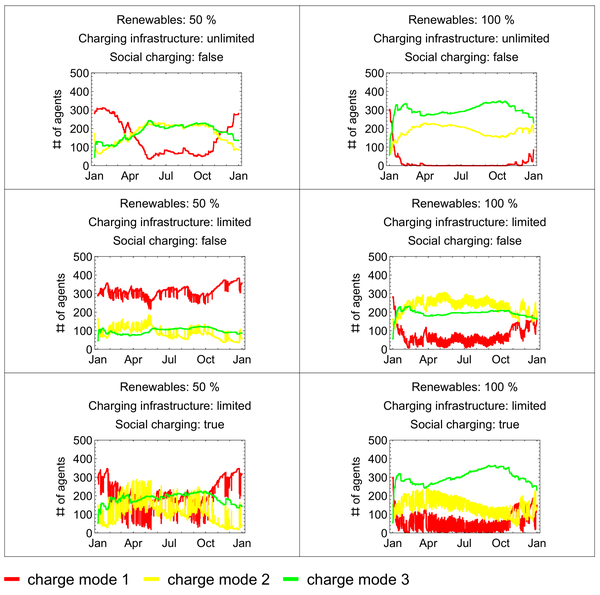
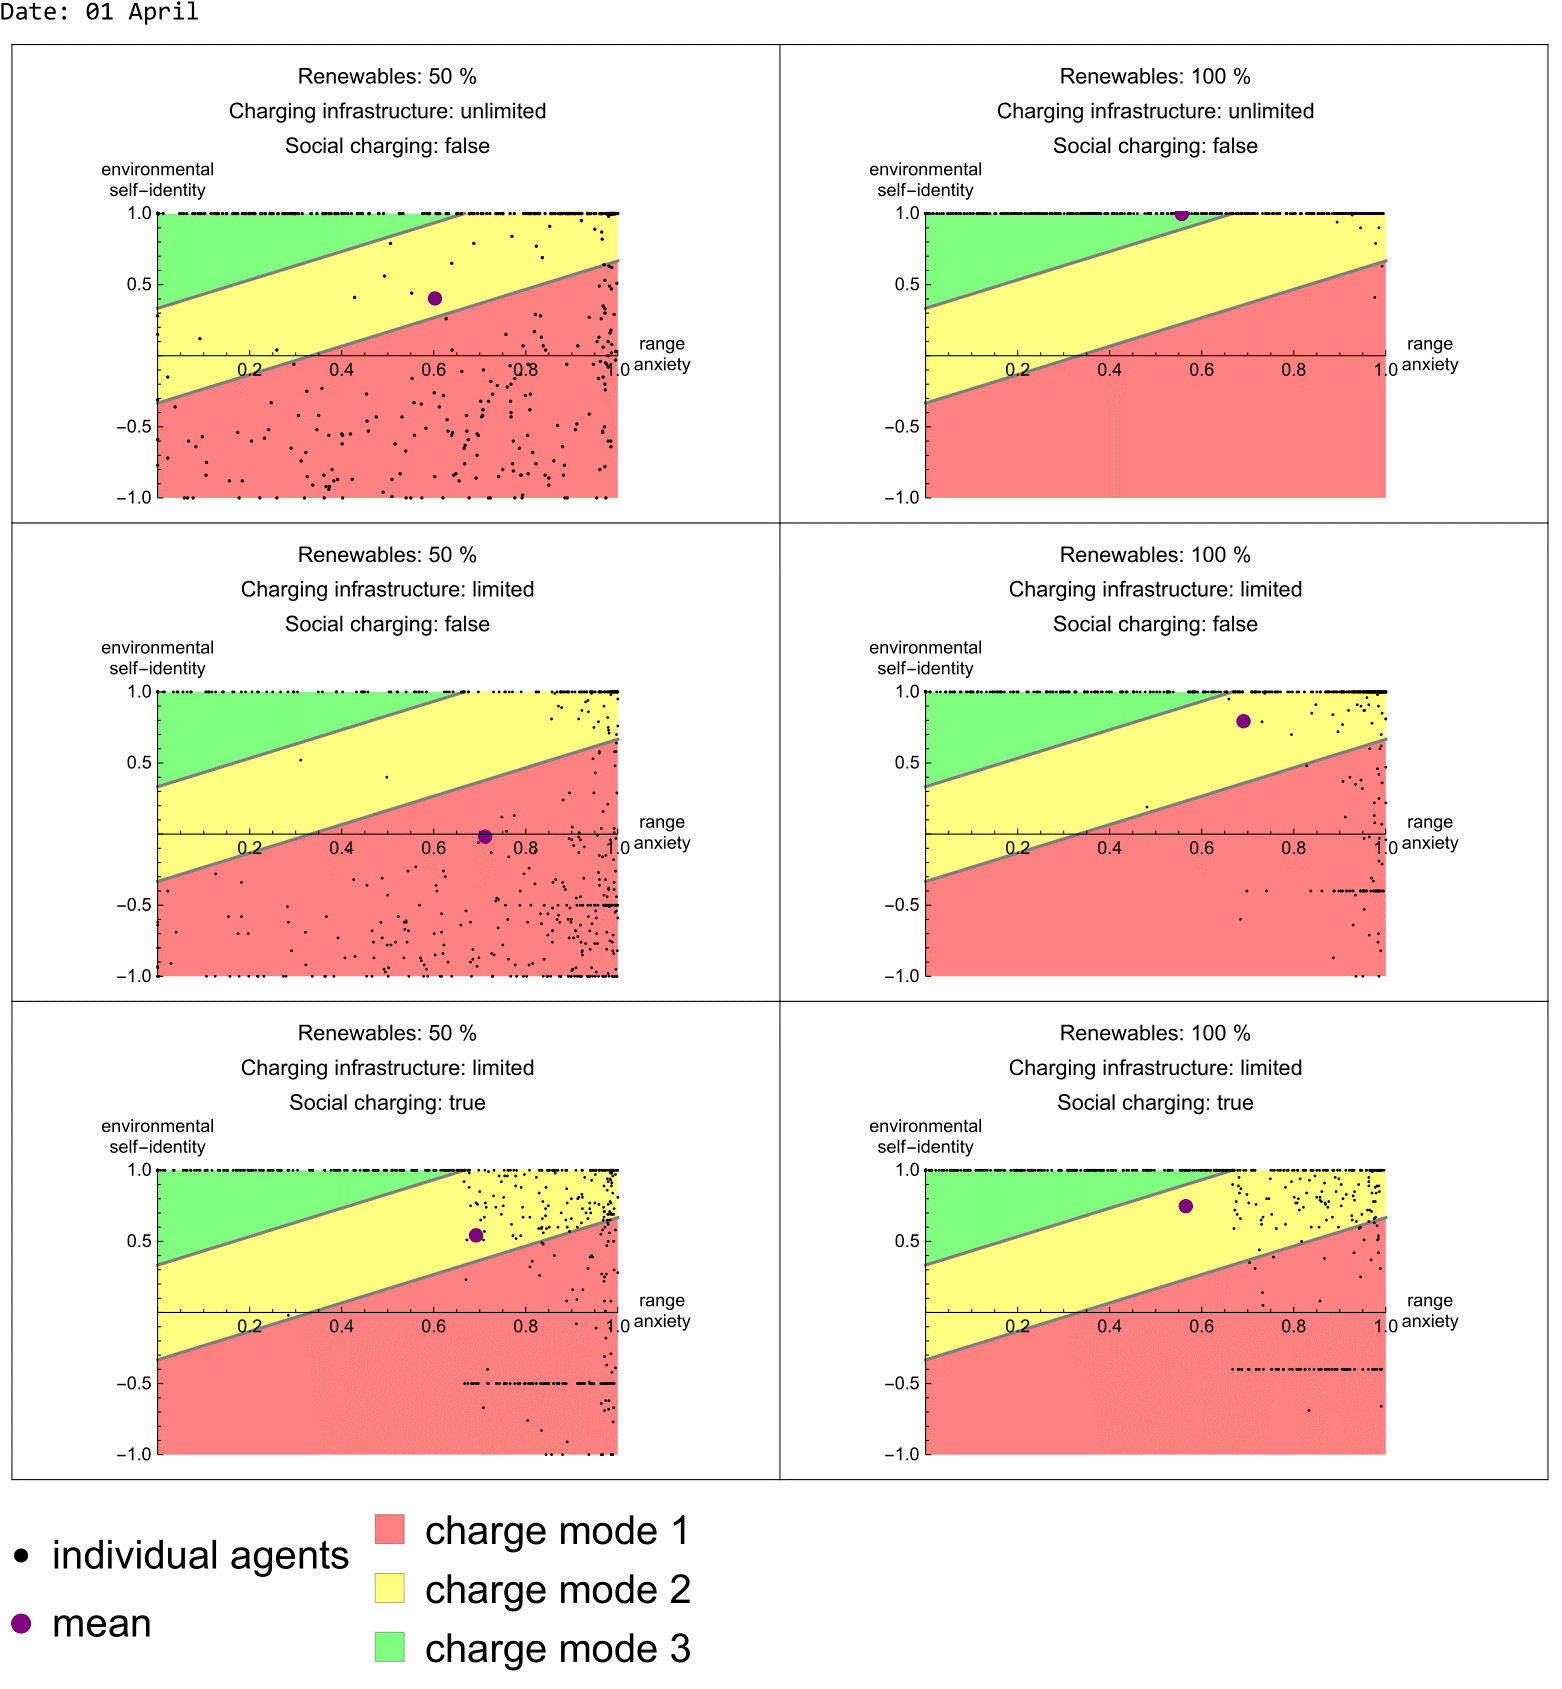
Environmental self-identity and range anxiety
Figure 13 presents the development of the number of agents in different charging modes for simulations with the policy intervention information and feedback and we include a movie containing an animation showing the development of the individual and mean scores for environmental self-identity and range anxiety for one simulated year (Figure 14 contains a snapshot for April 1st). Given the difficulty with the parameterization of the variables related to environmental self-identity and range anxiety, the value of these results is in comparing the different simulations to each other, instead of focusing on one example.
These figures illustrate the mechanisms underlying the results presented in Figures 11 and 12. Figure 13 shows that the seasonal variation is an important driver in changes in charging modes. A limited charging infrastructure will limit the number of agents charging sustainably. Implementing social charging allows more agents to charge sustainably because of a more efficient use of the limited infrastructure. In the simulations with limited charging infrastructure, the number of agents in charge mode 3 is more stable than the number of charge modes 1 and 2, indicating that in these cases many agents have scores for ESI and RA close to the boundary between these charge modes. The movie and Figure 14 show that there is indeed a cluster of agents in charge mode 3 in all simulation settings. The size of the cluster does depend on the simulation settings. In our 100% renewables scenario with unlimited charging infrastructure the agents all have very high scores for ESI, because most charging sessions will have a high percentage of renewable energy input. With high scores for ESI for all agents, RA is the factor that explains variation in charging behaviour.
Sensitivity analysis for the policy intervention information and feedback
Here, we present the results of our sensitivity analysis. In order to see which variables have the highest impact on the results we did an ANOVA test on the simulation outcomes. Figure 15 presents the p-values resulting from the ANOVA test. The results show that for the parameters specific to the policy intervention information and feedback variation in the weighing factor has the biggest impact on the results. This is not surprising, given that the impacts of increases and decreases in environmental self-identity and range anxiety vary with the weighing factor.
The results of our sensitivity analysis show that the uncertainty in the parameters related to ESI and RA are important for our results. Basically, they determine how much the agents move towards the extreme of always charging in charge mode 1 or always charging in charge mode 3. The success of an information and feedback campaign thus relies to a large extent on how important these factors are in real-life for charging behaviour. For the interested reader we have included all our simulation results in the supplementary material.
Discussion and Conclusion
We have presented an ABM aiming to explore the consequences different policies might have on people’s EV charging behaviour. More specifically, we have focussed on the integration of clean energy and transport via so-called smart charging. Our model expands previous models of EV charging by incorporating recent insights from environmental psychology on important psychological drivers of pro-environmental behaviour. This way, our models do not solely focus on driving needs and costs, but also incorporate normative considerations. In our models, we have used empirical data as much as possible to construct realistic scenarios.
The results show that the amount of renewables and policy interventions have the largest impact on our indicators (self-sufficiency, self-consumption, peaks in net demand and oversupply, and the number of kms driven using the battery as energy source), while the ratio of PV solar capacity to wind capacity does not have a significant impact. Hence, we ignored the ratio of PV solar capacity to wind capacity in our further analyses. While all forms of sustainable charging do increase the values of self-sufficiency and self-consumption, they do so only moderately. Higher scores for these indicators are associated with less kms being driven using the battery as energy source, which would lead to low satisfaction of EV drivers. Under all other policy interventions without central control, the peak in net energy demand will increase significantly, while the peak in overproduction is similar to the situation without intervention. While automated smart charging with central control requires lower grid capacity compared the other interventions, as is reflected in the low peaks in net demand and oversupply, the available energy for EV charging is currently too limited for such a system to work in practice. Hence, these results indicate the limited potential for sustainable charging to contribute to integrating intermittent renewables in the electricity grid. This is partly solved when the capacity of renewables is higher (as can been seen in our 100% renewable scenario), This is in line with other research showing that the vast majority of people allows automated smart charging to some extent, especially when a minimum charge or range is guaranteed (Bailey & Axsen 2015; Bauman et al. 2016; Ensslen et al. 2018a; Will & Schuller 2016). Yet, peaks in oversupply will become higher as well, denoting the necessity of additional (stationary) storage for load balancing.
In scenarios with limited charging infrastructure, the issue of empty batteries is significantly reduced when social charging is implemented, illustrating the potential benefits of such a system. The only real negative impact of social charging is found in the peak in net energy demand for the policy intervention information and feedback in the scenario with renewables covering 50% of total electricity demand, which is 65% higher with social charging. Hence, policy makers could promote the use of social charging via apps especially in areas in which the grid is able to deal with additional peak demand without having an increase in local congestion at transformer stations.
We summarize these points in Table 7. The table indicates the effects of the different policies on the energy system and user satisfaction and can help identify robust policies for smart charging. One evident conclusion is that while automated smart charging can have great benefits, the disadvantages are also very large. Both dual tariff scheme and information and feedback have more moderate positive and negative effects.
| Policy intervention | No intervention | Dual tariff scheme | Automated smart charging | Information and feedback | |||||
| Social charging? | True | False | True | False | True | False | True | False | True |
| Central control? | n.a. | n.a. | n.a. | False | False | True | True | n.a. | n.a. |
| Self-sufficiency (%) | +/- | + | + | ++ | ++ | +++ | +++ | + | + |
| Self-consumption (%) | +/- | + | + | ++ | ++ | +++ | +++ | + | + |
| Peak net demand (MW) | + | -- | -- | -- | -- | +++ | +++ | ++ | + |
| Peak oversupply (MW) | +/- | +/- | +/- | +/- | +/- | +++ | +++ | +/- | +/- |
| kms - electric (%) | + | - | +/- | -- | -- | --- | --- | +/- | - |
The difference in effects of the policy interventions with no central control is small, especially in the scenarios with 50% renewables. Our results thus indicate that an information and feedback campaign targeting EV drivers’ environmental self-identity can have similar positive effects as interventions using either variable pricing or automated smart charging. Introducing variable pricing in practice could have significant drawbacks. Firstly, such a system would require new regulations on energy pricing. Furthermore, stimulating load shifting behaviour with price incentives is generally difficult: often the financial benefits do not compensate the effort and inconvenience of changing behaviour (Kobus, Mugge & Schoormans 2013; Dogan, Bolderdijk & Steg 2014). The implementation of automated smart charging requires large changes in both technology and regulation. Furthermore, automated smart charging would take away control of users. Consumers are often reluctant to engage in such programs due to privacy and autonomy concerns (Sintov & Schultz 2015). Moreover, both policies do not target EV drivers’ intrinsic motivation, making long-term behavioural change not more likely (Bolderdijk et al. 2011). An information and feedback campaign targeting environmental self-identity does not face these drawbacks, as users are more likely to ascribe their sustainable charging session to themselves (intrinsically motivated charging). Given the similar outcomes on a system level, this policy intervention has preference over the others. Future research could study different types of feedback to strengthen environmental self-identity.
The time series we presented for the simulations of the policy intervention information and feedback indicate that the renewable energy capacity and the variation of renewable energy production are main drivers of how many agents charge sustainably. Furthermore, the results show that agents do not perform homogeneous charging behaviour because the scores for environmental self-identity and range anxiety vary across their domain for most of our scenarios, except for our 100% renewables scenario with unlimited charging infrastructure, in which the agents have very high scores for environmental self-identity but vary in their scores for range anxiety. This illustrates that such a policy, which relies on voluntary participation in sustainable charging, can create a heterogeneous group of EV drivers, which has implications for policies aiming to increase sustainable charging. Policy makers could focus on increasing environmental self-identity and/or decreasing range anxiety, and might have to use different incentives for different groups of EV drivers.
Although our model enriches the literature on simulations of EV charging by incorporating environmental psychology, it also has some drawbacks. One gap is that the research on environmental self-identity typically studies how environmental self-identity can be strengthened rather than weakened. From a practical perspective, it is clear why research has solely focused on the strengthening of environmental self-identity. From a modelers perspective however, studying how environmental self-identity could be weakened would add valuable information to construct the dynamics of the important drivers of agent behavior. Furthermore, we are not able to parameterize or estimate the variables related to range anxiety and environmental self-identity. We have added a section showing the development of these variables in our simulations and a sensitivity analysis to provide some insight as to how different scores on these variables affect the results. To solve parameterization issues, future research could conduct Discrete Choice Experiments (Bailey & Axsen 2015) or Conjoint Analyses (Leijten et al. 2014) that determine the relative importance of these constructs for sustainable charging.
In this paper, we have presented a limited number of simulations. We have focussed on renewable energy capacity, different policy interventions, limited versus unlimited charging capacity, social charging, and central control. The simulation model could be applied to many more cases; interesting directions could be variations in charging infrastructure, energy demand, battery size and depletion of the batteries, including stationary storage, and including PHEVs in the EV fleet. Furthermore, the model can be used for simulations of other cities, regions or countries, as long as sufficient data is available.
To summarize, we have demonstrated ABMs to be a suitable tool for exploring the future of EV charging, and make a first step towards more realistic scenarios going beyond purely technical and financial considerations. The model allows to highlight the different concerns in moving towards a renewable energy and transport system and provides an estimate of what factors are most important and which issues can arise. Where we could not follow such empirical rigour, we performed a sensitivity analysis to indicate the importance of uncertainty in these areas. Based on our results, we have articulated several policy recommendations. Furthermore, our research points to certain gaps in environmental psychology literature, and indicates directions worthwhile to pursue for environmental psychology scholars who want to use theory to inform future policy making using simulation modelling. In doing so, environmental psychology could play a more prominent role in modelling of energy systems, leading to richer simulation models and theories and thereby supporting the identification of robust policies to promote the transition to a new energy system.
Acknowledgements
The authors would like to thank Allard van Mossel and Aziiz Sutrisno for help in coding and Geert Litjens for modelling the hourly PV-power supply profile. Furthermore, we would like to thank Flaminio Squazzoni and two anonymous referees, whose comments helped us improve our manuscript. This work was supported by the Uncertainty Reduction in Smart Energy Systems (URSES) research program funded by the Dutch organization for scientific research (NWO) and Shell under the project Realizing the smart grid: aligning consumer behaviour with technological opportunities (SMARTER) with grant number 408-13-009.Model Documentation
The model is implemented in NetLogo (Wilensky 1999), and the code is available online here: https://www.comses.net/codebases/365d1aa6-3ec2-4cbd-b991-5e88587f5984/releases/1.1.1/ (Van der Kam et al. 2019). The online version of our model contains a model description following the ODD (Overview, Design, Details) protocol (Grimm et al. 2010).Notes
- For an overview of projects, see https://www.livinglabsmartcharging.nl/en/ (archived at: http://www.webcitation.org/72rtGVdUs).
- For an example of social charging in practice see: https://www.social-charging.com archived at: http://www.webcitation.org/72rtDRgU1).
- Agents only update their environmental self-identity depends when they ascribe their sustainable charging session to themselves (intrinsically motivated charging), and not to the policy in place (extrinsically motivated charging). In the absence of a policy intervention, agents are not aware on whether they charged sustainably. With the interventions dual tariff scheme and automated smart charging agents are extrinsically motivated to charge sustainably. Hence, environmental self-identity is only relevant for the intervention information and feedback.
- We choose a uniform distribution for the sake of simplicity, to the best of our knowledge there is no data on the distribution, mean and standard deviation of environmental self-identity and range anxiety and how these factors relate to sustainable charging among the general population or EV drivers. We did check whether our results are sensitive to the distribution used in the initialisation and found no significant impact.
- https://salib.readthedocs.io/en/latest/api/SALib.analyze.html (archived at: http://www.webcitation.org/784Un66mG).
References
ABRAHAMSE, W., & Shwom, R. (2018). Domestic energy consumption and climate change mitigation. Wiley Interdisciplinary Reviews: Climate Change, 9(4), 525-540. [doi:10.1002/wcc.525]
ACEA. (2018). New passenger car registrations by alternative fuel type in the European Union. Retrieved from: https://www.acea.be/statistics/tag/category/electric-and-alternative-vehicle-registrations.
ANDREWS, R. W., Stein, J. S., Hansen, C., & Riley, D. (2014). Introduction to the open source PV LIB for python Photovoltaic system modelling package. In 2014 IEEE 40th Photovoltaic Specialist Conference, PVSC 2014 (pp. 170-174). [doi:10.1109/pvsc.2014.6925501]
BAILEY, J., & Axsen, J. (2015). Anticipating PEV buyers’ acceptance of utility controlled charging. Transportation Research Part A: Policy and Practice, 82, 29-46. [doi:10.1016/j.tra.2015.09.004]
BAUMAN, J., Stevens, M. B., Hacikyan, S., Tremblay, L., Mallia, E., & Mendes, C. J. (2016). Residential smart-charging pilot program in Toronto: Results of a utility controlled charging pilot. World Electric Vehicle Journal, 8(2), 531-542. [doi:10.3390/wevj8020531]
BOLDERDIJK, J. W., Knockaert, J., Steg, E. M., & Verhoef, E. T. (2011). Effects of Pay-As-You-Drive vehicle insurance on young drivers’ speed choice: Results of a Dutch field experiment. Accident Analysis and Prevention, 43(3), 1181-1186. [doi:10.1016/j.aap.2010.12.032]
CBS. (2016). Onderzoek Verplaatsingen in Nederland (OViN). Retrieved from https://www.cbs.nl/nl-nl/onze-diensten/methoden/onderzoeksomschrijvingen/korte-onderzoeksbeschrijvingen/onderzoek-verplaatsingen-in-nederland--ovin-- Archived at http://www.webcitation.org/72rsj93D6.
CBS. (2018). Statline. Retrieved from http://statline.cbs.nl/Statweb/ Archived at http://www.webcitation.org/72rsl6X0c.
CLAESSEN, F. N., Claessens, B., Hommelberg, M. P. F., Molderink, A., Bakker, V., Toersche, H. A., & van den Broek, M. A. (2014). Comparative analysis of tertiary control systems for smart grids using the Flex Street model. Renewable Energy, 69, 260-270. [doi:10.1016/j.renene.2014.03.037]
DERU, M., Field, K., Studer, D., Benne, K., Griffith, B., Torcellini, R., … Crawly, D. (2011). U.S. Department of Energy commercial reference building models of the national building stock. [doi:10.2172/1009264]
DIJK, M., Kemp, R., & Valkering, P. (2013). Incorporating social context and co-evolution in an innovation diffusion model — with an application to cleaner vehicles. Journal of Evolutionary Economics, 295-329. [doi:10.1007/s00191-011-0241-5]
DOGAN, E., Bolderdijk, J. W., & Steg, L. (2014). Making small numbers count: Environmental and financial feedback in promoting eco-driving behaviours. Journal of Consumer Policy, 37(3), 413-422. [doi:10.1007/s10603-014-9259-z]
E-LAAD. (2013). Opladen elektrische autos zorgt voor piekbelastingen. Retrieved from https://www.elaad.nl/opladen-elektrische-autos-zorgt-voor-piekbelastingen/ Archived at http://www.webcitation.org/72rscPu4E.
EISING, J. W., van Onna, T., & Alkemade, F. (2014). Towards smart grids: Identifying the risks that arise from the integration of energy and transport supply chains. Applied Energy, 123(2014), 448–455. [doi:10.1016/j.apenergy.2013.12.017]
ELIA. (2018). Wind-power generation data. Retrieved from http://www.elia.be/en/grid-data/power-generation/wind-power Archived at http://www.webcitation.org/72ruo7J9J.
ENSSLEN, A., Ringler, P., Dörr, L., Jochem, P., Zimmermann, F., & Fichtner, W. (2018a). Examining an innovative electric vehicle charging tariff to incentivize customers’ provision of load flexibilities. Energy Research and Social Science, 42(March), 112-126. [doi:10.1016/j.erss.2018.02.013]
ENSSLEN, A., Ringler, P., Dörr, L., Jochem, P., Zimmermann, F., & Fichtner, W. (2018b). Incentivizing smart charging: Modeling charging tariffs for electric vehicles in German and French electricity markets. Energy Research and Social Science, 42(March), 112-126. [doi:10.1016/j.erss.2018.02.013]
EPPSTEIN, M. J., Grover, D. K., Marshall, J. S., & Rizzo, D. M. (2011). An agent-based model to study market penetration of plug-in hybrid electric vehicles. Energy Policy, 39(6), 3789–3802. [doi:10.1016/j.enpol.2011.04.007]
FRANKE, T., & Krems, J. F. (2013). What drives range preferences in electric vehicle users? Transport Policy, 30, 56-62. [doi:10.1016/j.tranpol.2013.07.005]
GOTTS, N. M., & Polhill, J. G. (2017). Experiments with a Model of Domestic Energy Demand. Journal of Artificial Societies and Social Simulation, 20(3), 11: https://www.jasss.org/20/3/11.html. [doi:10.18564/jasss.3467]
GRIMM, V., Berger, U., DeAngelis, D. L., Polhill, J. G., Giske, J., & Railsback, S. F. (2010). The ODD protocol: A review and first update. Ecological Modelling, 221(23), 2760-2768. [doi:10.1016/j.ecolmodel.2010.08.019]
HOLTZ, G., Alkemade, F., De Haan, F., Köhler, J., Trutnevyte, E., Luthe, T., … Ruutu, S. (2015). Prospects of modelling societal transitions: Position paper of an emerging community. Environmental Innovation and Societal Transitions, 17, 41-58. [doi:10.1016/j.eist.2015.05.006]
JENSEN, T., Holtz, G., & Chappin, É. J. L. (2015). Agent-based assessment framework for behavior-changing feedback devices: Spreading of devices and heating behavior. Technological Forecasting and Social Change, 98, 105–119. [doi:10.1016/j.techfore.2015.06.006]
KANGUR, A., Jager, W., Verbrugge, R., & Bockarjova, M. (2017). An agent-based model for diffusion of electric vehicles. Journal of Environmental Psychology, 52, 166-182. [doi:10.1016/j.jenvp.2017.01.002]
KNMI. (2018). Daggegevens van het weer in Nederland. Retrieved from http://projects.knmi.nl/klimatologie/daggegevens/selectie.cgi Archived at http://www.webcitation.org/72rurcniy.
KOBUS, C. B. A., Mugge, R., & Schoormans, J. P. L. (2013). Washing when the sun is shining! How users interact with a household energy management system. Ergonomics, 56(3), 451-462. [doi:10.1080/00140139.2012.721522]
KÖHLER, J., de Haan, F., Holtz, G., Kubeczko, K., Moallemi, E., Papachristos, G., & Chappin, E. (2018). Modelling Sustainability Transitions: An Assessment of Approaches and Challenges. Journal of Artificial Societies and Social Simulation, 21(1), 8: https://www.jasss.org/21/1/8.html. [doi:10.18564/jasss.3629]
KREBS, F. (2017). An empirically grounded model of green electricity adoption in Germany: Calibration, validation and insights into patterns of diffusion. Journal of Artificial Societies and Social Simulation, 20(2), 10: https://www.jasss.org/20/2/10.html. [doi:10.18564/jasss.3429]
KWAKKEL, J. H., & Pruyt, E. (2013). Exploratory Modeling and Analysis, an approach for model-based foresight under deep uncertainty. Technological Forecasting and Social Change, 80(3), 419-431. [doi:10.1016/j.techfore.2012.10.005]
LEIJTEN, F. R. M., Bolderdijk, J. W., Keizer, K., Gorsira, M., van der Werff, E., & Steg, L. (2014). Factors that influence consumers’ acceptance of future energy systems: the effects of adjustment type, production level, and price. Energy Efficiency, 7(6), 973-985. [doi:10.1007/s12053-014-9271-9]
LI, F. G. N., Trutnevyte, E., & Strachan, N. (2015). A review of socio-technical energy transition (STET) models. Technological Forecasting and Social Change, 100, 290–305. [doi:10.1016/j.techfore.2015.07.017]
LINDENBERG, S., & Steg, L. (2007). Normative, gain and hedonic goal frames guiding environmental behavior. Journal of Social Issues, 63(1), 117-137. [doi:10.1111/j.1540-4560.2007.00499.x]
LITJENS, G., Van Sark, W., & Worrell, E. (2017). Influence of demand patterns on the optimal orientation of photovoltaic systems. Solar Energy, 155, 1002-1014. [doi:10.1016/j.solener.2017.07.006]
MALLIG, N., Heilig, M., Weiss, C., Chlond, B., & Vortisch, P. (2016). Modelling the weekly electricity demand caused by electric cars. Future Generation Computer Systems, 64, 140–150. [doi:10.1016/j.future.2016.01.014]
MATSIM-T. (2008). Multi Agent Transportation Simulation Toolkit. Retrieved from http://www.matsim.org/". Archived at http://www.webcitation.org/72rsWJZHx.
MCCOY, D., & Lyons, S. (2014). The diffusion of electric vehicles: An agent -based microsimulation. Munich Personal RePEc Archive, 54633(24.03.2014).
MUELLER, M. G., & de Haan, P. (2009). How much do incentives affect car purchase? Agent-based microsimulation of consumer choice of new cars-Part I: Model structure, simulation of bounded rationality, and model validation. Energy Policy, 37(3), 1072-1082. [doi:10.1016/j.enpol.2008.11.002]
NOORI, M., & Tatari, O. (2016). Development of an agent-based model for regional market penetration projections of electric vehicles in the United States. Energy, 96, 215-230. [doi:10.1016/j.energy.2015.12.018]
OLIVELLA-ROSELL, P., Villafafila-Robles, R., & Sumper, A. (2015). Probabilistic Agent-Based Model of Electric Vehicle Charging Demand to Analyse the Impact on Distribution Networks. Energies, 8(5), 4160-4187. [doi:10.3390/en8054160]
OPIYO, N. (2015). Modelling Impacts of Socio-Economic Factors on Temporal Diffusion of PV-Based Communal Grids. Smart Grid and Renewable Energy, (December), 317–332. [doi:10.4236/sgre.2015.612026]
PALMER, J., Sorda, G., & Madlener, R. (2015). Modeling the diffusion of residential photovoltaic systems in Italy: An agent-based simulation. Technological Forecasting and Social Change, 99, 106–131. [doi:10.1016/j.techfore.2015.06.011]
PETERS, A. M., van der Werff, E., & Steg, L. (2018). Beyond purchasing: Electric vehicle adoption motivation and consistent sustainable energy behaviour in The Netherlands. Energy Research and Social Science, 39(October 2017), 234–247. [doi:10.1016/j.erss.2017.10.008]
RAI, V., & Henry, A. D. (2016). Agent-based modelling of consumer energy choices. Nature Climate Change, 6(6), 556–562. [doi:10.1038/nclimate2967]
ROBINSON, S. A., & Rai, V. (2015). Determinants of spatio-temporal patterns of energy technology adoption: An agent-based modeling approach. Applied Energy, 151, 273–284. [doi:10.1016/j.apenergy.2015.04.071]
RVO. (2017). Cijfers elektrisch vervoer. Retrieved October 13, 2017, from http://www.rvo.nl/onderwerpen/duurzaam-ondernemen/energie-en-milieu-innovaties/elektrisch-rijden/stand-van-zaken/cijfers.
SALTELLI, A. (2002). Making best use of model evaluations to compute sensitivity indices. Computer Physics Communications, 145(2), 280-297. [doi:10.1016/s0010-4655(02)00280-1]
SCHMALFUSS, F., Mair, C., Döbelt, S., Kämpfe, B., Wüstemann, R., Krems, J. F., & Keinath, A. (2015). User responses to a smart charging system in Germany: Battery electric vehicle driver motivation, attitudes and acceptance. Energy Research and Social Science, 9, 60-71. [doi:10.1016/j.erss.2015.08.019]
SHAFIEI, E., Thorkelsson, H., Ásgeirsson, E. I., Davidsdottir, B., Raberto, M., & Stefansson, H. (2012). An agent-based modeling approach to predict the evolution of market share of electric vehicles: A case study from Iceland. Technological Forecasting and Social Change, 79(9), 1638-1653. [doi:10.1016/j.techfore.2012.05.011]
SINTOV, N. D., & Schultz, P. W. (2015). Unlocking the potential of smart grid technologies with behavioral science. Frontiers in Psychology, 6(MAR), 1.8. [doi:10.3389/fpsyg.2015.00410]
SOVACOOL, B. K., Ryan, S. E., Stern, P. C., Janda, K., Rochlin, G., Spreng, D., … Lutzenhiser, L. (2015). Integrating social science in energy research. Energy Research and Social Science, 6, 95-99. [doi:10.1016/j.erss.2014.12.005]
STEG, L. (2016). Values, Norms, and Intrinsic Motivation to Act Proenvironmentally. Annual Review of Environment and Resources, 41(1), 277–292. [doi:10.1146/annurev-environ-110615-085947]
STEG, L., Bolderdijk, J. W., Keizer, K., & Perlaviciute, G. (2014). An Integrated Framework for Encouraging Pro-environmental Behaviour: The role of values, situational factors and goals. Journal of Environmental Psychology, 38, 104–115. [doi:10.1016/j.jenvp.2014.01.002]
STEG, L., Perlaviciute, G., & van der Werff, E. (2015). Understanding the human dimensions of a sustainable energy transition. Frontiers in Psychology, 6(June), 1–17. [doi:10.3389/fpsyg.2015.00805]
VAN DER KAM, M. J., Meelen, A. A. H., van Sark, W. G. J. H. M., & Alkemade, F. (2018). Diffusion of solar photovoltaic systems and electric vehicles among Dutch consumers: Implications for the energy transition. Energy Research and Social Science, 46(March), 68–85. [doi:10.1016/j.erss.2018.06.003]
VAN DER KAM, M., Peters, A., van Sark, W., & Alkemade, F. (2019). Charging behaviour of electric vehicle drivers (Version 1.1.1). CoMSES Computational Model Library, Retrieved from https://www.comses.net/codebases/365d1aa6-3ec2-4cbd-b991-5e88587f5984/releases/1.1.1/.
VAN DER WERFF, E., Steg, L., & Keizer, K. (2013a). The value of environmental self-identity: The relationship between biospheric values, environmental self-identity and environmental preferences, intentions and behaviour. Journal of Environmental Psychology, 34, 55-63. [doi:10.1016/j.jenvp.2012.12.006]
VAN DER WERFF, E., Steg, L., & Keizer, K. (2013b). It is a moral issue: The relationship between environmental self-identity, obligation-based intrinsic motivation and pro-environmental behaviour. Global Environmental Change, 23(5), 1258–1265. [doi:10.1016/j.gloenvcha.2013.07.018]
VAN DER WERFF, E., Steg, L., & Keizer, K. (2014a). Follow the signal: When past pro-environmental actions signal who you are. Journal of Environmental Psychology, 40, 273–282. [doi:10.1016/j.jenvp.2014.07.004]
VAN DER WERFF, E., Steg, L., & Keizer, K. (2014b). I am what I am by looking past the present: The influence of biospheric values and past behaviour on environmental self-identity. Environment and Behavior, 46(5), 626. [doi:10.1177/0013916512475209]
VAN SARK, W., Bosselaar, L., Gerrissen, P., Esmeijer, K. B. D., Moraitis, P., van den Donker, M., & Emsbroek, G. (2014). Update of the Dutch PV specific yield for determination of PV contribution to renewable energy production: 25% more energy! Proceedings of the 29th EUR-PSEC, 4095.
VOULIS, N., Warnier, M., & Brazier, F. M. T. (2017). Impact of service sector loads on renewable resource integration. Applied Energy, 205, 1311–1326. [doi:10.1016/j.apenergy.2017.07.134]
VVD, CDA, D66, & ChristenUnie. (2017). Vertrouwen in de toekomst - Regeerakkoord 2017 – 2021.
WARAICH, R. A., Galus, M. D., Dobler, C., Balmer, M., Andersson, G., & Axhausen, K. W. (2013). Plug-in hybrid electric vehicles and smart grids: Investigations based on a microsimulation. Transportation Research Part C, 28, 74–86. [doi:10.1016/j.trc.2012.10.011]
WILENSKY, U. (1999). NetLogo. http://ccl.northwestern.edu/netlogo/.
WILL, C., & Schuller, A. (2016). Understanding user acceptance factors of electric vehicle smart charging. Transportation Research Part C, 71, 198–214. [doi:10.1016/j.trc.2016.07.006]
ZHANG, T., Gensler, S., & Garcia, R. (2011). A study of the diffusion of alternative fuel vehicles: An agent-based modeling approach. Journal of Product Innovation Management, 28(2), 152–168. [doi:10.1111/j.1540-5885.2011.00789.x]
ZHANG, T., Siebers, P. O., & Aickelin, U. (2016). Simulating user learning in authoritative technology adoption: An agent based model for council-led smart meter deployment planning in the UK. Technological Forecasting and Social Change, 106, 74–84. [doi:10.1016/j.techfore.2016.02.009]