© Copyright JASSS

  JASSS logo ----

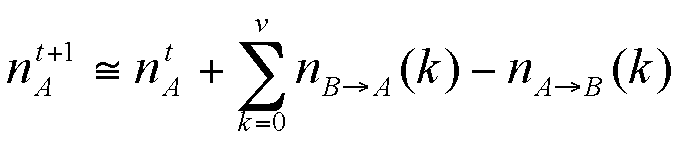
Margaret Edwards, Sylvie Huet, François Goreaud and Guillaume Deffuant (2003)

Comparing an individual-based model of behaviour diffusion with its mean field aggregate approximation

Journal of Artificial Societies and Social Simulation vol. 6, no. 4
<https://www.jasss.org/6/4/9.html>

To cite articles published in the Journal of Artificial Societies and Social Simulation, please reference the above information and include paragraph numbers if necessary

Received: 13-Jul-2003      Accepted: 13-Jul-2003      Published: 31-Oct-2003


* Abstract

In this paper we compare a version of the individual-based 'threshold model' of innovation diffusion with an aggregate deterministic model that we constructed from it. The classical threshold model supposes that an individual adopts a behaviour according to a trade-off between a social pressure (the number of neighbours adopting the behaviour) and a personal interest or resistance to change (the threshold). The aggregate model makes approximations in order to estimate the evolution of groups of individuals with the same number of neighbours of similar behaviour. We compare both models at different points of the parameter space. We find that the aggregate model gives a good approximation of the individual in some cases; however in other cases the behaviour of the aggregate approximation differs. Using theoretical interpretation of this difference based on a study of the attractors of the aggregate model, we hypothesise that the two models have the same behaviour when the aggregate model has only one attractor and that differences can occur when it has two.

Keywords:
Aggregate; Individual-based; Innovation Diffusion; Mean Field Approximation; Model Comparison

* Introduction

1.1
Individual-based models (also referred to as IBM) are more and more commonly used in ecological modelling (Grimm 1999), and to model social and economical processes (Gilbert and Troitzsch 1999). An explanation of this growing interest is that individual-based models can incorporate very detailed and refined representations of individuals and their behaviour. It is expected that this growing level of detail brings more realism to the model, which becomes a more faithful representation of reality. However, such detailed descriptions lead to models which require heavier computation with long simulation times and which are, besides, sometimes very difficult to understand.

1.2
Individual-based models can be contrasted with models defining directly the dynamics of aggregate variables describing a population. Such aggregate models have the advantage of shorter computation times. Their mathematical form provides theoretical insights on their possible behaviour, before any simulations are performed, or useful elements to explain the results. Moreover, administrators and managers are often interested in aggregate variables, such as the number of individuals, their distribution of ages, and the global biomass.

1.3
It is therefore important to understand under which conditions the development of an individual-based model will actually bring some additional insight to the studied phenomenon. For instance, if the additional complexity of the individual-based model does not result in any difference in the global behaviour, then aggregate models are certainly more appropriate.

1.4
Recent studies have sought to compare individual-based and aggregate models. (DeAngelis and Rose 1992) study the influence of transforming continuous variables into discrete distributions in models of ecological dynamics; (Picard and Franc 2001) show that space-dependent individual-based models and aggregate models (regarding either spatial influence or description of the population) of forest dynamics lead to different results. (Fahse et al. 1998) and (Duboz et al. 2002) use individual-based models to extract parameters for population-level dynamics.

1.5
We study this question for a particularly well studied model of innovation diffusion, sometimes called the threshold model (Valente 1995, Granovetter 1978). Its principle is that the behaviour of an agent is influenced by the behaviour of its neighbours (in general with a tendency to imitation), and by an intrinsic interest for one or the other behaviour. It can be interpreted as a decision based on a utility function which performs a trade-off between a social pressure and an individual interest. This model is by nature individual-based because it relies on the interactions of each individual with its neighbours (or associates in a social network). Different variants of this model are well studied and a theory of its behaviour is also available (Young 1998).

1.6
In this paper we propose an aggregate version of this model which is based on a mean field approach. We consider aggregate variables which are the proportion of the population adopting each behaviour, and consider the master equation ruling the flow from each state to the other. Such an approach is common in socio-dynamics (Weidlich 2000, Faure et al. 2002). In order to simplify this computation, we suppose that the social network is of the same size for all the agents (which is not the case in the individual-based model). We show that the results of the individual and aggregate models can be very close or very different depending on the chosen parameter values. We first present the individual and aggregate models. Then we propose some examples of simulations where their behaviours are similar, and others where they are significantly different. Finally, we propose a theoretical explanation of these results.

* Aggregating an individual-based model of innovation diffusion

The individual-based model of innovation diffusion

2.1
The threshold model was initially inspired by the sociology of innovation diffusion. Its principle is that the decision of an agent to change its behaviour relies on a trade-off between a social pressure (considering the behaviour of its neighbours), and an intrinsic, personal interest.

2.2
We consider here the stochastic version of the model. We recall hereafter the main features of this model (see also the Java code in Appendix 1). More details can be found in Young (1999).

2.3
We consider N agents, having the choice between two behaviours: A and B. N is constant over time. Each agent i has a social network V(i). In our experiments the social network is randomly drawn: we define a priori a number of links for the whole population, and pick the links at random. The social network is therefore characterised by the average number of links v for an individual.

2.4
To take an example, let's consider a village, the overall water consumption of which we would like to follow; A represents scarce watering and B generous watering. We suppose that there are no newcomers and no one moves out during the time of the observation. The social network is represented by the direct neighbours. Although the total number is known, the number of neighbours varies following whether one lives in the village itself or in the outskirts.

2.5
The choice to adopt either the A or the B behaviour ensues from a utility computation. The utility Ui(A) and Ui(B) of agent i to choose A or B is expressed as :

Equation 1a (1a)

Eqn 1b (1b)

where V(i,A) and V(i,B) are the number of neighbours of agent i respectively of behaviour A or B and the a,b,c,d are parameters of the model. We suppose hereafter that eiA = eiB = 0

2.6
One gets a positive social utility when following the behaviour of one's neighbours, because it strengthens links and provides interesting subjects for conversation (this corresponds to the terms aV(i,A) and bV(i,B)). But you can also be negatively influenced by neighbours you disagree with (this corresponds to the terms cV(i,B) and dV(i,A)). (To take a simple example, if c=d=0, the order between the utilities depends only on a and b. If a=b the greater utility will correspond to the dominant behaviour in the neighbourhood. If a=2b, it will be sufficient that every third neighbour follows A to get Ui(A)>Ui(B) - this could correspond to a case where the innovation spreads easily because it appears attractive. Nevertheless, if all neighbours follow B, Ui(B) > Ui(A).)

2.7
In order to take into account individual variability and uncertainty in the decision, Young introduces a stochastic response. Let's consider an individual who has to determine his behaviour. The social utility will influence his choice but he may also be influenced by local stochastic events such as: his water bill or the weather. An individual will not automatically choose A if U(A>U(B), but the utilities will lead him to determine probabilities (noted respectively P(A) and P(B)) of actually adopting one or the other behaviour. (However if U(A)>U(B) then P(A)>P(B)).

2.8
The probability for an individual i of adopting A or B is defined by :

Eqn 2a (2a)

Eqn 2b (2b)

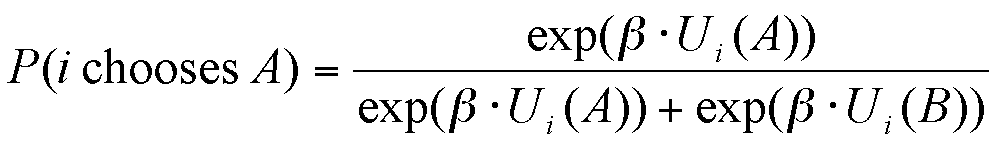
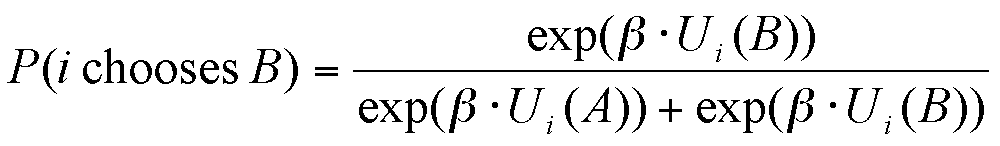
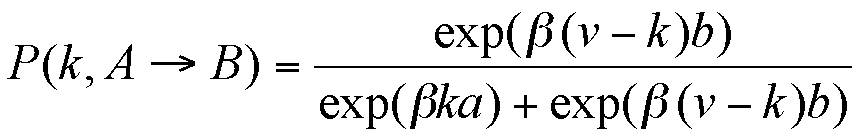
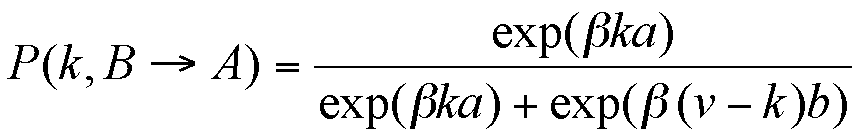
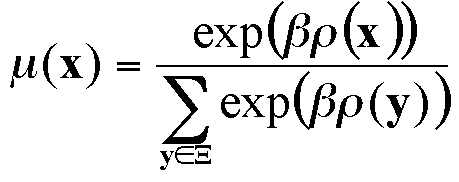
The extent of the dependence of the final choice on the social utility, which corresponds to the uncertainty in the decision, is ruled by the parameter β.

2.9
For β=0, the function is purely random. Both behaviours have the same probability of 0,5. In this case the choice of individuals doesn't depend on their social context traced by their computation of utilities.

2.10
The greater β is the more the difference between the utilities affects the probabilities, by favouring the behaviour with the greater utility. For β → ∞ , this function becomes quasi deterministic: if U(A)>U(B), P(A) becomes very close to 1, whereas P(B) nears 0.

Aggregating and mean field approximation

2.11
We build a coherent aggregate model following the socio-dynamics (Weidlich 2000, Faure et al. 2002) approach which is inspired by physics. The principle is to consider the evolution of the probability distribution in the states of the model, ruled by a "master equation". In the case of the mean field approximation, we consider only the evolution of the mean of this probability distribution.

2.12
We consider here the number of individuals following A (respectively B). Moreover, we suppose that all the agents have the same number of neighbours v, and consider the case where c=d=0. This means we suppose that social utility only rewards imitation. We pick an individual and try to calculate the probability of his neighbourhood favouring one or the other behaviour (for instance the probability of not having any neighbour following A is very low if A is the overall dominant behaviour). Once this neighbourhood is given, the probability of him following each of the behaviours is known.

2.13
Therefore we define the state of the system by a vector of the number of agents with behaviour A having 0, 1...v neighbours with behaviour A, and similarly for agents of behaviour B. We call nA(k) the number of agents with behaviour A and k neighbours of behaviour A. Similarly, we call nB(k) the number of agents with behaviour B and k neighbours of behaviour A.

2.14
The state s(t) of the model is therefore a vector of dimension 2v+2:

Eqn

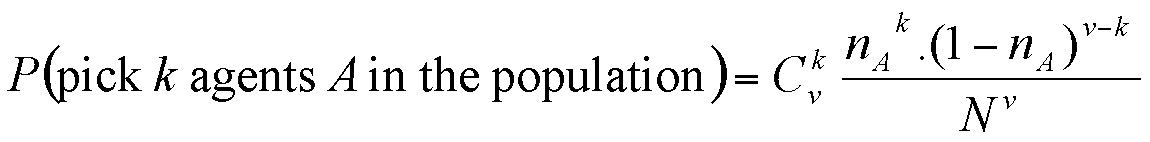
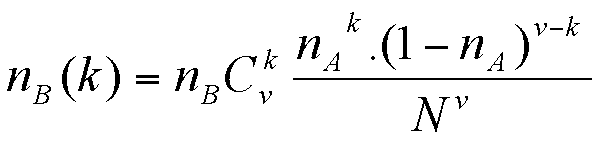
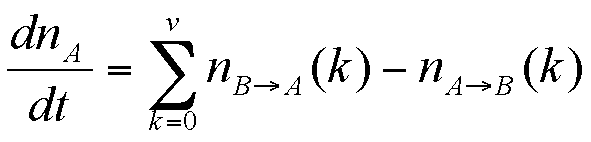
Suppose that there are nA agents of behaviour A in the population (and nB = N - nB agents with behaviour B). We approximate nA(k) as being proportional to the probability of picking k agents with behaviour A among v picked at random from the population. This probability is given by the binomial formula:

Eqn

From which we derive:

Eqn

Similarly, we have:

Eqn

2.15
Once given a neighbourhood we can then estimate the associated utility of choosing one or the other behaviour, and thereby, the probability for our picked individual to effectively choose this behaviour (see equations (1a) and (1b), and (2a) and (2b)).

2.16
For each agent in nA(k), the probability of choosing B is given by:

Eqn 3a (3a)

2.17
Similarly, for any agent in nB(k), the probability of choosing A is given by:

Eqn 3b (3b)

2.18
Thereafter we extrapolate to the whole population, by using the probability of change for one individual randomly chosen to estimate the flows between the groups. β here rules the uncertainty of decision making, i.e. to the extent to which the decisions depend effectively on the social context.

2.19
We can approximate the number of agents which will change their behaviour by their average number (mean field approximation) :

Eqn 4a (4a)

Eqn 4b (4b)

2.20
This allows us to evaluate the evolution of the number of agents A in the population, following a first order approximation :

Eqn

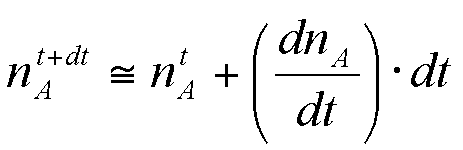
The derivative is expressed as

Eqn 5 (5)

So the new number of agents A becomes (for dt=1)

Eqn 6 (6)

Which finally leads to a deterministic equation for the evolution of our aggregate model, coherent with the individual-based model :
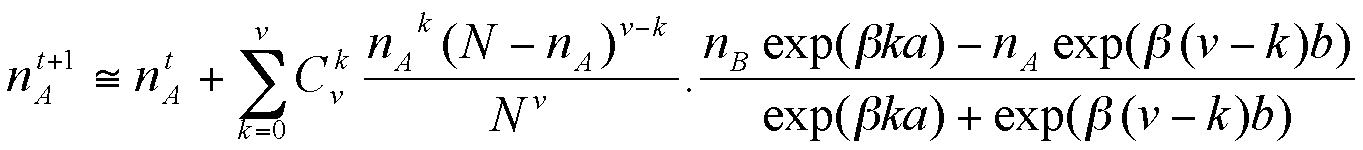
Eqn 7 (7)

This gives us the new value of nA, and we can compute the value of s(t+1), and iterate again.

* Experimental comparisons

3.1
We have run comparative simulations for various parameter values (for 100 individuals), comparing the evolution of nA over time for both the individual-based and the aggregate model. One time step corresponds to a re-evaluation of each individual's behaviour. We have observed that in some cases the results are similar, but that they can also be different depending on the parameter values. To illustrate this, we here exhibit the results for two sets of parameters.

3.2
In both cases we have a = 3, b = 2, c = d = 0. In the first case, we used β = 0.15 and in the second β = 0.6. (These correspond to different degrees of uncertainty in the decision.)

3.3
Note that even with this set of parameters the behaviour of the model remains quite complex and interesting. We expected that the aggregate model would approximate well the mean results from the individual-based model. However, we observe that in the first case the results are very similar, whereas in the second there are differences which are then interpreted in section 4.

With β = 0.15 the models have similar behaviours

3.4
For a = 3, b = 2 and β = 0.15 the aggregate model approximates the mean dynamics of the individual-based one. Figure 1 shows the proportion of A over time for the aggregate model and for the individual-based model, for an initial proportion of A behaviour is here 0. The aggregate model is deterministic and provides a single value. The individual-based model is stochastic. We have shown the mean value for 150 simulations; the minimum and maximum moreover give an idea of the range of values produced by the individual-based model over 150 simulations for this set of parameter values.

Figure 1
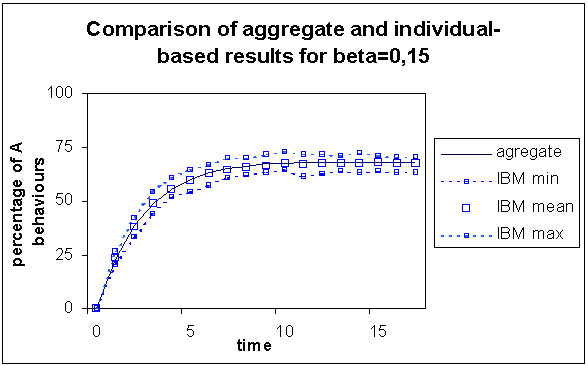
Figure 1. Comparison of the results of the aggregate with the individual-based model for β = 0.15, for which out of 150 simulations are represented the minimum, the maximum and the mean values. The trends are very similar

3.5
From an initial proportion of 0% A behaviours in the population, both models tend towards a value around 68%, which seems to be an equilibrium for the aggregate model. At every time step, the results of the aggregate model are very close to the mean calculated from the individual-based model's simulations.

3.6
Here the hypotheses we made to construct the aggregate model seem to be justified, since the aggregate model provides a good estimation of the evolution of the mean of the individual-based model.

With β = 0.6 the models exhibit different behaviours

3.7
We performed a second series of simulations with similar parameter values for the payoff matrix (a=3, b=2, c=d=0) but with β=0.6; here the results of the simulation depend on the initial proportion of A behaviours in the population. Hereafter we present the results of comparison for two sets of simulations corresponding to initial proportions of A behaviours in the population of 15% and 23%, which trace the two kinds of outcomes we obtained.
Comparison for an initial proportion of A behaviours of 23%

3.8
In figure 2 we show the results of the individual-based and the aggregate models for an initial proportion of A behaviours of 23%. For the individual-based model we have represented the mean value at each time step, calculated over 150 simulations.

Figure 2
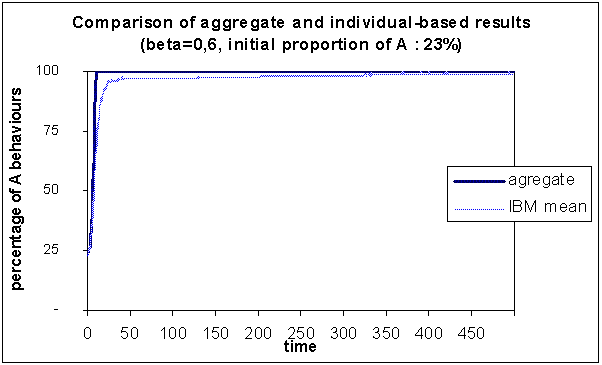
Figure 2. Comparison of the results of the aggregate with the individual-based model, for which we have represented the mean over 150 simulations, for β = 0.60 and initially 23% A behaviours

In this case, at long term the mean of the individual-based model is very similar to the result from the aggregate model, i.e. 100% A behaviours.

3.9
Regarding the individual-based model, Young (1999) showed that the most probable state (over time) for these parameter values is 100% A. (This doesn't mean that this state is final for each simulation - the stochasticity induces perpetual variations to the state of the system - but that over a sufficiently long period this state is the most often visited. Moreover this property means that the mean over many simulations will reflect this attraction towards this most probable state.)

3.10
Once the deterministic aggregate model reaches a state of equilibrium it no longer leaves it. Therefore we can define this as its most probable state. Therefore we can conclude that both models give us similar results concerning the most probable state for the system. However the aggregate model converges faster than the mean value of the individual-based model; it doesn't approximate the mean values of the individual-based model over time as closely as for the previous set of parameter values. Finally, both models tend towards 100% of A behaviours, but in slightly different ways.
Comparison for an initial proportion of A behaviours of 15%

3.11
We have performed similar comparison for an initial proportion of A behaviours of 15%.

Figure 3
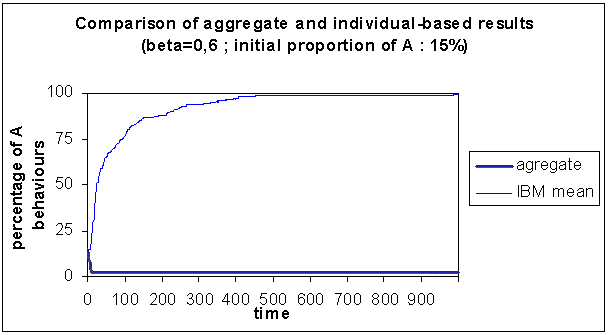
Figure 3. Comparison of the results of the aggregate with the individual-based model, for which the mean out of 150 simulations is represented, for β = 0.60 and initially 15% A behaviours

3.12
In this case the behaviours of the two models are very different. As in the previous case, the mean of the individual-based model tends towards 100% A behaviours, but the aggregate model evolves quickly towards 0% A behaviours, which is its final state. These results seem to indicate the existence of more than one attractor for the aggregate model. In the next section we will detail elements to characterise the aggregate model's dynamics and confirm this hypothesis.

* Theoretical explanation of the experiments

Stochastic attractor of the individual-based dynamics

4.1
Young (1999) defines the following potential in order to determine the states of equilibrium of the individual-based model.

Eqn

where x is the vector of choices of the individuals, and A(x) (respectively B(x)) represents the number of links between two individuals with A (respectively B) behaviours. The equilibrium states correspond to maxima of this potential. We see that all-A or all-B are local maxima, since the change in opinion of a single individual can only lead to a decrease of this potential in these cases.

4.2
Thereafter Young characterises the almost sure frequency μβ(x) with which a state x is visited over the long run.

Eqn

Therefore the most likely state x is the one that maximises the potential function ρ(x). However, note that there is a strictly positive probability for each state to appear (even though it can be very small). The mean of a set of simulation results is therefore expected to tend towards a mean of the most probable states, weighted by μ(x).

Classical attractors of the aggregate dynamics

4.3
In order to get a better idea of the evolution of the aggregate model, we seek to define similarly a potential for characterising the equilibrium states and dynamics of the aggregate model.

4.4
This potential is expected to be a function of the state, which for the aggregate model is defined by nA. As seen in equation 5, dnA/dt is only a function of nA, and does not depend on t, so that we can define f(nA) = dnA/dtdnA/dt. Since the potential's optima are expected to correspond to states of equilibrium for the system (defined by f(nA) = dnA/dtdnA/dt = 0), we define the potential ρ(nA) as proportional to the integral (from n=0 to n=nA) of f(nA) (equation 8).

Eqn 8 (8)

A unit time step is defined as the time necessary for the re-evaluation of behaviours for the whole population, following the rules proposed by Young.

4.5
This derivative allows us to determine whether, for a given proportion in A behaviours, the model will compute a new proportion higher (positive derivative) or lower (negative derivative) than the previous one. Therefore the values for which the derivative is zero are those where the model retains the same proportion in A behaviours and hence represent points of equilibrium, which are sometimes attractors.
Attractors for β=0.6

4.6
The following figure represents, for β=0.6 an approximation of the derivative and the potential associated with the aggregate dynamics, whose minima describe the stable states of equilibrium (and attractors) (and the maxima, the unstable ones).

Figure 4
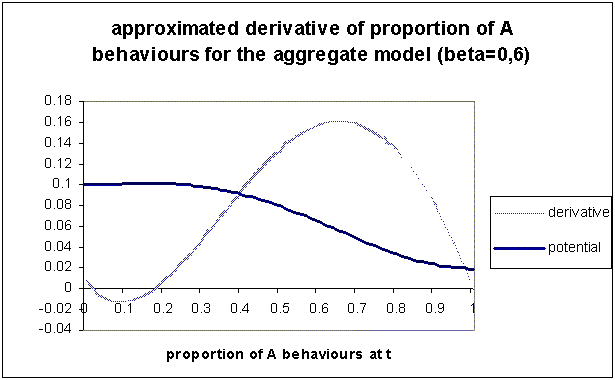
Figure 4. Approximated derivative and associated potential, of the aggregate calculation of proportion of A (proportions between 0 and 1) for β=0.6. The minima of the potential describe the attractors of the aggregate model's dynamics. Here there are two: one for 0% A and one for 100% A

4.7
We notice this derivative meets zero in three points, corresponding to the local extrema of the potential function. The two extreme points are minima: this means attractors; they correspond (as expected) to the final states all-A and all-B, confirming the trends observed in the aggregate model simulations. Moreover we see that there exists an unstable intermediate point of equilibrium, which delimits the attraction basins. What's more we see that the values of the initial proportion of A behaviours, used for the two examples corresponding to β=0.6 are located in two different attraction basins.

4.8
For values smaller than the limit between the two basins, the derivative is negative, causing the proportion of A behaviours to decrease towards the all-B attractor; this explains the quick trend towards 0 observed in the aggregate case for an initial proportion of 15% in A behaviours.

4.9
In contrast to this, for values greater than this point the derivative is positive, causing an increase of the A behaviours in the population towards the all-A attractor. This corresponds to the trend observed for an initial proportion in A behaviours of 23%.

4.10
For this combination of parameter values, where more than one attractor exist, the initial value is decisive for the final state of the aggregate model. Since it is deterministic, it follows the trend defined by the derivative and reaches the attractor in the basin of which the initial proportion of A behaviour is located.

4.11
On the contrary the individual-based model always reaches the all-A state which we consider to be its dominant attractor (in opposition to all-B which is also a local attractor as we showed in section 4.1) - this appears clearly in the trend of the mean over the set of simulations. We can hypothesise that this behaviour is due to its stochasticity, which could somehow act like simulated annealing (Kirkpatrick 1983), allowing the dynamics to leave the attraction basin around the all-B state at some point in time.
Attractors for β=0.15

4.12
Conversely let's consider a similar diagram for β=0.15 (see figure 5), to confirm the hypothesis of a link between the difference between the models, and the existence of two attractors and possible final states for the aggregate model.

Figure 5
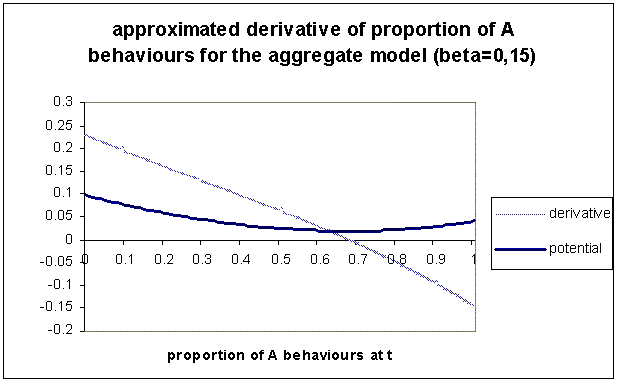
Figure 5. Approximated derivative of the aggregate calculation of proportion of A, for β=0.15. Only one attractor corresponding to the minimum of the potential appears around 68% of A behaviours

4.13
We see here there is a unique attractor (the minimum of the potential) around 68% A behaviours, foreseen by the aggregate model, and which corresponds to the mean state computed for the individual-based model (see figure 1).

Influence of β on the mean final state

4.14
In order to understand more precisely the influence of β on the result, we observe and compare the final states predicted by the aggregate model and those observed in the individual-based simulations, for small values of β. In this case the behaviour of the models is close to pure randomness.

4.15
We have represented on the one hand the stable and unstable points of equilibrium computed for the aggregate model from its derivative and potential. On the other hand there is the "mean state" of the individual-based model (over 5000 time steps). To evaluate this, we consider the evolution of the mean proportion in A behaviours (starting from an all-B state), computed over the set of simulations, for one time step. We then take the average over time of this one-time-step mean, from the first point where it doesn't increase and varies only little (so seems to reach stability), until the end of the simulations (this always represents over half of the time steps). Following Young this mean state theoretically depends on the weighting (defined by β) on the equilibrial states of the individual-based model.

Figure 6
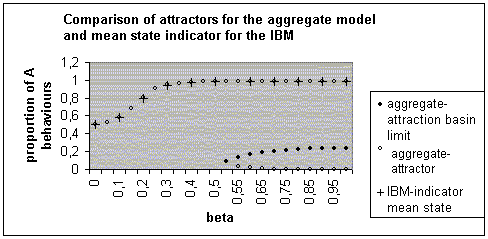
Figure 6. Different equilibrium states for the aggregate model and mean final states for the individual-based model, for different values of β

4.16
Considering increasing values of β, the aggregate model has first only one (for β < 0.52), then two stable equilibria. The existence of an unstable equilibrium defines the limits of the attraction basins for the two stable attractors. We see that the basin around nA=0 is smaller than the one around nA=1, which seems to echo the dominance of 1 (all-A) in the individual-based model.

4.17
For the individual-based model, for very small values of β the weighting of the different attractors is very similar, thereby favouring an intermediate state. The more β increases, the more the dominance of the all-A state appears, as the mean state nears 100% A behaviours. (For β higher than 1 (up to 50), the mean state of the individual-based model, the attractors and the limit of the attraction basins of the aggregate model do not vary much.) The attractors of the aggregate model seem to successfully predict this mean-state indicator of the individual-base model.

* Discussion

Why do the results from the models sometimes differ?

5.1
From our simulations and theoretical analyses we can build a hypothesis to explain why individual-based model and aggregate model sometimes have sometimes similar and sometimes different, behaviours. When the aggregate model only admits one attraction basin, both models evolve in the same way. When there are two attraction basin for the aggregate model, the two models can have different behaviours. Because of its determinism, the aggregate model will converge towards the attractor in the attraction basin in which its initial proportion in A behaviours is located.

5.2
The individual-based model is stochastic, and therefore we can hypothesise that its dynamics may allow it to leave an attraction basin for another. We have shown that for the values of parameters a=3 and b=2 the limit between the two cases appears around β ~0.52. Further works are being presently being undertaken to clarify the influence of other parameters in the definition of this difference (Edwards et al. 2003).

Limits of our approach

5.3
These results proceed from relatively few parameter values tested. Although Young showed that even for these values the model has an interesting behaviour, we believe that more will be understood when studying other values. Moreover we consider a small number of individuals (100) (which often allows a greater variability in the results) and observe a finite number of iterations (up to 5000), which conditions the results we obtain.

5.4
This work is based on the construction of an aggregate model coherent with the individual-based model. Such a construction is not always possible especially if the individual-based model is more complex. However, we believe that even then the construction of an aggregate model can bring interesting insights. Moreover we have used rather simple indicators for comparing the two models. Further studies of the differences between the two models will probably enable us to understand better the reasons for these differences.

Comparing individual-based model and aggregate model

5.5
We have shown in this article that the comparison between an individual-based model and a coherent aggregate model is interesting:
  • It shows that, for some parameter values, the two models have a similar behaviour; in these cases the aggregate model is sufficient. Using this model will save us simulation time.
  • The study of the aggregate model can also provide interesting insights into the dynamics of the individual-based model or, at least, to suggest hypotheses about it.
  • When observing the attractors of the aggregate model, we see that the dominant one corresponds to the mean calculated from the individual-based model in the long term: even when the aggregate model doesn't foresee the temporal evolution it seems to provide synthetic predictive elements for the long-term dynamics of the individual-based model.

* Conclusion and perspectives

6.1
From the individual-based decision model studied by Young, we have constructed an aggregate model which describes, at population level, the evolution of the proportions of the behaviours. The results show that, in some cases, this model approximates well the mean value of the results provided by the individual-based model.

6.2
We have identified, interpreted and characterised a cause of divergence between the two models, by constructing an approximate derivative from the aggregate model. In the case where the parameter values define more than one attractor, the aggregate model is sensitive to initial conditions, which can lead it to different final states. The individual-based model seems to avoid being trapped by secondary attractors through its stochasticity, which seems to acts somehow like simulated annealing.

6.3
If the aggregate model doesn't approach the behaviour of the individual-based model in all cases, it provides nevertheless interesting theoretical elements with which to understand the individual-based model's behaviour at an aggregate level.

* References

DEANGELIS, D.L. and Rose, K. A. (1992) "Which Individual-Based Approach Is Most Appropriate for a Given Problem?" in DeAngelis, D.L. and Gross, L.J. Editors (1992) Individual-based models and approaches in ecology. Chapman & Hall.

DUBOZ, R., Ramat, E. and Preux, P. (2002) "Scale transfer modelling : using emergent computation for coupling an ordinary differential equation system with a reactive agent model", System Analysis - Modelling - Simulation, 43(6): 793-814.

EDWARDS, M., Huet, S., Goreaud, F and Deffuant, G. (2003) "Comparaison entre un modèle individu-centré de diffusion de l'innovation et sa version agrégée dérivée par champ moyen pour des simulations à court terme", Proceedings of the workshop Modèles Formels de l'Interaction (MFI) 2003, Lille (France)

FAHSE, L., Wissel, C. and Grimm, V (1998) "Reconciling Classical and Individual-Based Approaches in Theoretical Population Ecology: A Protocol for Extracting Population Parameters from Individual-based models", The American Naturalist, vol. 152(6):838-852.

FAURE, T., Deffuant, G. and Weisbuch, G. (2002) "Dynamics of influence on continuous uncertain opinions : Evolution of the opinion probability distribution", submitted.

GILBERT, N. and Troitzsch, K. G. (1999) Simulation for the social scientist. Milton Keynes: Open University Press.

GRANOVETTER, M. (1978) "Threshold models of collective behaviour", American Journal of Sociology 83:1360-1380

GRIMM, V., (1999) "Ten years of individual-based modelling in ecology: what we have learned and what could we learn in the future?", Ecological Modelling, 115, p.129-148.

KIRKPATRICK, S., Gelatt, C.D. and Vecchi, M.P. (1983) "Optimization by Simulated Annealing,'' Science, No. 4598, 13 May.

PICARD, N. and Franc, A. (2001) "Aggregation of an individual-based space-dependant model of forest dynamics into distribution-based and space-independent models", Ecological Modelling, 145(1): 69-84.

VALENTE, T.W. (1995) Network models of the diffusion of innovations. Cresskill, New Jersey, Hampton Press.

WEIDLICH, W (2000) SocioDynamics: A Systematic Approach to Mathematical Modelling, Harwood.

YOUNG, P. (1998) Individual Strategy and social structure, Princeton University Press

YOUNG, P. (1999) "Diffusion in Social Networks", Working Paper No 2., Brookings Institution.

----

ButtonReturn to Contents of this issue

© Copyright Journal of Artificial Societies and Social Simulation, [2003]