© Copyright JASSS

  JASSS logo ----

Claudia Pahl-Wostl and Eva Ebenhöh (2004)

An Adaptive Toolbox Model: a pluralistic modelling approach for human behaviour based on observation

Journal of Artificial Societies and Social Simulation vol. 7, no. 1
<https://www.jasss.org/7/1/3.html>

To cite articles published in the Journal of Artificial Societies and Social Simulation, please reference the above information and include paragraph numbers if necessary

Received: 09-May-2003      Accepted: 03-Aug-2003      Published: 31-Jan-2004


* Abstract

This article describes a social simulation model based on an economic experiment about altruistic behavior. The experiment by Fehr and Gächter showed that participants made frequent use of costly punishment in order to ensure continuing cooperation in a common pool resource game. The model reproduces not only the aggregated but also the individual data from the experiment. It was based on the data rather than theory. By this approach new insights about human behaviour and decision making may be found. The model was not designed as a stand-alone model, but as a starting point for a comprehensive Adaptive Toolbox Model. This may form a framework for modelling results from different economic experiments, comparing results and underlying assumptions, and exploring whether the insights thus gained also apply to more realistic situations.

Keywords:
Social Simulation, Experimental Economics, Common Pool Resource Games, Adaptive Toolbox, Altruistic Punishment

* Introduction

1.1
Understanding behaviour of human beings in complex decision making situations is of vital importance for the design of appropriate institutions for sustainable resources management and for managing transition processes towards more sustainable resource management regimes. Most initial efforts have relied on game theoretical approaches and extensions thereof. However, a number of common pool experiments and other empirical evidence showed clearly that the assumptions on rational behaviour are not supported by observation (Ostrom 2000). Researchers explored for example the importance of trust, reciprocity, and reputation to introduce and stabilize social norms of cooperation in a group (e.g. Hayashi et al 1999). Social simulation may play an important role to develop an improved representation of the complex dynamics of human-environment systems.

1.2
One may distinguish four different approaches:
  • Start from an established formalized theoretical framework (e.g. rational actor paradigm, game theoretical approach) to test conditions of applications and the consequences of relaxing certain assumptions. The extension can be based on observation or principle considerations about the deficiencies in the framework (cf. Lindenberg 1991). In general such approaches remain within the boundaries of a given framework.
  • Combine concepts from different social sciences to develop an interdisciplinary approach and build a simulation framework (e.g. Jager et al 2000, Epstein and Axtell 1995, Kottonau 2002) as experimental laboratory to explore the implications of different assumptions on system dynamics. This is a potentially very rewarding excercise that may support to overcome the fragmentation of different streams of theories in a field.
  • Start from very simplified rule-based representations for social behaviour that are more determined by considerations of complex dynamics rather than explicit social science theoretical considerations. This is the approach of socio-econo-physics or the simple models from Thomas Schelling exploring the importance of spatial interaction for racial seggregation. The recent article by Deffuant et al (2002) and the subsequent comments (von Randow 2003; Deffuant et al 2003) provided an illuminating example for arguments in favour and against the sociophysics approach.
  • Start from observation and extract regularities of behaviour (e.g. Todd and Gigerenzer 2003). This approach does not claim to achieve an overall synthesis by combining existing theoretical frameworks. But it is guided by some assumptions on human behaviour (in our case the importance of heuristics and different basic dispositions towards cooperativeness in human beings) and relies first of all on observation (also in our case the design of the experiments was not free from theoretical assumptions).
Each approach has its strengths and weaknesses. The work presented in this paper is based on the last approach since we are convinced that starting from observation is required to promote real innovation and integration. The insights derived from a more inductive approach should, however, be confronted with established theories to explore possible contradictions or coincidences. In the end a fruitful exchange among all the approaches outlined above will promote insights and change.

1.3
In this paper we present the idea and the first steps towards the implementation of an adaptive toolbox (cf. Gigerenzer and Selten 2001) as a multi agent system with diverse agents that can behave differently according to different situations and contexts. In order to capture realistic human behaviour the model is founded in experimental data rather than theory. In contrast to many approaches that use the data to test and extend current disciplinary theories we use the data to extract similar patterns and heuristics that determine human behaviour. By doing so we apply an interdisciplinary approach in the social sciences. We expect that such an approach will promote real innovation in our understanding of human behaviour and its representation in models. It is our goal to contribute to a coherent simulation framework that allows to explore different perspectives on human behaviour and compare their strengths and weaknesses as well as their applicability in different situations. Hence, we make a strong plea for a pluralistic approach.

WHY an adaptive toolbox?

1.4
Representation of human behaviour in models is still surrounded by huge uncertainties and major controversies. This may be attributed to a lack of an overall accepted interdisciplinary approach in the social sciences. Many different and partly contradicting approaches for explaining human behaviour coexist within social science disciplines and even more in the different disciplinary approaches. The most formalized theory is the rational actor paradigm (referred to as RAP in the following) in economics. Arguably the success of this approach can be attributed to the fact that formalization provides a base for better communication and unification and to the simplicity of the concept. The supporters of the RAP have refused for years, even decades, to acknowledge criticism and scientific arguments providing evidence for some weaknesses in their assumptions. However, the situation is slowly changing. The rational actor paradigm of economics becomes enriched by insights from psychology and sociology (Daniel Kahneman and Vernon Smith were awarded the nobel price in economics for this, http://www.nobel. se/economics/laureates/2002/index.html). Some argue even for a more radical approach to abandon the RAP entirely, to move from omniscience and perfect foresight towards more simplified and realistic descriptions that are not due to imperfections of the human brain but evolved to guarantee survival in complex and dynamic environments (Gigerenzer and Selten 2001). It must be the goal of social simulation to come up with strong alternatives to the RAP. One should move from the dominance of a single concept to a pluralistic approach with different perspectives on human behaviour that take into account the importance of context and the diversity of human beings. Social simulation should provide the base for an interdisciplinary framework that allows to combine different aspects of human behaviour that are all required to fully understand the complexity of human systems. Without imposing the constraining rigour of analytical mathematics, any simulation approach forces the analyst to be more consistent in his/her assumptions. Development of coherent simulation frameworks will foster the development of more comparative and interdiscplinary approaches. This was also highlighted by Epstein and Axtell (1995) in their pioneering work on artificial social societies, the sugarscape model.

1.5
Progress in the representation of human behaviour is crucial for improving the credibility of using social simulation, in particular for real world applications. The choice of behaviour may crucially determine model outcomes (Hare and Pahl-Wostl 2001). The adaptive toolbox is a step towards representing a range of behavioural types. It will provide a base to explore which assumptions on human behaviour are supported by experimental and empirical evidence. A distinction should be made between experimental and field data. Field data are derived from controlled experiments with human beings in repeatable settings. They allow statistical evaluation and have the advantage of comparability. However, as is the case for any experimental approach the settings may be quite arbitrary and aim at reducing complexity by eliminating subjective context as much as possible. The chosen experimental human subjects (often students) may not always be representative for a wider sample of the population. Empirical data are derived from observations in case studies or other real world situations. They have the advantage of portraying the real world and not an artificial setting. However, given the uniqueness of any real world situation and its specific context, interpretation and comparability are difficult. The adaptive toolbox model will support a better use of experimental observations and a testing if they can be applied to real world situations. It will allow to explore what determines which kind of approach is an appropriate representation of human behaviour in a given context.

1.6
In the case reported in this paper data were derived from common pool games in experimental economics. An advantage of such data sets is the availability of numerous data which are comparable due to the standardized settings. The games explore mainly the important aspects of fairness, trust, norms, cooperative behaviour versus free-riding which are all crucial for understanding management of common pool resources - our main area of interest. Previous simulation approaches reproduced the aggregated behaviour of experiments with different assumptions on the behaviour of agents. They pointed out that the comparison with aggregated behaviour did not allow them to decide what would be the more appropriate assumptions on agent behaviour. We explore here also the behaviour of individuals and hope to get thus more insights about behavioural processes.

1.7
After giving a brief introduction into the concept of an adaptive toolbox in the next section, we describe our modelling approach in detail in section 3, "Building models from data". This article includes first results in section 4 and a discussion of this model in section 5. It concludes with section 6 on the contribution of the described work to an overall framework and an outlook of this approach's further perspectives.

* Adaptive Toolbox

2.1
Human behaviour varies from mentally challenging, deliberate decisions to unconscious behavioural patterns that follow adopted roles or trained routines. In different problem environments different levels of consciousness are employed. This has to be taken into account when these problem environments are modelled. The adaptive toolbox described below presents a possibility to deal with this diversity by introducing the notion of heuristics that lie in between consciously making decisions and unconsciously following routines.

Concept

2.2
Based on Herbert Simon's concept of "Bounded Rationality" (cf. Todd and Gigerenzer 2003) Gigerenzer developed the notion of an "adaptive toolbox" (Gigerenzer and Selten 2001). It captures the idea of decision making as the use of different heuristics under different circumstances. The idea is based on the suppositions of three concepts: psychological plausibility, domain specificity, and ecological rationality (Gigerenzer 2001, p. 38).
  1. Psychological plausibility is explicitly opposed to decision making as a maximizing process with unlimited time, memory and computational capacities. It is also different from optimization under constraint (satisfycing), because instead of calculating an optimal stopping point, the stopping rule is also a simple heuristic.
  2. Domain specificity covers the idea that heuristics work in some problem environments, while other heuristics are used in other environments. Heuristics are composed of simple building blocks, that can be re-assembled to form other heuristics.
  3. Finally, an ecologically rational heuristic is one that prevails in an adaptation process (like evolution), rather than being an "optimal" decision making process. This leaves room for the coexistence of different strategies.
The reference to adaptation processes, as described by evolutionary biology, is a strong motivation for the adaptive toolbox. Some heuristics that humans employ, like emotions, can not be justified by the RAP. However, they may have originated and prevailed in an evolutionary adaptation process.

2.3
"The quest for psychological plausibility suggests looking into the mind, that is, taking into account of what we know about cognition and emotion in order to understand decisions and behaviour. Ecological rationality in contrast, suggests looking outside the mind, at the structure of environments, to understand what is inside the mind." (Gigerenzer 2001, p. 39) For implementing an adaptive toolbox we have to do both.

2.4
The adaptive toolbox consists of building blocks that define the actual choice (cf. Gigerenzer 2001, p.43). These building blocks include simple rules for searching for solutions to a given situation (search rules), stopping the search, if a satisfying (not necessarily optimal) solution is found (stopping rules), and decision rules to choose between alternative solutions. The prerequisite of simplicity of these rules assures the outcome of the decision making process to be "fast, frugal, and computationally cheap". For instance, emotions can function as a very simple form of a stopping rule. Decisions are chosen through simple heuristics, that work, because they take the problem environment into account. Information processing can be done with reference of the information providing environment. If, for example, the environment is noisy and information is scarce, then data are not reliable and therefore calculating with it is bound to be less effective than searching for cues. Also, if the environment is a social environment, other agents have to be taken into account, aspects like fairness and accountability have to be considered (Gigerenzer 2001, p.46). Of course, boundedly rational agents often have an incomplete and faulty perception of the environment.

2.5
In addition to the rules there is need for learning mechanisms to ensure ecological rationality. These learning mechanisms may be routine-based learning, reinforcement learning, or even cognitive learning (Brenner 1999, p.334, p.338).

Implementation

2.6
The implementation of an adaptive toolbox aims at a reusable agent model for social simulation that is not only complex enough to cover different kinds of human behaviour, while simple enough to be usable for large populations, but also captures realistic decision making.

2.7
According to the conceptual considerations described above, the implementation has to include at least the following aspects:
  • Agents have a representation of their decision environment.
  • Agents have a representation of their social environment.
  • Agents doubt their perceptions, they know that they have only beliefs and only sometimes "true" factual knowledge. This leads to adaptation through learning processes (see below).
  • Agents have a set of possible solutions to a given problem and choose among them by using fast and frugal heuristics. In principle, the search for new solutions should also be possible.
  • The solutions themselves are simple and do not usually involve calculation.
  • 2.8
    Implementing adaptation through learning processes is an important aspect of the model. There are two dimensions in which human behaviour changes due to learning processes, according to different time scales of the underlying processes. According to the concept of an adaptive toolbox outlined above, the first dimension is influenced by the environment of a problem. In some settings the environment changes rather fast. According to changes in the physical environment the strategy choices vary. The social environment (other humans) affects a quick learning process which has also influences strategy choice. The other dimension is the internal disposition the individuals. This includes both the predispositions, for example the individual propensity to behave in a fair way, and the prior assumptions about the others' behaviour. A change in disposition can be seen as a slow learning process. So far we have not modelled change in disposition.

    2.9
    In addition, we strongly believe in modelling heterogenous agents, so that there is room for different behavioural traits and beliefs. The need for modelling different kinds of behaviour arises from the fact that some experimental evidence can not be explained by neither an "average behaviour" nor the rational model, like non-linearities and self organization. The altruistic punishment experiment (cf. Fehr and Gächter 2002) that is the basis for our first application is an example that can not be explained by analyzing average behaviour only.

    2.10
    The implementation itself poses a challenge because both the environmental settings and the heuristics/behavioural traits have to be encapsulated. This requires a thorough understanding of the decision making process to be modelled in order to be able to come up with a valid abstraction.

    * Building models from data

    3.1
    As has already been indicated in the Introduction there is no unifying theory of human behaviour in the social sciences. One may question if such a state is really desirable given the richness of human behaviour. However, currently the multitude of theoretical approaches characterizes a state of fragmentation and not a vivid multi-perspective approach. Numerous theories coexist, in different disciplines, but also within single disciplines. Often, these theories contradict each other and, more often, they are heavily disputed within and between disciplines. Example for highly controversial theories are structural behaviouralism by Talcott Parsons and the theory of social systems by Niklas Luhmann. Each of these theories is regarded as conceptional breakthroughs by some collegues, and as fancyful artifacts by others. This poses a major problem for modellers of social systems and for modellers, who want to include the "human factor" in their interdisciplinary models. If a modeller of climate change wants to include human reactions on perceived or expected weather changes into the model, those reactions should be based on some notion of how people behave in such situations. However, modellers have to face the ambiguity of multiple representations of human behaviour. Matters are complicated further, because usually model outcomes depend crucially on the theoretical assumptions underlying the implemention of human behaviour.

    3.2
    Economics is the only social science discipline with a dominating theory of human behaviour, the rational actor paradigm (RAP). Although originally this was meant to explain only economic activity, it has been adapted into other areas, and some economists view the RAP as universal. RAP is very useful in explaining high-cost situations, when actors have a lot of time, knowledge, and can use computational means. Furthermore, involved actors have to have rather clear and consistent preferences, and the important variables have to be quantifiable and comparable. Firms, for instance, can take their time and invest resources in finding out about different, possible alternatives for investing in different markets and then decide on the strategy that yields the highest expected return, all in terms of money. In these cases, utility maximization is a sound tool that can be used in models, because it is easy to formalize. However, even companies may use heuristics when decisions have to be made in very uncertain and complex situations, when investments are made in innovative products.

    3.3
    However, as has been shown multiple times, the RAP fails to explain many day-to-day observations as well as experimental evidence. This is only partly due to the difference of these low-cost situations. People simply do not have a lot of time and computational capabilities for most of their decisions. They use habits, when they face familiar situations, and often they act on emotions, when the situation is new. Additionally, almost always the prerequisites are not met. Preferences are not usually consistent, and quantifiable; knowledge is incomplete; etc. (See Diekmann and Preisendörfer 2001, p. 68 and Newig 2003 about high-cost and low-cost situations.)

    3.4
    The RAP model starts to be enriched by psychological and social theory to overcome these explanatory shortcomings. (e.g. Kahneman and Tversky 2000) The basic underlying assumption and ideal is in general retained: humans behave in a selfishly rational and optimizing way. However, it has been shown in many studies, that in order to capture realistic human behaviour we have to view selfishness and optimization as possible behavioural traits among others.

    3.5
    By viewing the RAP as only one alternative among different human behaviours it is possible for us to draw on this theory where appropriate and extend and complement even replace it where necessary. This is the path of a pluralistic approach to describing human behaviour. This path is justified by the described shortcomings of the dominant model and the increasing need to model human behaviour in any number of situations. This need is reflected by the emergence of integrated assessment as a discipline (cf. Pahl-Wostl 2002).

    3.6
    Behaviour depends on the context of the decision environment. The most obvious example is the difference between day-to-day situations, like buying toothpaste, and important, novel, and single decisions, like buying a house. On the other hand, behaviour also varies with the diversity of humans themselves. In order to be able to implement non-liniearities and self-organizational processes, we need to be able to implement diverse human behaviour in one model. Agent-based modelling is a suitable tool to do so. But where do we find evidence for this multitude?

    Table 1: Comparison of experiments, case studies and statistical mass surveys

      Experiments Case Studies Statistical Mass Surveys
    Comparability / 
    Control of setting
    high low medium to high
    Representativeness medium 
    (biased sample)
    medium 
    (unique situation)
    high
    Realism / 
    realistical context
    low high medium
    Repeatability high low high
    direct observability 
    of social interactions
    high medium low

    3.7
    Data may be derived from observations drawn from experiments, case studies, or mass surveys. Table 1 summarizes advantages and disadvantages of the three approaches. Since we are interested in deviations from average behaviour, the statistical approach does not provide appropriate information for our problem. We note that the remaining two approaches are complementary in their strengths and weaknesses. Hence a sound strategy should aim at combining both.

    3.8
    Case studies analyze human actions in a given real world context. They are very useful for explaining certain actions in certain situations. They also help to support a theory about the interrelations of a given problem. However, they do not in themselves give generalizable insights into human behaviour, because every case is unique. Inductive reasoning still depends highly on the underlying theory. Therefore empirical evidence derived from case studies can be only one side of our research programme.

    3.9
    Experimental economics is a way of getting experimental rather than empirical data. This has the advantage of repeatability, comparability and statistical evaluation. Recently, a number of such laboratory experiments have been conducted with the objective to prove the limits of the rational model. They focus on different aspects of cooperative behaviour. The experimental setting makes assertions replicable to some extent. By focusing on a few simple games (for example prisoner's dilemma, common pool resource games, ultimatum and dictator games) the experimental evidence becomes comparable between different experiments. Comparability enlargens the data base considerably. Single experiments can only include about 100 subjects, mostly these are undergraduate economics students of a single university, so they form a biased sample. Only some studies deal with comparison between different cultural biases, for instance Henrich et al. (2001). A further constraint is that usualy only one or two aspects are covered, for instance the influence of anonymity (Burnham 2000) or sequencing (Andreoni, Brown, and Vesterlund 2002). Together those different studies constitute a comprehensive data base on the topic of deviations from the RAP under different, simple game settings.

    There is a small body of related research labled "Parallel Experiments with Real and Computational Agents" by Tesfatsion (2002, p.16). There are a few economical studies that deal with both, experimental settings with human subjects and parallel experiments with computational agents. However, with the exception of Duffy (2001) these do not try to capture individual human behaviour, but rather have (boundedly) rational computational agents evolve over time to show or explain the observed aggregated behaviour of the human subjects. Learning is usually implemented as a genetic algorithm. (For example see Pingle and Tesfatsion 2001, Andreoni and Miller 1995).

    3.10
    Duffy (2001) explicitly models individual, heterogenous behaviour. He uses "hypothetical reinforcement" learning and diverse agents to reproduce an experiment that is based on the Kiyotaki-Wright trading model. The agent based simulation is then used to design further settings for laboratory experiments. By this the simulation results can be compared with experimental studies that were done only after the simulation runs. In another interesting study Deadman and Schlager 2002 use experimental learning, but also do not try to reproduce individual decision making of their experimental subjects. These kinds of models reproduce actual human behaviour better than RAP. However, they focus on only one single economic aspect, that has been covered by the parallel experiment. In contrast, our model aims at reproducing diverse, individual behaviour at an abstract level so that findings from one experiment can be used to explain those of other experiments, of case studies, and eventually also behaviour in everyday situations.

    3.11
    Of course, the explanatory power of simple game settings like those of laboratory experiments has to be mistrusted in respect to day-to-day situations. But this is exactly the gap that our modelling approach may help to bridge. The data base composed of data from multiple controlled experiments contains the inhomogenous human behaviour in simple environments. This is a fitting starting point for our model. By taking many of these experimental studies into account we build a model of diverse human actions in diverse environments. We plan to test this model against empirical data taken from case studies and reconcile it with this data. By comparing the two different approaches, not only by the results, but also by the information needed to construct a model, we expect to gain valuable information on human behaviour and decision theory.

    * First application

    Altruistic Punishment Experiment

    4.1
    A first implementation of an adaptive toolbox was based on the data of the altruistic punishment experiment by Fehr and Gächter. The experiment is described in detail in (Fehr and Gächter 2002). Here only a brief summary is given.

    4.2
    240 participants played an anonymous common pool resource game in groups of four. 12 of these games were played in a row. Participants did not meet each other more than twice. Six of the games are played as simple common pool resource games. The participants received 20 money units of assets and could contribute between 0 and 20 money units to a common project. The common investment of the four participants was increased by the experimentor by 60% and divided evenly among the four. Hence, free riders who did not invest into the common project received nevertheless an equal share from the common pool including profits and investement made by other players. The other six games were also common pool resource games, but now with a subsequent possibility to punish players for their investment decisions. For every 1 money units (between 0 and 10) invested in the punishment, the punished player had to pay 3 money units. There have been two experimental settings, each with 120 participants, devided into five groups of 24 subjects for each experimental session. One started with six games with the possibility to punish and concluded with six games without punishment. This will be referred to as setting A. The other setting started without the possibility to punish and concluded with punishment. This will be referred to as setting B.

    Table 2: Experimental design

    Round 1 2 3 4 5 6 7 8 9 10 11 12  
    Setting A CPR P CPR P CPR P CPR P CPR P CPR P CPR CPR CPR CPR CPR CPR 5 groups of 24 subjects
    Setting B CPR CPR CPR CPR CPR CPR CPR P CPR P CPR P CPR P CPR P CPR P 5 groups of 24 subjects

    4.3
    Survey of experimental results following Fehr and Gächter (2002):
    • Common investment increases during games with the opportunity to punish and decreases without.
    • With an average investment of about ten in the first games without punishment, the participants' behaviour is far from the prediction of 0 expected for rational behaviour.
    • Almost every participant contributed more in games with punishment than in games without.
    • In the first games with punishment (game 1 in setting A and game 7 in setting B) the contribution was higher than in the first games without punishment. The punishment threat effectively increases investment.
    • Although it is costly, punishment does occur quite frequently and it is correlated to the deviation from the mean investment by the punished player.
    • Punished subjects usually increased their contribution in the next game. So, not only the punishment threat but also actual punishment increases investment.
    • In games with punishment, the highest return was received by those players who contributed an amount close to the average investment.

    Data analysis

    4.4
    Analysis of the aggregated data does not give us clues about the individual decisions over time and reactions to behaviour of other participanrs by the subjects of the experiment. Thus, we analysed individual data rows to find out about how decisions were altered in reaction to previous experiences. However, we did only analyse data rows of setting B. Our main working hypothesis is that most of the participants tried to invest close to the mean investment, neither defecting nor being the succer for others to exploit.

    4.5
    The observed aggregated behaviour over time can not be explained by assuming only one average strategy. Expectations decrease as the investment level decreases during games without punishment. Therefore, there have to be participants who constantly contributed less than the average. On the other hand, in games with punishment there have to be participants who contributed more than average and thus lead to an increase in expectations and, consequently, also in investment. This theoretical reasoning is supported by an analysis of individual data.

    4.6
    First of all distribution of investment decisions in the first round has peaks at 0, 10 and 20 with lesser peaks at 5, 8 and 15. Mean investment is 10.52. At least three classes of "strategies" can be observed in the individual behaviour. By "strategy" we mean the way in which the investment decision is reached, not the investment decision itself. This corresponds to the notion of decision heuristic. (The possibilities are known as contributing 0 to 20 money units, so no search and stopping heuristics are needed). One extreme is permanent defection throughout the games without punishment (maximizing strategy), the other is permanent cooperation (cooperative strategy). In between are participants who change their contribution, presumably according to the recently made experiences (reciprocal strategy). We believe that participants who play reciprocal strategy were trying to contribute close to the expected mean contribution.

    4.7
    Apparently, there are also participants who start out as cooperators or defectors and change to reciprocal behaviour after a number of games and vice versa. Strategy changes can also be seen as based on heuristics, in this case triggered by cues. The following cues for strategy changes have been ascertained from data series of individual participants and their experiences in the game in setting B:

    4.8
    Cues for strategy changes:
    • If common investment is much higher than expected, the tendency to switch from maximizing to reciprocal or from reciprocal to cooperative behaviour increases and vice versa with a low investment.
    • If a defector is the only defector the likeliness of defecting again decreases. The same is true for cooperators meeting cooperators. Likewise, if a cooperator encounters one, two or three defectors the willingness to cooperate decreases accordingly. The same is true for maximizers meeting cooperators. Also, reciprocalists may imitate behaviour, they encounter often.
    • If payoff of previous decisions has been higher than the recent payoff, the current strategy is questioned again. This cue is highly irrational in games where players do not meet each other again, though in other circumstances it might be useful.
    • If a decision leads to a lower payoff than the individual contribution, there is a strong force towards maximizing strategy.
    • Punishment may lead to reciprocal or cooperative behaviour in the following ways: Higher punishment than expected decreases certainty about maximizing strategies, while lower punishment increases it. A high number of punishers and a higher punishment than total gain in that round also decreases certainty about maximizing strategies
    These cues have been retrieved from data analysis by first classifying individual behaviour in the three strategies mentioned above. Then, changes in investment decisions were classified according to events that happened to the deciding person. We tried to find a reason for each drop or rise in the investment decision. Of course, only most of those changes can be explained by the cues listed above. Also, dependence of the height of the change to a corresponding cue could only be guessed. These dependencies would have to be determined in more detail by questionnaires.

    4.9
    There is probably more extensive reasoning involved. On the other hand, there seems to be also less reasoning involved. Some players seem to give 8 or 10 money units for a few rounds and then switch their behaviour to a higher or lower level, which they employ for another few rounds. Additionally, there is probably a good deal of "random" or "irrational" heuristics involved, that is not captured by these cues. An example for this is that some participants drop their investment level without a provocation in the sixth round (which they assumed to be the last game played). However, the above list of cues is supported by data and was implemented as heuristics.

    4.10
    In order to ascertain the motivation behind the punishment decisions, Fehr and Gächter had questionnaires filled out by the participants after the experiment. Their analysis of the questionnaires led to their deduction that anger is a major driving force for punishment acts and triggers a "willingness to punish" (Fehr and Gächter 2002, p. 139). By analysing individual data we could not find out more about why and when punishment occured than Fehr and Gächter already did (cf. Fehr and Gächter 2002, p. 139):
    1. Most punishment acts were done by cooperative players and imposed on defecting players.
    2. Both the frequency of punishment and the height of punishment seem to depend on the height of the defection of the punished player.
    3. Furthermore, punishment acts are expected by defecting players.

    Altruistic Punishment Model

    4.11
    Our implementation reproduces not only aggregated but also individual data of the experiment. Data analysis of individual behaviour lead us to the following assumptions as a basis for the model that are summarized in table 3. The assumptions are described in more detail below the table. With the terms "Agent" or "Player agent" we refer to the entities in our multi agent simulation. With "participants" or "humans" we mean the individuals who took part in the experiment.

    Table 3: Survey of important assumptions

    agents' cooperativeness c random variable between 0 and 1, normal distribution
    agents' "inclination to be annoyed" 
    and "willingness to punish"
    independent random variables between 0 and 1, normal distribution
    agents expectations about the others expected cooperativeness
    expected inclination to be annoyed
    expected willingness to punish
    higher expected common investment (cooperativeness) in games with punishment offset=0.15 (setting A) 
    offset=0.3 (setting B) 
    agents' strategies
  • maximizing strategy (c < 0.21) 
  • reciprocal strategy (0.21 < c < 0.68) 
  • cooperative strategy (c > 0.68)
  • strategy changes with cues
  • high/low common investment 
  • no defector/many defectors 
  • higher/lower payoff compared to previous games 
  • lower payoff than individual investment 
  • punishment 

  • 4.12
    Agents have individual inclinations to cooperate and punish. The first is implemented as one variable cooperativeness, the latter as two independent variables, one indicating the disposition to be annoyed at being cheated (inclination to be annoyed), the other defining the likeliness of spending money to punish a defector (willingness to punish). These two variables follow the analysis of Fehr and Gächter, who complemented their experiment by questionnaires (Fehr and Gächter 2002, p. 139). All three are float values between 0 and 1, 0 indicating no cooperativeness and 1 indicating a high cooperativeness (or respectively inclination to be annoyed, and willingness to punish).
    In our model the original distribution of cooperativeness is an equal distribution. This assumption is supported by the fact that the mean contribution in the first game without punishment is close to 10 and there are about as many participants giving 0 as there are giving 20. As mentioned above, the distribution in the experiment has peaks at 0, 10 and 20 with lesser peaks at 5, 8 and 15. This may be explained by prominence theory, which states that humans are much more likely to choose prominent numbers, like 1, 2, 5, 10, 20, ... (Albers 2001). However, this has not been modelled.

    4.13
    Inclination to be annoyed and willingness to punish are also distributed evenly. This has been decided due to a lack of knowledge of the actual distribution of those attributes in the human participants. In questionnaires participants stated that they would feel angry towards a defecting individual with increasing intensity corresponding to higher defection. They also expect anger when they were the defecting individuals. This is also reflected in the height of the punishment, which increases with the deviation from the group mean. However, the punishment patterns also differ between individuals. Therefore is seems logical to assume an equal distribution. The way, in which punishment decisions are made in the model is described below.

    4.14
    In addition to their own values for cooperativeness, inclination to be annoyed, and willingness to punish, each agent has a representation of the other agents' respective mean values, which indicates general belief about the others. They start out with believing the others to behave similar to themselves. However, their experiences alter the expectations, but not their own values (see the discussion of time scales in section 2). By this, agents learn by improving their beliefs about the social environment, but they do not alter their own "character". In pseudo code for every round the learning is:
    exp. cooperativeness = (1 - learning rate) * exp. cooperativeness + learning rate * investment
    

    Note: With learning rate = 0.5

    All agents believe the general contribution to be higher in games with punishment. This offset is 3 money units in setting A and 6 money units in setting B. These values have been taken from the aggregated data.

    4.15
    In our model, all agents have three strategies to choose from: maximizing, reciprocal and cooperative. In games without punishment maximizers contribute 0, cooperators contribute 15 to 20, depending on expectations, and reciprocal strategists invest the same amount of money, they expect others to contribute. Only maximizers change their "reasoning" in games with punishment, trying to calculate the lowest contribution that risks no (high) punishment. In fact, in games with punishment, the only difference in contribution between reciprocal strategists and maximizers is that maximizers may risk a slightly lower investment. Contribution close to the mean actually yields the highest return. This was also true in the original experiment (Fehr and Gächter 2002, p. 138).

    4.16
    In the following, the three strategies are described in pesudo code. Decisions are calculated as values between 0 and 1 and are later multiplied by 20 to give the number of money units that the player agent invests.


    Table 4: Strategy implementation

    Maximizing strategy
    for (0 .. numSteps) do {
    	decision += step
    	calculate outcome
    	for (all future games) do {
    		calculate expected outcome
    		outcome += expected outcome
    	}
    	if (outcome > maxOutcome) {
    		maxOutcome = outcome
    		remember decision
    	}
    }
    
    Note: Decisions are tried out and outcome is calculated. For this, the loop starts with an initial decision of 0 and increases it by a predefined step in this case 0.05 = 1 money unit. The last decision remembered is the decision that yields the highest expected outcome. The future games are the games that directly depend on this decision, like the "punishment game" after an "investment game".
    Reciprocal strategy
    decision = expected cooperativeness
    
     
    Cooperative strategy
    if (expected cooperativeness > 0.4)
    	decision = 1
    else
    	decision = 0.75
    
    Note: A decision value of 1 is a contribution of 20 money units and a decision of 0.75 is a contribution of 15 money units, which is the minimum that we identified as cooperative behaviour.

    4.17
    The initial strategy of each agent depends on its value for cooperativeness. The thresholds were taken from the data. Of the participants in setting B 21% used maximizing strategy, and 32% used cooperative strategy in their first game. Consequently, we used the thresholds of 0.21 and 0.68 as indicators for the starting strategy. That is, a cooperativeness below 0.21 leads to a maximizing strategy, above 0.68 to a cooperative strategy and in between to a reciprocal strategy.

    4.18
    It is important to note the difference between the strategy of an agent and its investment choice in a given game. The strategy is a heuristic and determines in which way the investment decision is made. The same contribution can be made by player agents employing different strategies. The way in which the strategies change according to experiences, can be seen as another form of strategy. In this case it is a heuristic that uses cues. This is the same for every agent. For example, in our model reciprocalists change their contribution according to their experiences because expectations change. However, strategy changes induced by experiences also occur and lead the reciprocalist to employ either cooperative or maximizing strategies. The contribution does not even have to change. For modelling strategy changes, in addition to the actual strategy employed, each agent has as certainty for using that strategy. Positive experiences and expected behaviour by other agents increase certainty, while negative experiences and unexpected behaviour decrease it. The implemented cues are described above. In addition, employing a strategy that corresponds to the agent's cooperativeness increases certainty, while non-compliance decreases it. With a low certainty the probability of a strategy change increases.

    4.19
    The cues for strategy changes are checked after every round, those involving punishment are checked for after punishment has been made. The above list is transformed into the following checklist and corresponding cue values, 0 (cue was not encountered), 1 (cue was encountered), or 2 or 3 (numDefectors, numCooperators, numPunishers):

    Table 5: Cues and cue values

    coopIsHigher
    if (investment > (expected cooperativeness + tolerance)
    	coopIsHigher = 1
    else
    	coopIsHigher = 0
    
     
    coopIsLower
    if (investment < expected cooperativeness - tolerance)
    	coopIsLower = 1
    else
    	coopIsLower = 0
    
     
    noDefectors
    if (number of (other) defectors = 0)
    	noDefectors = 1
    else
    	noDefectors = 0
    
     
    numDefectors
    numDefectors = number of (other) defectors
    
    Note: defined by investment ≤ 1 money unit
    noCooperators
    if (number of (other) cooperators = 0)
    	noCooperators = 1
    else
    	noCooperators = 0
    
     
    numCooperators
    numCooeprators = number of (other) cooperators
    
    Note: defined by investment ≥ 15
    profitIsHigher
    if (profit > last rounds profit + tolerance)
    	profitIsHigher = 1
    else
    	profitIsHigher = 0
    
     
    profitIsLower
    if (profit < last rounds profit - tolerance)
    	profitIsLower = 1
    else
    	profitIsLower = 0
    
     
    profitLtInvestment
    if (profit < my investment)
    	profitLtInvestment = 1
    else
    	profitLtInvestment = 0
    
     
    numPunishers
    numPunishers = number of punishers
    
    Note: player agents that punished this agent with any positive number
    punishmentIsHigher
    if (punishment > expected punishment + tolerance)
    	punishmentIsHigher = 1
    else
    	punishmentIsHigher = 0
    
     
    punishmentIsLower
    if (punishment < expected punishment - tolerance)
    	punishmentIsLower = 1
    else
    	punishmentIsLower = 0
    
     
    punishmentGtGain
    if (punishment cost > this rounds gain)
    	punishmentGtGain = 1
    else
    	punishmentGtGain = 0


    4.20
    For each employed strategy the influence of the cues is different. For example, if cooperation is higher than expected certainty about cooperative strategy is increased, but about reciprocal and maximizing strategy it is decreased. This is modelled as an array of parameters indicating for each of the three strategies the influence on the certainty about this strategy.

    Table 5: Multipliers for the different cues according to each strategy

      Maximizing Reciprocal Cooperative
    coopIsHigher -1 -1 2
    coopIsLower 1 -2 -2
    noDefectors -2 0 0
    numDefectors 1 -2 -2
    noCooperators 0 0 -2
    numCooperators 0 -1 0.5
    profitIsHigher 1 2 1
    profitIsLower -1 -1 -2
    profitLtInvestment 0 0 -1
    numPunishers -0.5 0 0
    punishmentIsHigher -1 0 0
    punishmentIsLower 1 0 0
    punishmentGtGain -1 0 0


    As you can see from the list, only maximizing strategy is influenced by the punishment cues. These parameters are used as multipliers for the cue values. The general procedure is:

    certainty = certainty * (1 + enforcement) * matching factor
    for (all cues)
    	certainty = certainty + (cue value * corresponding parameter * certainty step)
    if (certainty < certainty tolerance)
    	change strategy
    

    Notes:
  • matching factor is calculated by the following rules

    Table 7: Calculating the matching factor for strategies from agents' cooperativeness

    Maximizing Strategy 0.5 - cooperativeness Cooperativeness below 0.5 increases and above 0.5 decreases the agent's certainty about maximizing strategy.
    Reciprocal Strategy
    if (cooperativeness < 0.5)
    	(-0.5 + 2 * cooperativeness)
    else
    	(-0.5 + 2 * (1 - cooperativeness))
    
    Cooperativeness below 0.25 and above 0.75 decreases and between 0.25 and 0.72 increases the agent's certainty about reciprocal strategy.
    Cooperative Strategy ((-0.5) + cooperativeness) * 2 Cooperativeness below 0.5 decreases and above 0.5 increases the agent's certainty about cooperative strategy. This is doubled because cooperative strategy seems to depend more on conviction than the other strategies.

  • certainty step = 0.2
  • certainty tolerance = 0.4
  • From maximizing strategy and cooperative strategy any change leads to reciprocal strategy. From reciprocal strategy it depends on whether more cooperative or defecting cues have been encountered.

    4.21
    The multipliers and the step by which certainty is increased or decreased were first subject to logical reasoning and second to fitting the model to the data.

    4.22
    Another decision the agents have to make is the punishment decision. As has been mentioned above, player agents have an attribute for "inclination to be annoyed" and "willingness to punish". The corresponding heuristic involves not only those two attributes but also the height of the defection that is to be punished. We argue for two dependencies. First, the higher the player agents' inclination to be annoyed and the higher the defection, the more likely it is, that punishment occured. Second, the higher the player agents' willingness to punish and the higher the defection, the higher the punishment decision was. Furthermore, there was also punishment, that did not fall into the pattern, that cooperative players punished defecting players.

    4.23
    The punishment heuristic used in our model is given here in pseudo code:
    if (defection > 0.1)
    	angerlevel = annoyance + defection
    else
    	angerlevel = annoyance + defection - 0.8
    if (randomNumber < (2 * angerlevel))
    	punishDecision = (punishment + defection) / 2
    else
    	punishDecision = 0
    punishPoints = 10 * punishDecision
    

    Notes:
  • defection is the difference between the investment decision of the player agent in question and the mean of the other players, this is 0 if no defection occured. If there was no defection only irrational anger leads to a punishment decision. This can only happen, if the attribute inclination to be annoyed (plus a possible minimal defection) is bigger than 0.8, as indicated in the first else clause.
  • angerlevel is a test level for the random number, the higher the angerlevel, the greater the possibility that punishment actually occured.
  • annoyance is the punishing players inclination to be annoyed attribute.
  • punishment is the punishing players willingness to punish attribute.
  • punishDecision is the decision, how much to punish the player agent in question. This is still a number between 0 and 1.
  • punishPoints is the points that the punishing player agent decides to invest in the punishment. (The punishing players pays the number of points in money units and the punished player pays 3 times that amount.)
  • both the tolerance and the value for irrational anger were fitted, rather than taken from the data.

    4.24
    Our model of an adaptive toolbox is programmed as JAVA classes that use the agent based simulation environment Quicksilver (http://www.usf.uos.de/projects/quicksilver/). For further information about the model, the source code as well as an online version as JAVA applet, please refer to http://www.usf.uos.de/~eebenhoe/forschung/adaptivetoolbox.de.html.

    Results

    4.25
    With this implementation we have been able to reproduce both the aggregated and individual data provided by the altruistic punishment experiment by Fehr and Gächter.

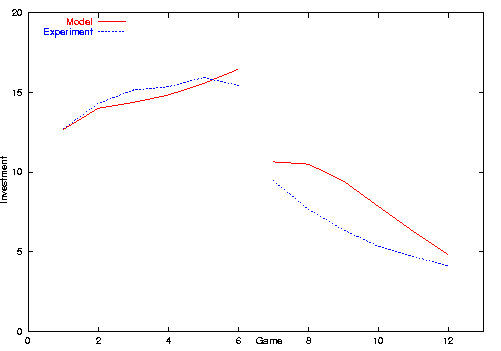
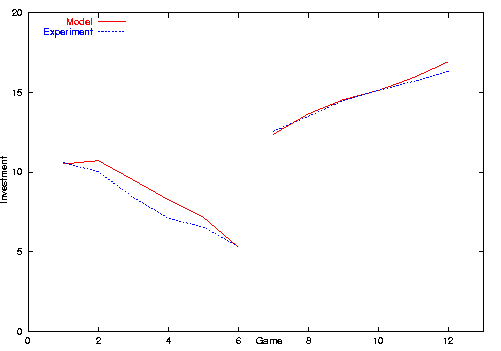
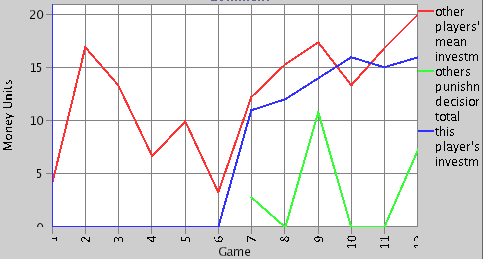
    We made model runs similar to the experimental setting, model run A starts with games with punishment (see figure 1) and model run B starts with games without punishment (see figure 2). Model runs have been conducted with 1200 player agents. We did not do model runs with only 24 agents because of a strong influence of the random number generator. Even in runs with 120 players the mean investment usually deviates considerably from the mean investment of the experiment, in some cases not even the trend was reproduced. In fact, this effect is interesting and needs to be analyzed in more detail. We believe that the higher variance is due to the lack of prior knowledge of our agents compared to the experiment's participants.

    Mean investment in the experiment and model setting A
    Figure 1. Mean investment in the experiment and model setting A

    Mean investment in the
experiment and model setting B
    Figure 2. Mean investment in the experiment and model setting B

    4.26
    Only individual data of the experimental setting B was used for calibrating the model. As can be seen in figure 2, the data from setting A are not reproduced as well. In setting B the variance of the twelve data points of the model run from those of the eyperiment is 0.38. In setting A, however, the variance is 2.51. This strong deviation may be explained by two reasons. The first reason is the drop of investment level in the sixth investment game. Some participants defect in that game because they think it is the last one. Whether or not they expect others not to punish in the last game or simply take their chance, would have to be ascertained by questionnaires. The second reason may be that some participants are angry at having been punished in previous games and therefore the aggregated level of investment is lower than in setting B without punishment. Integrating these two aspects in the model leads to figure 3, which shows a better reproduction of the experimental data than figure 1. For this altered setting A the variance is 0.61.
  • For the last round effect all agents expected cooperativeness was reduced by lastGameOffset = 0.1. This value corresponds roughly to the data. This could have been modelled as an individual trait of agents, because it seemed to be only some participants, who defect without provocation in the last round. However, so far we needed this parameter to be easily accessible and changeable.
  • To incorporate increased anger due to previous punishment we increased the percent of player agents employing maximizig strategy from 21% to 23%.

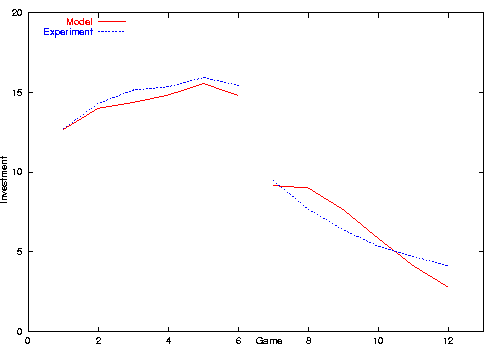
    Another difference is that mean punishment in the model is higher than in the experiment (1.07 compared to 0.73 mean punishment decision in setting A). The reason for this may be that participants were more risk avers than agents.

    Mean investment in the experiment and modified model
setting A
    Figure 3. Mean investment in the experiment and modified model setting A

    4.27
    Reproduction of individual data is harder to prove. The reason for this is path dependency of individual data. Decisions to increase or decrease investment depend on recent experiences and those are different for every player. However, a few examples of participants' and agents' decisions in setting B are given. As two examples for truly cooperative behaviour see figures 4 and 5 for a participant of the experiment and an agent from the simulation respectively.

    Example of a cooperative participant
    Figure 4. Mean investment in the experiment and modified model setting A

    Example of a cooperative agent from the
simulation
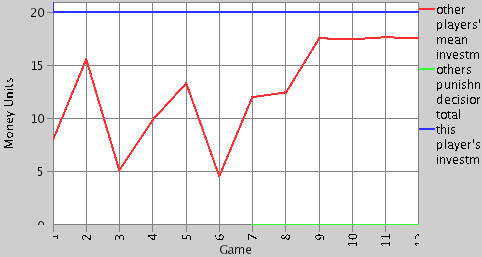
    Figure 5. Example of a cooperative agent from the simulation

    4.28
    Examples for reciprocal behaviour alternating with maximizing decisions are given in figures 6 and 7. Note that the participant's and agent's investment is influenced strongly by the experience made in the prior game.

    Example of a reciprocal participant
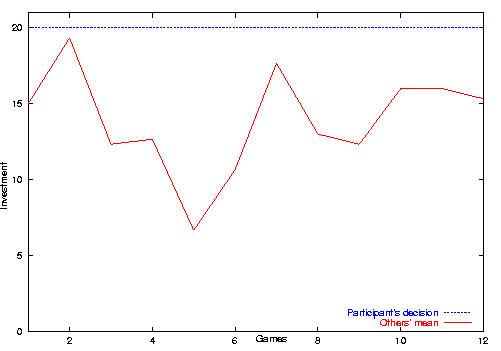
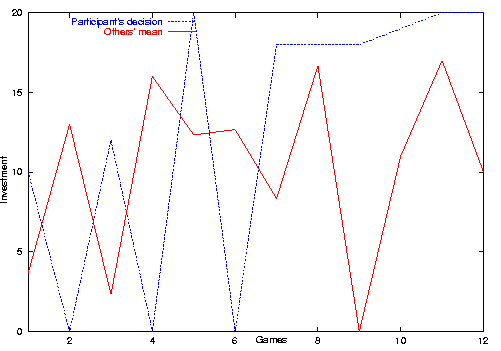
    Figure 6. Example of a reciprocal participant

    Example of a reciprocal agent from the simulation
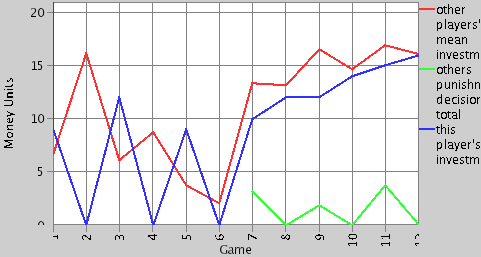
    Figure 7. Example of a reciprocal agent from the simulation

    4.29
    The participant from figure 8 and the agent from figure 9 start out as maximizers and are forced to invest more in the games with punishment.

    Example of a maximizing participant of the original
experiment
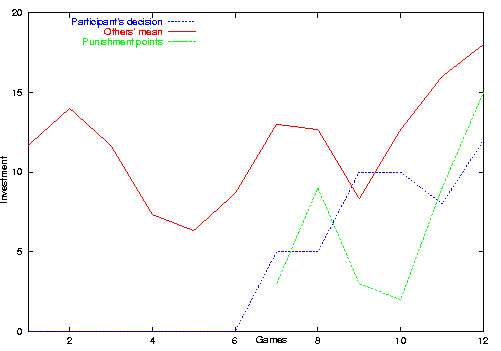
    Figure 8. Example of a maximizing participant of the original experiment

    Example of a maximizing agent from the simulation
    Figure 9. Example of a maximizing agent from the simulation

    4.30
    In addition to model runs that are similar to the experiment, we also made longer test runs (see figure 10). Results are that it takes about 12 rounds for almost every agent to invest 20 money units in games with punishment and 0 money units in games without punishment. Interestingly, homogenous investment decisions are possible with different, co-existing strategies. In games without punishment more than 10% of the agents still use reciprocal strategy, but since they expect others to invest nothing, they also do not invest. In games with punishment the setting allows for all three strategies to co-exist. About 60% of the agents are cooperators, about 20% are reciprocalists that invest close to 20 money units because they expect others to contribute that much, and another 20% are maximizers, who contribute about 19 money units, because they want to avoid punishment.

    Mean investment in the long run with and without punishment
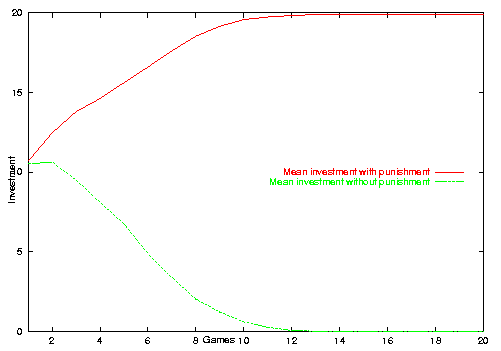
    Figure 10. Mean investment in the long run with and without punishment

    4.31
    Learning and strategy changes are crucial for model behaviour. Learning rates and, to a lesser extent, the importance of cues are very sensitive parameters. However, from data alone, we could retrieve only limited and unreliable information about these aspects. With questionnaires in addition to the experiment these questions could be addressed more thouroughly.
  • * Discussion

    5.1
    In the previous section we have shown that the altruistic punishment model reproduces the experiment's data quite well. But we have not yet discussed how it fits into the concept of an adaptive toolbox. The adaptive toolbox is based on three principles: psychological plausibility, domain specificity, and ecological rationality. By analysing data of individual participants we captured the actual, individual behaviour, both for the game decision and the reactions to the other participants' actions. For the implementation this behaviour was classified into a set of behavioural types, distinguished by an assumed cooperativeness. From this the actual strategies were derived. The agents' cooperativeness defined the preferred strategy. Strategies themselves were kept very simple. With the exception of the maximizing strategy, no calculation is done by the player agents. Domain specificity was ensured by linking decision strategies to the game setting. This is done by the implementation. That is, only strategies that fit to the game currently played may be used by the players. It is also done by deriving cues for strategy changes from the game setting. For this model, strategies and cues were predefined by the modeller. However, in principle the society of agents could learn in an evolutionary adaptation process, which strategies are possible and which cues are appropriate. Since our objective is to reproduce observed behaviour, we did not choose that path. For this reason, ecological rationality came only from data analysis and not through an evolutionary process.

    5.2
    Decision making within the adaptive toolbox is done by heuristics that are comprised of simple building blocks, so that they can be applied to different kinds of decision environments. As outlined in section 2, heuristics are either search rules, stopping rules, or decision rules. In the model player agents chose from a predefined set of strategies. The strategies define not the actual decision, but how the decision is made. That is, they refer to the choice between different solutions. The way in which the choice between strategies is made, is also implemented as heuristics, in this case, checking for cues. Certain cues indicate for player agents that the strategy employed is not appropriate. These cues induce strategy changes. However, new stratgies are not (yet) searched for by agents. Another feature not yet implemented is an evolutionary adaptation process. Adaptation takes place to some extent, but is restricted to learning processes about the social environment.

    5.3
    We have started to derive hypotheses about human behaviour from an economic experiment. By classifying behavioural types it was possible to implement an agent based model to represent data of the experiment. This was done as a first module of an adaptive toolbox that is to be expanded in the near future (see Prospects and Conclusion). The model is derived from individual rather than aggregated behaviour. By this the idea of an adaptive toolbox has the potential to integrate different coexisting representations of human decision making in agent based models. At the same time it also provides us with a framework for modelling the behaviour and for comparing different settings.

    5.4
    However, our current approach has some limitations. Experimental economics focuses on a constrained set of behavioural patterns and considers mainly extrinsic motivation for behaviour. Optimization of a utility function is always triggered externally. Furthermore, in economic games all context is removed. However, it is evident from the results that people respond to emotions, so they also have intrinsic motivation. This psychological aspect is very hard to capture in games. In the case of the altruistic puishment experiment, anger was ascertained as major driving force behind punishment decisions. However, this was only possible through corresponding questionnaires. In addition, all people will enter the game with a personality shaped by previous experience. They will change their strategies but not their personalities during a gaming session.

    5.5
    The model can not cover the multitude of behavioural patterns of all the participants. Classifications have the advantage of emphasizing some aspects and general patterns, but always will lessen the variety. Additionally, the interpretation of the individual data, what reasons there were for behaving in that way or another, depends on the modeller.

    * Prospects and conclusion

    6.1
    The heuristics explored in this paper focus on what determines the willingness of individuals to cooperate and the development of trust in a group. It is assumed that individuals are characterized by their cooperativeness which may be determined by individual character, individual experience and the cultural context. Nooteboom (2002) suggested quite a useful conceptual framwork for sources of cooperation that incorporates many elements and intuitions from literature. Table 8 summarizes the main points. One can make a distinction between macro and micro sources and between egotistic and altruistic sources.

    Table 8: Sources of intentional reliability (cf. Nooteboom 2002, p. 9)

      Macro Micro
    Egotistic  Sanctions from authority or contractual obligation with enforcement Material advantage or self-interest
    Altruistic Ethics: values and social norms of proper conduct, moral obligations Friendship, kinship, routines, empathy

    This framework is a good base to structure future observations from both empirical and modelling studies. An individual's cooperativeness determines his/her expectations about the behaviour of other players and individual and social learning effects may occur on different time scales. The work reported in this paper provides a start to compile a more comprehensive knowledge base.

    6.2
    We also need to compare insights from the model with theoretical approaches. For instance, cooperativeness was simply modelled as an equally distributed random variable, it might have been modelled as a combination of two variables, individualism and altruism, as proposed by Social Value Orientation (as in Jager and Janssen 2002). Important questions to answer in this comparison between our model and a social value orientation model are: In what way do the results differ? How do investment choices depend on individualism and altruism versus cooperativeness? Does the value orientation of an agent determine, what cues for strategy changes are important to it? How may punishment acts be explained by Social Value Orientation? The last question is important because Fehr and Gächter found that most punishing acts were done by participants who invested more than average. However, following Social Value Orientation theory this should not be the case. Apparantly, there is another aspect, namely anger, involved in that decision.

    6.3
    In order to answer these questions it is necessary to find out about the individual value orientation of the participants by looking at the individual data. One might assume that the classifications of cooperative, reciprocal, and maximizing participants would be the same as a Social Value Orientation classification of cooperative, individualistic, and competitive. This prediction is in line with McClintock and Liebrand, who found that the choices of individualistic players were the most variable ones among those three classes (cf. McClintock and Liebrand 1988, p. 407). If the classification was the same, the outcome would likely be the same also, only the representation of cooperativeness in the model would differ. For this experiment we did not need to distinguish between individualistic and altruistic behaviour. For other experiments this might very well be necessary.

    6.4
    The altruistic punishment model is a first step towards an adaptive toolbox that should be comprised of many different modules. For this reason the next logical step is to extend the toolbox by more models of other experimental games. By this it will become possible to compare the validity of the assumptions made to other findings. This work is currently in progress.

    6.5
    A second step after the extension of the adaptive toolbox is to compare the insights with results from case studies. The question arises whether data from case studies deviate considerably from results in experimental settings. And, if so, what are the main differences?

    6.6
    Major differences, already pointed out, are context dependency and a longer time scale. Short term behaviour may be typically relevant in negotiation processes. However, in case studies we are interested in particular in long-term changes. In our model, these would refer to changes in the individual types, e.g. the attitude to be cooperative. This implies that the incentive for behaviour shifts from extrinsic motivation by sanctions through punishment to intrinsic motivation by the internalization of social norms about socially acceptable behaviour and about a behaviour that leads to an acceptable pay-off in a certain social environment. Hardly any individual is cooperative to an extent to be continuously exploited by others.
    Thus, on this longer time scale institutions as another major influence on human behaviour become relevant. Numerous studies have shown evidence for the importance of institutions shaping human nature (Held and Nutzinger 1999). Hence it will be of interest to explore systematic differences determined by culture and institutional contexts. In these cases more important information can be derived from stakeholder interviews than from experimental settings.

    6.7
    Of course, human behaviour will always remain unpredictable to some extent. Nevertheless for modelling purposes we want to improve our understanding and the representation of how people behave.

    6.8
    Our approach to represent human behaviour by extracting regularities from observations leads to a modelling framework that allows for different approaches to human decision making.

    * Acknowledgements

    We like to thank Ernst Fehr and Simon Gächter for kindly providing us with the data of their altruistic punishment experiment.

    * References

    ALBERS W (2001) Prominence Theory as a tool to Model Boundedly Rational Decisions. In Gigerenzer G and Selten R Bounded Rationality. The Adaptive Toolbox. Cambridge, Massachusetts: The MIT Press, pp. 297-317

    ANDREONI J and Miller J H (1995) Auctions with Artifical Adaptive Agents. Games and Economic behaviour 10, pp. 39-64

    ANDREONI J, Brown P M and Vesterlund L (2002) What Makes an Allocation Fair? Some Experimental Evidence. Games and Economic behaviour 40, pp. 1-24

    BISSEY M-E and Ortona G (2002) The Integration of Defectors in a Cooperative Setting. Journal of Artificial Societies and Social Simulation 5, 2 https://www.jasss.org/5/2/2.html

    BRENNER T (1999) Cognitive Learning in Prisoner's Dilemma Situations. Computational techniques for modelling learning in economics. Boston: Kluwer, pp. 333-361

    BURNHAM T C (2000) Engineering altruism: a theoretical and experimental investigation of anonymity and gift giving. Journal of Economic behaviour & Organization 50, pp. 133-144

    DEADMAN P J, Schlager E and Gimblett, R (2000) Simulating Common Pool Resource Management Experiments with Adaptive Agents Employing Alternate Communication Routines. Journal of Artificial Societies and Social Simulation 3, 2. https://www.jasss.org/3/2/2.html.

    DEADMAN P J and Schlager E (2002) Models of Individual Decision Making in Agent-Based Simulation of Common-Pool-Resource Management Institutions. Integration Geographic Information Systems and Agent-Based Modelling Techniques for Simulating Social and Ecological Processes. Oxford: Oxford Univ. Press, pp. 137-169

    DEFFUANT G, Amblard F, Weisbuch G, and Faure T (2002) How can extremism prevail? A study based on the relative agreement interaction model. Journal of Artificial Societies and Social Simulation 5, no. 4 <https://www.jasss.org/5/4/1.html>

    DEFFUANT G, Weisbuch G, Amblard F, and Faure T (2003) 'Simple is beautiful ... and necessary' Journal of Artificial Societies and Social Simulation 6, no. 1. <https://www.jasss.org/6/1/6.html>

    DIEKMANN A and Preisendörfer P (2001) Umweltsoziologie. Eine Einführung. Reinbeck: rohwolts enzyklopädie

    DUFFY J (2001) Learning to speculate: Experiments with artificial and real agents. Journal of Economic Dynamics and Control 25, pp. 295-319

    EPSTEIN J M and Axtell R (1995) Growing artificial societies: Social Science from the Bottom Up. Washington: Brookings Institution Press/MIT Press Cambridge, MA.

    FEHR E and Gächter S (2002) Altruistic punishment in humans. Nature. 415, pp. 137-140

    GIGERENZER G and Selten R (2001) Bounded Rationality. The Adaptive Toolbox. Cambridge, Massachusetts: The MIT Press.

    GIGERENZER G (2001) The Adaptive Toolbox. In Gigerenzer G and Selten R Bounded Rationality. The Adaptive Toolbox. Cambridge, Massachusetts: The MIT Press, pp. 37-50

    HARE M and Pahl-Wostl C. 2001. Model uncertainty derived from choice of agent rationality - a lesson for policy assessment modelling. In N. Giambiasi and C. Frydman, (eds.) Simulation in Industry: 13th European Simulation Symposium. SCS Europe Bvba, Ghent. pp 854-859.

    HAYASHI N, Ostrom E, Walker J, and Yamagishi T (1999) Reciprocity, Trust and the Sense of Control: A cross-societal Study. Rationality and Society 11 pp. 27-46.

    HELD M. and Nutzinger H.G. eds. (1999) Institutions shape human beings - human beings shape institutions. (in German: Institutionen prägen Menschen - Menschen prägen Institutionen). Campus Verlag, Frankfurt/Main.

    HENRICH J et al. (2001) In Search of Homo Economicus: behavioural Experiments in 15 Small-Scale Societies. American Economic Review 91 pp. 73-78

    JAGER W, Janssen M A, De Vries H J M, De Greef J and Vlek C A J (2000) Behaviour in commons dilemmas: Homo economicus and Homo psychologicus in an ecological-economic model. Ecological Economics 35, pp. 357-379.

    JAGER W, Janssen M A (2002) Using artificial agents to understand laboratory experiments of common pool resources with real agents. In Janssen M A Complexity and Ecosystme Management. The Theory and Practice of Multi-Agent Systems Edward Elgar, Cheltenham, UK, Northampton, MA, USA, pp. 75-102

    KAHNEMAN D and Tversky A eds. (2000) Choices, values and frames. Cambridge University Press, Cambridge, MA.

    KOTTONAU J (2002) Simulating the Formation and Change of the Strength of Political Attitudes Diss. Eth No. 14664, Swiss Federat Institute of Technology Zurich

    LINDENBERG S (1991) Die Methode der abnehmenden Abstraktion: Theoriegesteuerte Analyse und empirischer Gehalt. In Esser H and Troitzsch K (ed.) Modellierung sozialer Prozesse. Bonn: Informationszentrum Sozialwissenschaften, pp. 29-78

    McCLINTOCK C and Liebrand W (1988) Role of Interdependence Structure, Individual Value Orientation, and Another's Strategy in Social Decision Making: A Transformational Analysis. Journal of Personality and Social Psychology 1988, Vol. 55, No. 3, 396-409

    NEWIG J (2003) Symbolische Umweltgesetzgebung. Rechtssoziologische Untersuchungen am Beispiel des Ozongesetzes, des Kreislaufwirtschaft- und Abfallgesetzes sowie der Grofeuerungsanlagenverordnung. Schriften zur Rechtssoziologie und Rechtstatsachenforschung. Berlin, Duncker & Humblot.

    NOOTEBOOM B (2002) Trust: Forms, Foundations, Functions, Failures and Figures. Edward Elgar, Cheltenham, UK.

    OSTROM E (2000) Collective Action and the Evolution of Social Norms. Journal of Economic Perspectives 14, pp. 137-158.

    PAHL-WOSTL C (2002) Participative and Stakeholder-based policy design, evaluation and modeling processes. Integrated Assessment 3, pp. 3-14

    PINGLE M and Tesfatsion L (2001) Non-Employment Benefits and the Evolution of Worker-Employer Cooperation: Experiments with Real and Computational Agents. ISU Economic Report No. 55 <http://www.econ.iastate.edu/tesfatsi/sce2001.pdf>

    TESFATSION L (2002) Agent-Based Computational Economics: Growing Economies from the Bottom Up. ISU Economics Working Paper No. 1

    TODD P M and Gigerenzer G (2003) Bounding rationality to the world. Journal of Economic Psychology 24, pp. 143-165

    VON RANDOW G (2003) When the center becomes radical. Journal of Artificial Societies and Social Simulation 6, no. 1. <https://www.jasss.org/6/1/5.html>

    ----

    ButtonReturn to Contents of this issue

    © Copyright Journal of Artificial Societies and Social Simulation, [2003]