
Introduction
Flooding is the most expensive natural disaster worldwide. Flooding can occur in various forms, such as coastal, river and surface water flooding (sometimes known as ‘urban’ or ‘storm water’ flooding). Surface water flooding occurs when an urban area floods during heavy rainfall as a result of a combination of factors, including rainwater not infiltrating the ground and the overflowing of sewers, drainage and small watercourses (European Water Association 2009; Falconer et al. 2009).
Flooding is listed as a major risk on England’s National Risk Register, with properties more likely to be affected by repeated surface water flooding then coastal or river flooding, with estimated annual costs of £1.3bn to £2.2bn (Defra 2011). In England the consequences of surface water flooding were brought to the forefront by the summer floods of 2007. The Pitt Review (Pitt 2008), which was conducted to provide lessons and recommendations in the aftermath of the 2007 summer floods, highlighted major gaps in the understanding and management of risks from surface water flooding and emphasised the need for urgent and fundamental changes in the way the UK is adapting to the likelihood of more frequent and intense periods of heavy rainfall, particularly given the impact that climate change would have on the probability of similar events in the future.
Findings presented in the UK Climate Projections (UKCP09) show that as a result of climate change the UK weather in the upcoming century will be characterized by more days of extreme precipitation during the winter and summer period (IPCC 2013). These changing precipitation patterns are expected to result in an increase in surface water flood events in the UK (Ramsbottom, Sayers & Panzeri 2012). Combined with an increasing pattern of urbanisation Defra estimated that damages from surface water flooding could increase by 60-220% over the next 50 years (Adaptation Sub-Committee 2012).
Flood risk emerges from the interplay between biophysical and human factors (Hall et al. 2003b). Biophysical factors determine the frequency, duration and intensity of rainfall, and the runoff that occurs when rain hits the ground. Rainfall may be infiltrated into the ground, but in urban areas with impermeable surfaces will flow on the surface in directions modified by the form of buildings and streets and will accumulate at locations with low topographical elevation. These processes are modified by drains that are designed to convey water away from urban areas on the surface or in pipes (Blanc et al. 2012). The severity of damage that occurs during a surface water flood depends upon the location and value of properties in an urban area and their sensitivity to flood damage. The amount of damage that occurs may be reduced by installing Property-level Protection Measures (PLPMs) that prevent water from entering buildings or reduce the costs of repair, as well as by flood defences and sustainable drainage systems (SUDS) designed to protect entire communities.
Flood insurance helps to ensure that insurance policy-holders do not incur disastrous financial losses during floods. It redistributes losses across the pool of policy-holders and through time. Typically, a householder will pay an annual premium. The cost of repair of flood damage will be reimbursed by the insurance scheme, less some pre-agreed threshold sum (an ‘excess’, or ‘deductible’). Flood insurance arrangements, where they exist at all, differ widely around the world, with varying levels of public and private involvement in the insurance market (Botzen and Van Den Bergh 2008). In recent years, flood insurance has been provided in the UK via a public-private partnership between the UK government and the insurance industry, known as the Statement of Principles. Private insurers provide flood insurance to both households and small business up to a certain level of risk, while the government commits to investing in flood defences for the higher risk areas. However, with the increase in frequency and extent of flooding there was a need within the UK for a continued, but redefined, public-private partnership. If no action was taken then it raised the issue of affordability and availability of insurance as high flood risk properties could face increasing premiums, potentially to unaffordable levels, or the refusal of cover altogether (Penning-Rowsell, Priest & Johnson 2014).
In the summer of 2013 the government proposed a new flood insurance scheme, Flood Re, due to be in operation from April 2016. The Flood Re scheme is a non-profit flood reinsurance fund that gives insurers the option to re-insure the highest risk properties. The subsidy for Flood Re is to be claimed from a levy taken from all policyholders and imposed on the insurers according to their market share, with policy-holder premiums fixed dependent on the council tax band of the property insured. The aim of this proposed system is to create a roadmap to future affordability and availability of flood insurance without placing unsustainable costs on wider policy holders and the taxpayer (Defra 2013). Flood Re is proposed as a transitional solution, with an anticipated run time of 25 years, helping to smooth the transition to more risk-based pricing in the future. However, concerns have arisen over the financial sustainability of the scheme given that costs will remain higher than benefits delivered (Defra 2013). Secondly, Flood Re is not designed with risk reduction in mind, and it offers no incentives or formal mechanisms to encourage household level flood risk reduction (Surminski & Eldridge 2015). Similarly, implications of the scheme, and potential negative and positive feedbacks, have not been considered in parallel with other flood risk management interventions, including those targeted at surface water flooding.
This gap is the starting point of our investigation. Analysing the outcomes of such insurance reform requires a model that can simulate the dynamics of flooding and the choices made by economic agents. Typically flood risk is calculated using static data on properties at risk and the damage that will occur during a flood (Hall et al. 2003a). However, such an approach does not address the distribution of losses across different householders and the role of insurance in redistributing those losses. Nor does it address the dynamics of householders’ locational choices and the ways in which those choices may be modified by flood risk and insurance availability (Dawson et al. 2011). In this paper we address these issues by proposing and demonstrating an agent-based model (ABM) designed to analyse changing flood risk and the role of insurance in this dynamic.
The agent-based model
ABMs have had limited application in the insurance sector to date and to the authors best knowledge no studies exist which are focus explicitly on the issue of surface water flooding. Ulbinaitė and Le Moullec (2010) and Ulbinaitė, Kučinskienė, and Le Moullec (2011) used an ABM to simulate consumer behaviour and insurance choices in general. Brouwers and Bomand (2011) developed an ABM which focused on fluvial flood risk and damage to private property for a case study of the Upper Tisza area in Hungary. The model considers how government, insurer, and property owner agents interact to investigate financial flood risk management policies. In particular, it investigates a baseline scenario where the government compensates property level flood damage and a market scenario where responsibility is shifted to the property owner.
Sobiech (2013) developed an ABM of coastal flooding in North Germany, focussed on simulating and exploring the dynamics of social vulnerability. The ABM was parametrised using survey data and included the perceptual and social context in which decisions are taken, and subjective and objective aspects that may influence self-protective behaviour and vulnerability of individuals. For risk research and management, it highlighted the importance of considering multiple factors within the vulnerability analysis, and the importance of doing so in a dynamic manner.
McNamara and Keeler (2013) highlight how such ABMs could be strengthened by linking behavioural and physical models. They present a study for the US East Coast linking a shoreline dynamics model and ABM of real-estate markets to investigate how people and the market respond to sea-level rise and storminess. The model combines adaptation in the form of coastal defences within both the physical and economic components of the model. Person agents make a cost-benefit based decision on whether to invest in defences, and to what level, as well as valuing property based on various criteria such as expected flood damage and flood insurance costs.
Filatova et al. (2009) and Filatova et al. (2011) used an ABM to look at the consequences of a lack of available flood insurance on flood risk and land markets, and built upon this to develop an empirical based ABM of an urban economic system focused on the housing market (Filatova 2015). This has been applied to a case study of North Carolina, USA, and includes flood risk in the decision making of household buyers, as well as consideration of potential flood damage and insurance premiums. Similarly, an ABM has been developed for a coastal town in New Jersey, USA, that looks at the effect of sea level rise and alternative flood insurance programs on household locational choices (Chandra-Putra et al. 2015). The ABM aims to capture some of the main features of the housing market driven by interactions between buyers and sellers; responses to flooding and alternative flood insurance policies; and implications of different government policies and the provision of flood risk information.
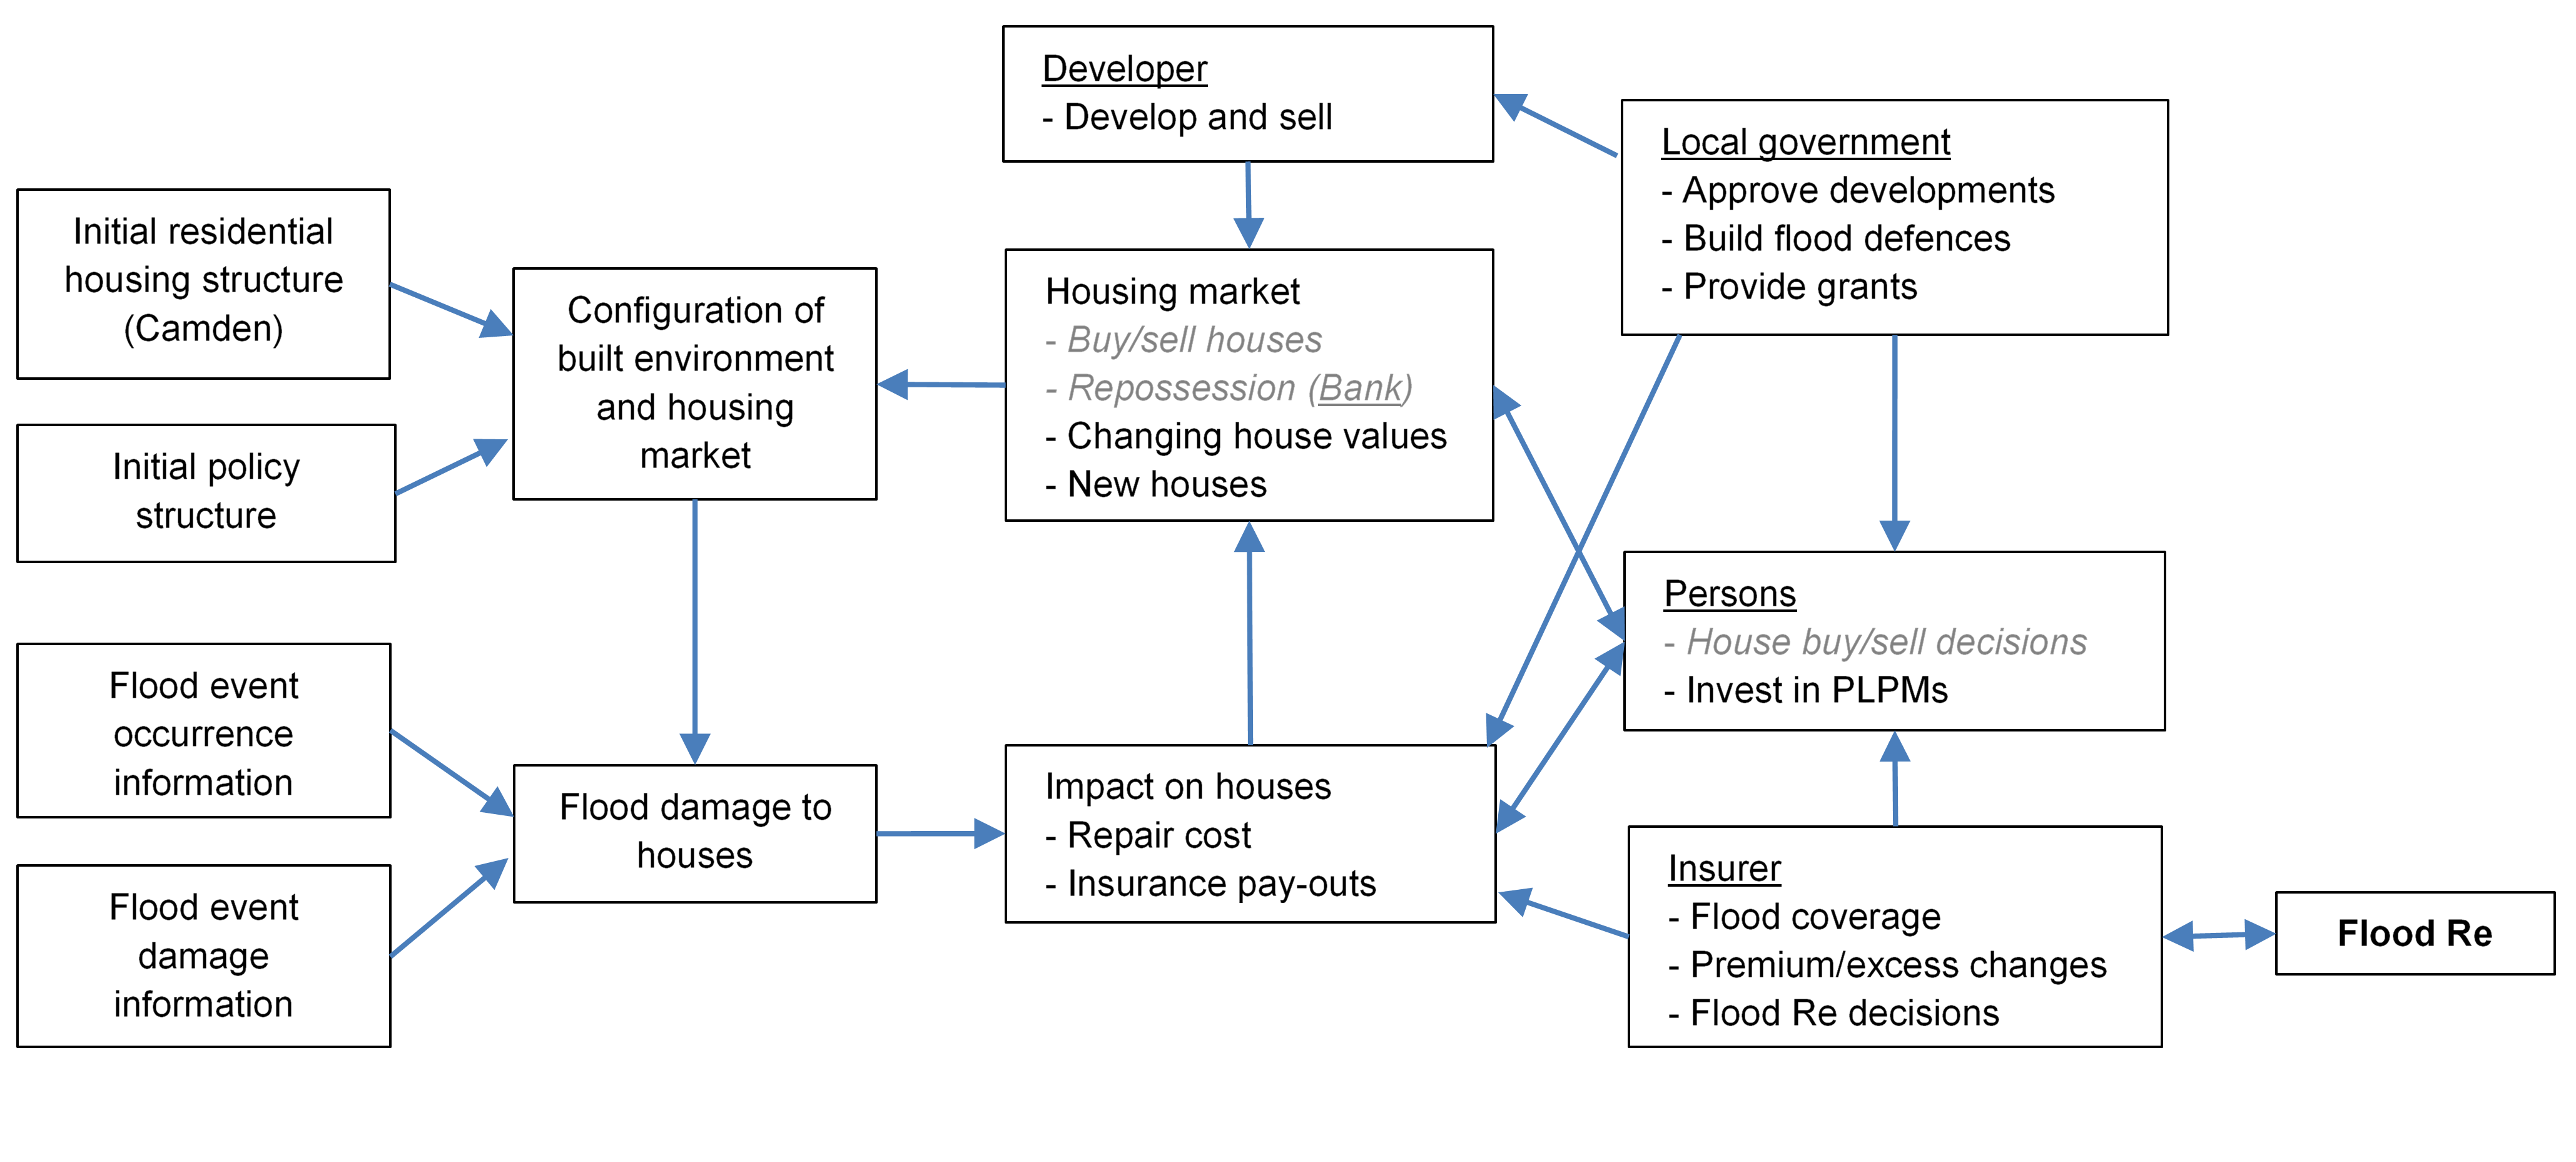
The ABM presented here is novel in its application to a case study of London. Figure 1 provides an overview of the ABM with its key processes and interactions. The model captures the working of a local housing market that is affected by surface water flooding, and represents the characteristics and present situation in the UK, and specifically London. The modelling of the housing market followed the approach used by Chandra-Putra et al. (2015) in that it adopts the experimental economics of a double auction market. However, the double auction market module from Chandra-Putra et al. (2015) was re-written to reflect specific characteristics of the study area and to enhance efficiency given the large size of the model. For example, it was re-coded to reflect the UK mortgage system; the specific characteristics of the housing market so that prices reflected the different areas of Camden rather than being related to geographical aspects such as proximity to water and elevation; and the way house prices change in the model based on previous sales was made more efficient given the large number of households. While the code was re-written and parametrised for the case study presented here, the dynamics of how homebuyers place bids and sellers place asking prices, how they bid against each other, buying and selling decisions, and the role of the Bank agent remain similar (highlighted in italics in Figure 1).
The model also includes an elaborate insurance system including the mechanisms underlying the forthcoming Flood Re system, and models the role of the developer and the local government in terms of influencing the built environment, investment in flood risk reduction measures, and the vulnerability of homeowners in this dynamic. The ABM also benefits from the incorporation of a surface water flood event dataset, for present and future climate scenarios, developed by combining probabilistic precipitation projections with detailed surface water flood depth maps (Jenkins et al. 2015). Finally, the presented model is GIS explicit to allow a realistic representation of the built environment and surface water flood risk.
Further details are provided in the sections below aimed at introducing the ABM, its application, and main insights. The construction of the model is done using Netlogo (Wilensky 1999). A copy of the model and further documentation, including full tables of parameters, data values and sources, decision trees, validation of the model and significance testing is available in Dubbelboer (2015), and online at https://www.openabm.org/model/4647/version/1/view. An ODD Protocol describing agents, model variables, the model process and scheduling, design concepts, initialisation and inputs is included in the Appendix.
Model environment
ABMs have been considered weak in the past due to limited application of empirical data to parameterise model attributes and validate results. However, these connections are essential if ABMs are to be applied for policy analysis and be seen as robust when exploring future changes in systems e.g. due to climate impacts and adaptation policies (Filatova 2015). As such, this ABM is parameterised based on a large array of data sources and developed around GIS data to allow a realistic representation of residential buildings and surface water flood risk.
The ABM presented here has been developed for Greater London where the increased population and reduced urban surface permeability due to densifying development mean that London’s aging drainage systems are under pressure, and the risk of surface water flooding is particularly acute. Around 680,000 properties are estimated to be at risk with 140,000 Londoners at high risk, and another 230,000 at medium risk (Greater London Authority 2014). According to the Greater London Authority (GLA), surface water flooding is the most likely cause of a flood event and is probably the greatest short-term climate risk for the greater London area (Greater London Authority 2009, 2011a).
In this paper the ABM is applied to a case study of the London Borough of Camden. This encompasses an area of 21.8km2 and a population of approximately 228,400 people (Greater London Authority, 2015a). Surface water flooding poses a large risk to Camden due to the nature of summer thunderstorms and the topography of the area, with a historic precedent for such events (Drain London 2011). The area is not at risk of flooding from the River Thames or any other open rivers.
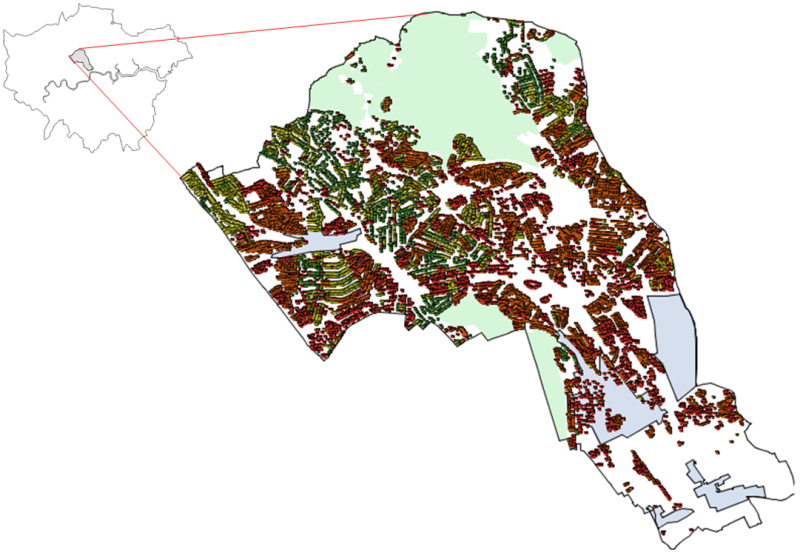
The study used GIS data from the London Datastore (Greater London Authority 2015b), residential building data from Landmap (2014) and derived data from the UK Buildings Residential Building Class Dataset[1], and detailed surface water flood depth maps generated by the GLA Drain London Project (Greater London Authority 2015a). In Figure 2 the interface of the model can be seen in which the GIS data provides the boundary of the Borough of Camden; locations of residential houses; major parks and designated development areas. This sets up an initial modelling environment with 95,561 houses of 4 different types; detached, semi-detached, terraced and flats. The ABM includes six different agents: people, houses[2], an insurer, a bank, a developer and a local government, each with their own behaviour (summarised in Table 1 and outlined below).
Modelled agents
Each unit of time, or “tick” in the model represents a year. Within this year all agents perform tasks based on the information that is provided to them as outlined below and summarised in Table 1.
Persons
Each person can be classified as a homeowner, buyer or seller and performs tasks depending on the class they are. Homeowners start by renewing their annual flood insurance. For this they ask the insurer agent to calculate their flood insurance premium and flood insurance excess. All homeowners are required to have flood insurance in the model. This reflects the current situation in the UK where home insurance (which incorporates flood insurance) is a pre-requisite for obtaining a mortgage, resulting in a high flood insurance penetration rate of 95% (Lamond et al. 2014). As such, in the model homeowners will always accept the quotes they get from the insurer and the insurer cannot deny providing someone flood insurance.
After insuring their house, a homeowner can decide to sell the house. A homeowner has three different motives for deciding to sell their house in the model. Firstly, if their annual fees are higher than the income they can spend on the house for three consecutive years the house is foreclosed and sold to the Bank. Secondly, if they can make a suitable profit on their house homeowners would look to sell. The homeowner will check if the house value is at least 10% higher than the value paid following the assumption of Chandra-Putra et al. (2015). If this is the case, people who can make a profit will sell for this reason. Thirdly, a percentage of homeowners may decide to sell regardless of profit if they wish to move to a different location. The percentage of movers for these reasons is set at 2.7% of homeowners annually, estimated based on information for Camden from the ONS (2014) and London Datastore (Greater London Authority 2015b).
If a homeowner decides not to sell her house she will then decide whether to invest in PLPMs to make the house more flood resistant and resilient. Anxiety and insecurity about floods is assumed to play the most important role in the decision to invest in PLPMs. As such, in the model it is assumed that 34% of people affected by flooding will invest in PLPMs after the event (Harries 2012), and based on availability of government grants, while 1% of people invest proactively in PLPMs (based on expert opinion and analysis of data from Defra (2008).
If a homeowner does decide to sell her house she becomes a home seller and will put her house on the market. When a home seller has found a suitable homebuyer she will not simply leave the market but instead can re-join the market as a homebuyer. Additionally, external homebuyers can also enter the market. The total number of homebuyers was based on projected population trends for Camden to 2041, which also accounts for national and international migration (Greater London Authority 2015c). In this way people can stay within or join the modelled market, which puts pressure on the housing market as is the present case in England (Inman 2014).
Homebuyers search for a house to buy every year. Similar to assumptions made by Chandra-Putra et al. (2015) it is assumed that a homebuyer’s search is driven primarily by the most expensive house they can afford to buy. It is also assumed that they will prefer new build developments, and search for a specific house type prioritised as detached, semi-detached, terraced and flat. Homebuyers may also consider flood risk in their purchase decision. In England and Wales this information is obtainable online in the form of detailed flood risk maps maintained by the Environment Agency, and estate agents are required to communicate to buyers any recent flooding incidents. Based on survey data it is assumed in the model that 57% of homebuyers would investigate the flood risk of a property they considered buying (Home Check 2012). However, the implications of this are not clear, particularly for London where due to the unprecedented demand for housing evidence suggests that flood risk has limited if any lasting effect on the saleability and value of property. Given these uncertainties, it is assumed that homebuyers look back at the flood history of a house for the past three years, with more recent events having a larger effect on their behaviour (Lamond et al. 2009). Homebuyers that consider flood risk will not buy a property if it has flooded in that year. Where a house was flooded in the previous year only 50% of risk adverse homebuyers will consider buying it. For flooding 2 years ago this percentage drops to 25%.
Insurer
The main task of the insurer is to provide every agent owning a house (person agents, the bank or the developer) with flood insurance. In the ABM we assume that an insurer has detailed information that provides an estimate of surface water flood risk (see flood risk modelling below). Based on that risk estimate the insurance premium and excess can be calculated for each household. In this analysis we only model the technical side of flood insurance and not the commercial side (i.e. competition between insurers which might modify the offered premium). As we are focussing on surface water flooding we limit the insurer’s attention to the surface water flood history of a house and the estimated surface water flood risk.
The insurer first sets the flood insurance excess for all houses. The assumption is made that the flood insurance excess amount is non-negotiable and will initially be equal to £200 per household per year. Houses hit during a surface water flood event will see their insurance excesses increase by 1/3rd, to a maximum of £2500, as normally the excess would not be more than that as homeowners would not be able to get a mortgage (House of Commons Environment, Food and Rural Affairs Committee 2013).
The surface water flood risk estimates are summed across all affected houses in the model representing the insurers expected annual loss. The insurer deducts from this the total value of excesses paid and the total base flood insurance premium paid by all households in the model, assumed to be £50 per house per year. The remaining loss that has to be covered is spread across the households at risk of surface water flooding, by increasing their flood insurance premium proportionally to the flood risk they are in. In this way people owning a house in surface water flood risk will receive a higher flood insurance premium. Insurance premiums are calculated at each time step and will reflect the dynamic nature of surface water flood risk in the model. For example, due to changes in the built environment and investment in PLPMs and SUDS which can alter the level of flood damage and risk to properties.
Insurers typically pass on risks above a set threshold by purchasing reinsurance on the global market. In this case study the Flood Re scheme represents a government designed reinsurance entity. When switched on in the ABM the insurer has the option to re-insure eligible properties (built pre-2009) into Flood Re. The insurer will have to pay to re-insure a household into Flood Re with a fixed premium per policy capped dependent on the property value (approximated according to the local property council tax rate ranging from £210 to £540 in the study area) (Defra 2013). In this way the total compensation the insurer pays following a flood will be lower when the Flood Re option is selected, as they are no longer required to compensate the highest risk houses.
In the model there are no constraints on the available assets of the Insurer or the Flood Re Scheme, with both able to go into debt. This is captured in this way as throughout the Flood Re consultations concerns have arisen over the financial sustainability of Flood Re given that costs will remain higher than benefits delivered (Defra 2013). As such, potential costs and the economic implications of the scheme can be investigated for different scenarios.
Developer
The main task of the developer is to build new housing projects and to sell the houses it builds. After the housing market is run within a tick of the model, the developer will look at the demand for housing and available properties on the market and build houses to meet the unmet demand. A simplification in the model is that house development is done on a house-by-house basis and not based on projects in which multiple houses are built at the same time.
Other ABMs have focused specifically on developer decision making. For example, in terms of the mix, timing and intensity of developments based on the developer’s characteristics, available site characteristics, market conditions, and the regulatory environment (e.g. Parker et al. 2015 and Magliocca et al. 2014). In this study the main driver for a developer building properties is profit. For every house the developer wants to build they will try to find the optimal location. This is defined as available land with the highest economic value of surrounding houses. Given the specific application of the ABM to London and Camden the developers decision making is limited as the locational choices and intensity of developments is based on the GIS maps of planned opportunity areas (Figure 2) and data on development targets set by the national and local government. Within the opportunity areas the developer is free to build as many houses as optimal per year, with a maximum limit on total houses (Camden Council 2015). Outside of the development areas the developer is limited by a maximum number of houses it can build per year (150-200) reflecting the planned housing trajectory of Camden (Camden Council 2013).
Once the developer has chosen a location to build a house they assess if it is profitable. If the estimated market value of the house is at least 20% higher than the build cost they will create a development proposal for approval by the local government. If the government approves the development proposal (see Local Government below) the developer will start building the house. The building of a house is assumed to take one year, after which the developer puts the house on sale for the estimated market value. Land value, the type of house to build, and the house price once completed are calculated based on the characteristics and values of the surrounding houses. When it comes to flood risk one important assumption made here is that the building of new houses does not influence the flood risk of houses surrounding the development. Based on reports for London it is initially assumed that 50% of all new build houses will be built with flood defences in the form of SUDS (Defra 2011).
Local government
The main task of the local government in the model is to protect people living in the Borough against floods. The local government aims to reduce flood risk through investment in PLPMs (implemented by homeowners and linked to government funded grants) and surface water flood reduction projects in the form of SUDS. Based on available literature it is initially assumed that these measures will reduce household flood damage by 75% (Thurston et al. 2008) and 35% (Defra 2011) respectively. The amount of assets the local government can spend on SUDS and PLPM grants every year is equal to the annual subsidy they receive from the national government and a small percentage of their income from selling land to the developer and collecting property taxes from home owners. Initially it is assumed that up to 80% of this budget can be spent annually on SUDS and 20% for PLPM grants. Based on past funding for flood repair and renewal grants in the UK it is assumed that each person can receive up to £5000 to invest in PLPMs (Defra 2014).
Every year the local government will proactively search for SUDS projects to invest in. Every project consists of a minimum of 100 houses that are in close proximity to each other. The projects are selected based on the flood risk of houses and the benefit-cost ratio that the local government would achieve for each project. From the 10 projects the local government will try to build as many as it can within its available budget, starting with the projects with the highest benefit-cost ratio. The second task of the local government is the evaluation of development proposals. Just as development proposals are made on a house-by-house basis, the proposals are evaluated in the same way. Although regulation on approving development proposals states that local governments should consider flood risk, figures indicate that in 75% of cases flood risk is not looked at (Wynn 2005). As such, a development proposal will be approved by the local government in 75% of all cases. In remaining cases the development proposal will be approved if the flood risk of the development is lower than the governments acceptable maximum flood risk. If this is not the case the development proposal can still be approved based on the profitability of the land sale to the local government. This reasoning reflects the current pressure local governments are put under by central government to develop more houses within their borough (Camden Council 2013; Greater London Authority 2011b), and highlights trade-offs which must be made when addressing flood risk and housing shortages.
Bank
The task of the bank is to foreclose on houses if the owner was not able to afford their house fees for three consecutive years, following the approach of Chandra-Putra et al. (2015). After foreclosing on a house the bank puts the house up for sale at its current value. Table 1 summarizes the main agent behaviours included in the model.
| Agent | Main Behaviours |
| Person | Decide to buy or sell properties Required to renew flood insurance annually Pay household fees Decide whether to invest in PLPMs (assumed that 1% of homeowners invest proactively per year, while 34% invest reactively following a flood) May consider flood risk when considering to purchase a new property |
| Insurer | Estimates household surface water flood risk for every property in model (where in place they account for PLPMs and SUDs in these estimates) Sets insurance premiums and excess levels for every property in model Provides all households with flood insurance Decide whether it is cost effective to place high risk properties into Flood Re Provide compensation, minus the excess, to properties following a flood event |
| Local Government | Invest up to 80% of their local flood defence budget (or more in the year of a flood event) in SUDS projects which protect houses at highest risk of flooding and provide a cost-benefit ratio of 1:5 or greater Invest up to 20% of their local flood defence budget to provide £5000 grants to households investing in PLPMs Evaluate and approve/reject property development plans based on their financial benefits and flood risk Sell land to developers for approved property developments |
| Developer | If demand for new properties outstrips available properties on the market propose to build new properties to meet demand Identify optimal land to maximise profits from developments, within allocated development areas and the local governments planned development trajectory Submit development proposal to be approved by the local government Build new houses (initially assumed that 50% of all houses built will have SUDS) and sell on the market |
| Bank | Reposes houses if the owners are unable to afford household fees for three consecutive years Sell houses on market |
Flood damage data
Data on the residential properties in Camden which would be affected by surface water flooding, and the subsequent economic damages, are calculated based on the Drain London flood depth maps. By overlaying the spatial flood maps onto the residential building data properties at risk of surface water flooding, and the flood depth, were identified. Economic damages to residential buildings were estimated using flood depth-damage functions for short (<12hr) duration floods (Penning-Rowsell et al. 2010). This provides an estimate of damages to residential building fabric and contents based on building type and age. As such, when a surface water flood event of given severity is projected to occur the residential properties affected and corresponding flood damages are readily known.
Initial houses in the model are also assigned a surface water flood history. The length of the flood history is dependent on the build year of the property, and reflects a random time slice from the baseline flood event time series. The household damage for given return periods do not change under the future climate scenarios (just the frequency of events of this magnitude). To illustrate the effect of climate change the change in probability of surface water flood events of a given magnitude are estimated and accounted for in the probability damage curves and subsequent estimates of risk.
Flood risk modelling
Based on the economic damage to houses for given flood events, every house in the model has a level of flood risk assigned to it. This flood risk is recalculated every year to reflect the dynamic changes in the model including investment in flood protection measures and the creation of new houses. The flood risk of every house is calculated based on the formula in Bevan and Hall (2014). In any given year \((t)\), the risk \( (r_{i,t}) \)is given by:
| $$r_{i,t}=\int_{0}^{\infty}D\left(x_{t}\right)\,f(x_{t})\,dx_{t}$$ | (1) |
To create a damage-probability graph for each house using the formula above, assumptions are made given only three flood return periods (1 in 30, 1 in 100, and 1 in 200) are available. Namely, it is assumed that the function is linear between the three known points. As the damage probability function will never have a probability of zero the function is forced to meet the axis by assuming that the damage with zero probability is the maximum damage that can be done to a house. There are many factors which would influence this at a household level, and given a lack of data this is currently assumed to be 20% of the building value. The slope of the function is assumed to extend horizontally until it crosses the x axis (damage). A maximum limit is put on this assuming that it is highly unlikely that a house will be hit by a flood more than once every 2 years (i.e. 50% probability). Household flood risk is then calculated as the area under the line.
Experimental Setup
The ABM has been developed to investigate surface water flood risk in London and assess the interplay between different adaptation options; how risk reduction could be achieved by homeowners and the local government; and the role of flood insurance and the forthcoming Flood Re scheme. In order to test and validate the ABM an initial assessment was made of the potential role of PLPMs and SUDS, and Flood Re for managing surface water flood risk. The ABM interface was designed to allow these options to be ‘switched on and off’ and tested individually and in combination to explore potential negative and positive feedbacks which could occur when adaptation options and insurance mechanisms are considered in parallel. The model was run using flood event time series data for the baseline (1961–1990) and the 2030s and 2050s high emission climate change scenarios, run at a yearly time-step for 100 simulations of the 30-year time series data so as to sample stochastic variability in the flood event series.
As ABM can be chaotic with results varying between runs it is recommended to explore the variability in outputs by performing many repetitions (van Dam, Nikolic & Lukszo 2012). The 300 repetitions that are performed here for every experiment provide a more accurate representation of the behaviours in the model, as well as representing uncertainty in the climate scenarios. Given the model size, complexity, and multiple simulations required the ABM was run on a state-of-the-art high-performance computer facility. The data analysis was carried out using the free and open source program R. Output metrics were collected annually, including number of houses in flood risk; flood risk level; flood damage; flood insurance premium cost; number of houses re-insured in FloodRe; number of persons that invest in PLPMs every year; and the number of houses for which flood defences were built.
Results
Flood protection measures
The ABM allows an investigation of how different agents could contribute to surface water flood risk reduction. Looking at the percentage of houses in the model protected by different flood protection measures gives an indication of the level of investment made in PLPMs by agents, both proactive and reactive, and investment in SUDS made by the local government and the developer. Figure 3 highlights that for PLPMs most investments are made proactively rather than reactively over time. This is because reactive investments only occur following a flood event and the government budget for grants in any year is limited. The developer steadily invests in flood defences over the years whilst developing houses. The largest percentage of houses protected by flood protection measures are covered by investments by the local government, although the range in results varies the most (represented by the green dots). In the first 10 years the local government mostly invests in flood defences in the same way over all runs. However, after this point a large range can be seen reflecting how the local government reacts to flood events of different magnitude and frequency in the runs, and their decisions to invest more or less of their budget in SUDS projects.
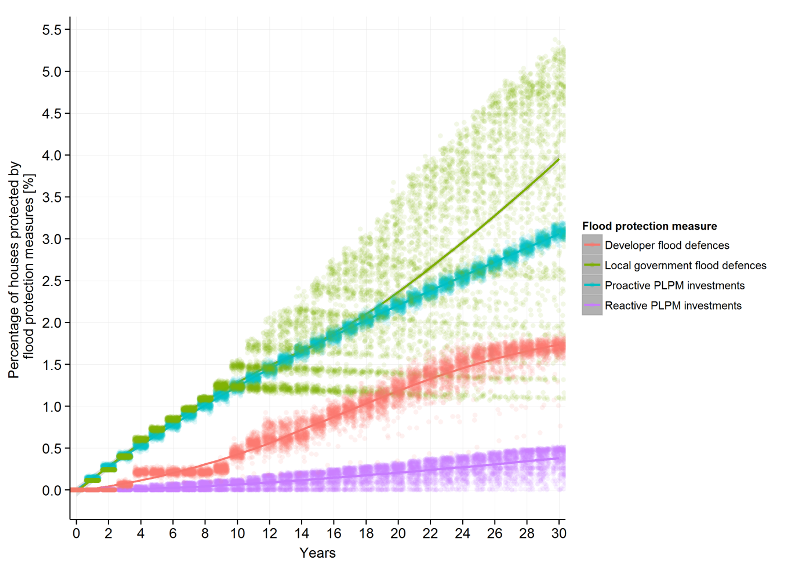
Figure 4 shows how these investments act to reduce flood damage to houses in the model. In contrast to Figure 3 the greatest economic benefits result from developer investment. This reflects the fact that developers build a lot of new properties in areas of high flood risk in the model, where flood damages would be relatively high and so defences have a large benefit. The percentage of houses protected by local government flood defences and proactive investments in PLPMs are similar (Figure 3), and the reduction in flood damages also remains similar (Figure 4). This is even though flood defences are assumed to reduce flood damage by 35% (Defra 2011) compared to PLPMs which are assumed to reduce damage by 75% (Thurston et al. 2008). This reflects the rationale of the local government to build flood defence projects in the highest risk areas where economic benefits are greatest, compared to people who will invest in PLPMs in a less rational manner reflecting anxiety and emotions (Harries 2012). This is illustrated in Figure 5 which shows modelled flood risk maps for Camden at the start of a single model run, and the spatial pattern of investment in flood protection measures. Government investments focus on the areas in the study area that have the highest flood risk, while investments in PLPMs appear to be more random.
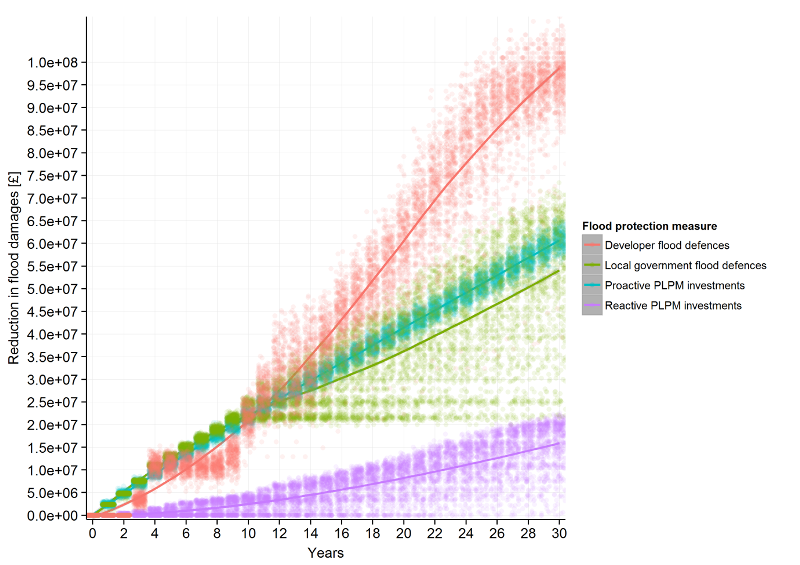
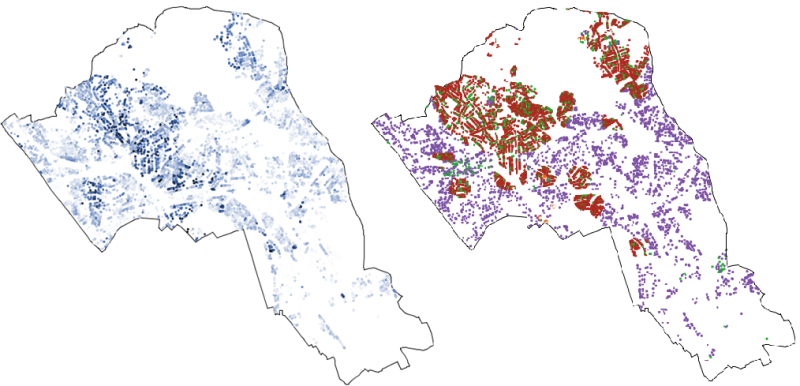
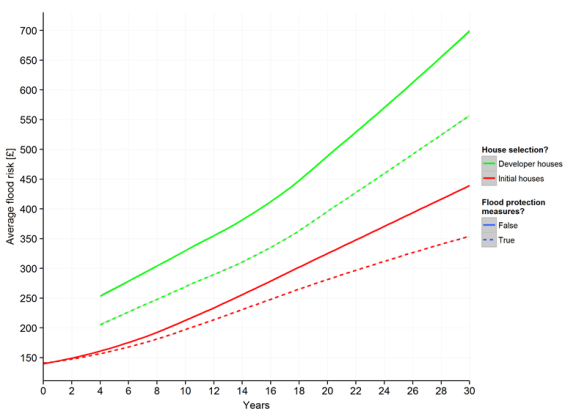
Figure 6 highlights the positive effect that flood protection measures have on the level of flood risk houses are in, disaggregated by existing houses and newly developed houses (in the first 4 years no developer houses are built). New houses see benefits from flood protection measures straight away as from the start the developer builds a lot in high risk areas where the highest profits can be reached. This is particularly important given that new properties built post-2009 will not be eligible for the forthcoming Flood Re scheme, and as such will not be guaranteed affordable flood insurance if they are at high risk. For initial houses in the model the effect of flood defences on flood risk increases gradually over time as investment increases. However, in both cases the overall trend in flood risk still increases with and without flood protection measures. This reflects the cumulative effects of flood events, the continued development of properties in areas of flood risk, and the annual inflation related increase in flood damages used to calculate flood risk in this version of the ABM.
Flood insurance schemes
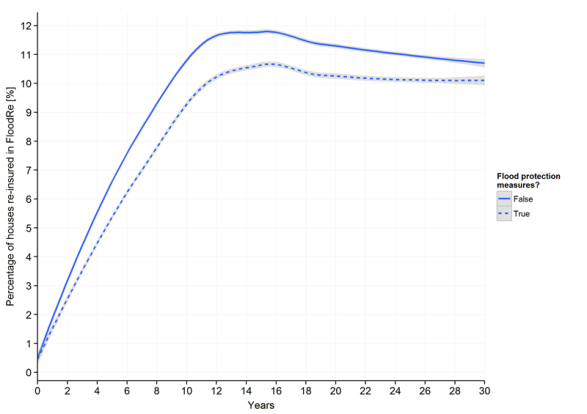
The second area of investigation focuses on the specific role of the Flood Re scheme. Given the way in which Flood Re is designed to work we test its ability to cover high flood risk houses and make insurance more affordable. Figure 7 shows the annual trend in the percentage of all houses in flood risk which would be re-insured by Flood Re. Initially only about 5% of houses in flood risk are re-insured by Flood Re. However, with increasing flood risk (e.g. Figure 6) and the associated increase in flood insurance premiums (Figure 8) the trend quickly increases over the first ten years. The percentage of houses in flood risk re-insured into Flood Re then remains relatively constant, declining from around 90% to 75%. This decline reflects the continuing development of houses, often in areas of high flood risk, which contribute to the overall flood risk of the study area but are not eligible for the Flood Re scheme.
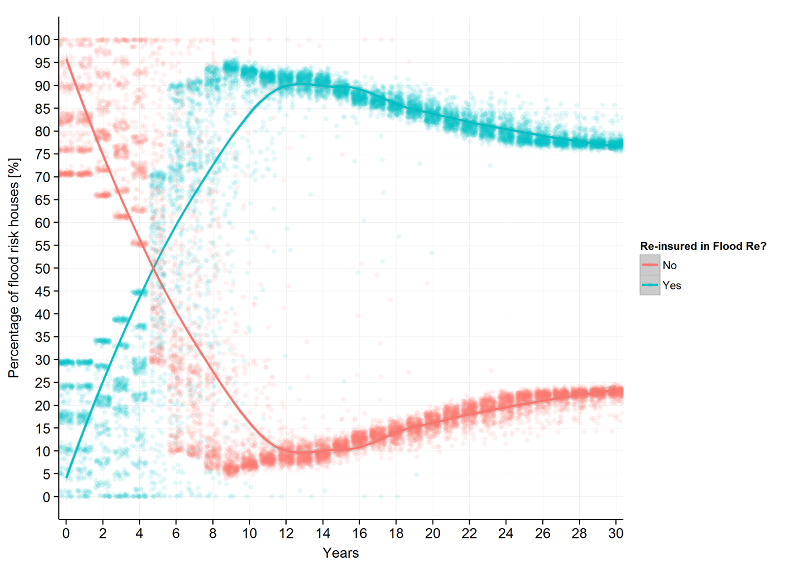
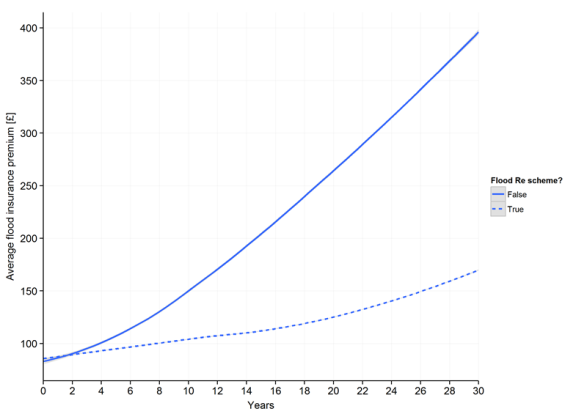
Figure 8 shows the main effect of the Flood Re scheme when it is combined with existing flood insurance. Flood Re is shown to lower the flood insurance premiums of high risk properties significantly. Where initially the average insurance premium increased from an average of £75 to £400 in 30 years, Flood Re more than halves this to an average of around £170 after 30 years. The upward trend seen here also comes from new houses being built by the developer in areas at risk of surface water flooding, which are not eligible for the Flood Re scheme. This supports the main aim of Flood Re to lower flood insurance premiums and suggests the model is capturing the main function of the scheme correctly.
Finally, we explore the interactions between Flood Re and investment in flood protection measures. While Flood Re does not directly incentivise investment in PLPMs or SUDS Figure 9 highlights a positive feedback. Fewer properties are re-insured into Flood Re when such flood risk reduction measures are in place. This is as PLPMs and/or SUDS are accounted for when estimating the potential damage to properties affected by flooding, and consequently lowers the insurer’s estimate of flood risk of protected properties and in some cases the need to place the property into Flood Re. In these simulations a combination of SUDS and PLPMs are shown to be most beneficial in terms of reducing the number of properties which are placed into Flood Re. This highlights the importance of investing in surface water risk management if the viability of flood insurance is to be maintained in the future.
Discussion and Conclusions
The paper presents an ABM developed to model the dynamics of surface water flooding, changing surface water flood risk, and how adaptation and insurance decisions could affect future surface water flood risk in that dynamic. While the focus of this paper is a case study of Camden the ABM is applicable to the broader situation in Greater London and could be extended to other areas in the UK or specific situations in other countries (dependent on availability of relevant data and computational resources). The analysis is novel due to its dynamic nature and as different combinations of surface water flood risk management options can be modelled, to include structural adaptation options, insurance, and the specific case of Flood Re.
Filatova (2015) highlight the need to move from conceptual modelling experiments to simulating real life situations through the use of available data. Both KISS (Keep It Simple Stupid) and KIDS (Keep It Descriptive Stupid) models have benefits and disadvantages. In this study we follow the KIDS approach to help facilitate real life policy testing. One downside of this approach is that ABMs inevitability become more complex and can forego comprehensibility and transparency. The systematic approach to recording assumptions and extensive verification efforts (e.g. see documentation available at (https://www.openabm.org/model/4647/version/1/view) work to limit the problems of transparency. Additionally, the physical limits to agent behaviour provided by the detailed GIS data and flood maps further strengthen the realism of the model.
The paper demonstrates how the ABM captures essential features of the flood insurance scheme and flood protection investments. While it has not been possible to validate the model in terms of the Flood Re system (it is due to begin in April 2016) the overall patterns of behaviour shown by the ABM are in line with the available literature, real world data for London and Camden, and expert opinions. In the creation of the model different experts were consulted to provide expert knowledge, opinions, and feedback to help parameterise and validate the model, and the process has been strengthened by ongoing stakeholder input and interaction.
A second limitation, as with all ABMs, is that the results must be carefully interpreted given the underlying assumptions which are necessary given the model complexity. Nevertheless, the ability of the framework to incorporate different agents with their own behaviours; flexibility for testing different conditions and behavioural rules; flexibility to test and evaluate different policies and options; and the ability to visualise and quantify this in a spatial and dynamic manner, highlights the potential benefits of such an approach to support and inform decision making with regard to surface water flood risk and management strategies. The user interface has been developed in such a way that allows different policies, combinations of policies, agent behaviours, mechanisms of the Flood Re scheme, and research questions to be easily explored.
In particular, the model is timely in its contribution to the assessment of the existing public-private partnership and the Flood Re scheme, which have until now received insufficient attention due to lack of data or analysis. Based on the future scenarios of climate change and surface water flood events, analysis has been undertaken to explore the implications of future climate change on the proposed Flood Re scheme. The results have been of interest to stakeholders, and reported in the recent Prudential Regulatory Authority (2015) report on the impact of climate change on the UK Insurance sector. Applications also include an integrated assessment of surface water flood risk and management strategies under future climate change, which focuses on the interplay between different adaptation options; how risk reduction could be achieved by homeowners and government; and the role of flood insurance and the new flood insurance pool, Flood Re, in the context of climate change (Jenkins et al. 2016). Thirdly, the model has been used to assess the role of the current insurance partnership for incentivising resilience under future climate change, challenges faced, and how the inclusion of other agents, such as local developers, could enhance the risk reduction potential and future resilience of the Flood Re scheme. This includes an assessment of the role of different agents and how they could adapt their behaviour to address future risks (Jenkins et al. 2015). Lastly, an area of ongoing research is focused on testing the mechanisms of the Flood Re scheme and different transition options back to risk based pricing.
Overall the ABM has highlighted how socio-economic development can exacerbate current levels of surface water flood risk in Camden, with an increase in the average risk to properties in the model. Our analysis of different response mechanisms and interventions indicates that the implementation of SUDS and PLPMs are beneficial for reducing surface water flood risk. However, even with SUDS and PLPMs in place the average surface water flood risk continued to increase over time. Given the potential implications of climate change this illustrates the danger of further trade-offs between future development plans and flood risk management and need for further investigation in this area.
The model also highlighted that Flood Re would achieve its aim of securing affordable flood insurance premiums. However, Flood Re has no additional benefits in terms of overall risk reduction. This reflects concerns that the new scheme is missing an opportunity to contribute to risk reduction, which is important to its own resilience under future climate change. As such, the ABM is well suited to investigate how extensions and modifications to the proposed Flood Re scheme could better facilitate risk reduction.
The above issues and questions are all highly relevant aspects for the ongoing regulatory and political approval process for Flood Re, which have until now received insufficient attention due to lack of data or analysis. The development of the ABM addresses this gap and future findings are expected to provide important input to the current discussion about the design and operation of Flood Re, particularly with regards to incentivizing flood risk reduction measures.
Acknowledgements
This paper has benefited from research undertaken as part of the ENHANCE Project (Enhancing risk management partnerships for catastrophic natural hazards in Europe), funded under the Seventh Framework Programme of the European Union under grant agreement No 308438. The authors are grateful for expert opinion and input to the model design provided by Dr Swenja Surminski and Dr Florence Crick of the Grantham Research Institute on Climate Change and the Environment, London School of Economics and Political Science. We are also very grateful to Prof. Clinton J. Andrews and Mr Handi Chandra-Putra who kindly shared their ABM code, allowing us to develop and expand our model in a timely manner. To gather large arrays of data from the agent based model two cluster computer systems were used. Initially the High Performance Computing (HPC) system at the Technical University of Delft was used. At a later stage the University of Oxford Advanced Research Computing (ARC) facility was used (http://dx.doi.org/10.5281/zenodo.22558).Appendix: The ODD Protocol
Purpose
The purpose of the model is to investigate the role of flood protection measures in risk reduction, the working of the existing public-private flood insurance partnership in the UK and the proposed new insurance scheme Flood Re and how these schemes can be used to incentivize risk management.
Entities, state variables and scales
Environment
| Variable name | Brief description |
| Percentage of houses for sale at the start | The percentage of houses for which home sellers will be created at the start |
| Mortgage interest | The annual interest that is charged over a mortgage of a person |
| Mortgage term | The number of years (ticks) in which the person pays off his mortgage |
| Average flat value | The initial average value (in pounds) for the house type flat |
| Average terraced value | The initial average value (in pounds) for the house type terraced |
| Average semi -detached value | The initial average value (in pounds) for the house type semi-detached |
| Average detached value | The initial average value (in pounds) for the house type detached |
| Owner warning time | The number of years (ticks) a homeowner will pay more than he can afford on his house before putting his house up for sale |
| Number of trade actions | The number of times a homebuyer or home seller sets a price within a trade round |
| Housing ratio increase | The percentage with which the housing ratio of a person is increased compared to the calculated mortgage ratio of that person |
| Land value percentage | The percentage of a house value that initially can be seen as the land value. The rest is the building value of the house |
| Immigration percentage | The percentage of new homebuyers that enter the market every year |
| Percentage of movers | The annual percentage of persons that decide to sell their house because they want to move to a different house |
| Flood risk consider probability | the probability that a person will consider flood risk when buying a house |
| No selling decrease value percentage | The percentage with which the asking price of a house will be decreased at the end of a year when no buyer was found for it |
| Inflation percentage | The percentage with which a person’s income will be increased every year to account for inflation |
| Percentage of proactive PLPM investors | The percentage of persons that will be labelled a proactive PLPM investor |
| Percentage of reactive PLPM investors | The percentage of persons that will be labelled a reactive PLPM investor |
| PLPM investment flood protection benefit | The amount with which the flood protection of a house increase when the owner has invested in PLPMs for it |
| Flood protection budget | The annual amount of money (pounds) the local government gets from the national government to invest in flood protection |
| Cost of flood defences | The cost of building flood defences for a single house |
| Flood defence investment flood protection benefit | The amount with which the flood protection of a house increase when the local government builds flood defences for it |
| Flood Re Assets | The amount of assets in the FloodRe system |
| Flood Re Levy | The levy that is taken from all flood insurance premiums to pay for the Flood Re system |
| Land value | Assigned to every patch in the model. It indicates the value a piece of land (patch) has on the market |
Agents
| Variable name | Brief description |
| Homeowner? | True if the person owns a house he does not want to sell |
| Home seller? | True if the person owns a house that he wants to sell |
| Homebuyer? | True if the person does not own a house but wants to buy one |
| Income | The amount of money a person earns annually |
| Housing ratio | The percentage of a person’s income that he can afford to spent on his house |
| Mortgage ratio | The percentage of a person’s income that he can afford to spent on mortgage payments |
| Number of incomes as down payment | The number of incomes a person can pay as a down payment when buying a house |
| Percentage sell price | The percentage with which a person will increases the house value of his house when he puts it up for sale |
| Would sell house for profit? | True if a person would consider selling his house for profit (10% of persons would) |
| Profit percentage | The percentage a person’s house need to be worth extra compared to what he bought it for, before he decides to sell it for profit |
| Maximum house price | The maximum price a homebuyer can spent on buying a new house |
| Seller ask price | The price a home seller asks for his house |
| Annual fee | The annual fee a person needs to pay for the house he owns |
| Flood risk consideration status? | True is the person considers flood risk when buying a house |
| Variable name | Brief description |
| House type | The type the house is (flats, terraced, semi-detached or detached) |
| House value | The value of the house |
| Initial house value | The initial value of a house (at model start or when build) |
| Building value | The value of the building part of a house (The house value is equal to the building value + the land value of the patch the house is on) |
| Build year | The year the house was built |
| Flood damage history list | A list of all the years the house has previously been damaged by a flood |
| Person owned? | True if the house is owned by a person that does not want to sell it (homeowner) |
| Person on market? | True if the house is owned by a homeowner that does want to sell it (home seller) |
| Bank owned? | True if the house is owned by the bank |
| In construction? | True during the time the house is constructed by the developer |
| Developer owned? | True if the house is owned by the developer |
| Council tax band | The council tax band the house is assigned to |
| Property tax fee | The annual fee that has to be paid on property taxes for the house |
| Annual fee list | A list of fees the owner of a house has to pay on an annual basis |
| Fee duration list | A list of remaining time of each fees set in the annual fee list |
| Mortgage fee | The annual fee that has to be paid over the mortgage a person took for buying a house |
| Ageing repair fee | The annual fee that has to be spend on repairing a house from ageing |
| House value at buy | The house value of a house when it is bought |
| Flood damage list | A list with flood repair fees for every given flood return period |
| Flood status? | True if the house is flooded this year (tick) |
| Flood repair fee | The fee that has to be spend on repairing a house after flood damage (taken from the flood damage list) |
| Flood risk | An evaluation of the flood risk a house is in |
| Flood insurance status? | True if the house is insured against flooding |
| Flood insurance premium | The annual fee that has to be paid to insure the house against floods |
| Flood insurance excess percentage | The percentage of flood damage that is not covered by insurance and needs to be paid by the owner of the house |
| Flood insurance excess | The amount of flood damage to a house that is not covered by flood insurance |
| Flood protection level | The level (a value between 0 and 1) with which the damage done to a house by a flood is lowered because protection measures have been taken for this house |
| Re-insured to Flood Re status? | True if the house is re-insured in Flood Re |
| Flood Re insurer cost | The amount of money (pounds) the insurer has to pay to the FloodRe system for re-insuring this house |
| Variable name | Brief description |
| Insurer assets | The amount of assets the insurer has |
| Initial flood insurance excess | The initial flood insurance excess a person has to pay on his insurance |
| Flood excess increase because of flooding | The amount with which a person’s excess will increase when his house is hit by a flood |
| Expected average annual loss | The losses the insurer expects to make in the current tick from compensating flood damages. |
| Current loss ratio | The current loss ratio (total compensation pay outs / total premium incomes) of the insurer |
| Maximum acceptable loss ratio | A fraction describing the maximum loss ratio that the insurer is prepared to accept |
| Base flood insurance premium | The base flood insurance premium that every house has to pay |
| Variable name | Brief description |
| Bank assets | The amount of assets the bank has |
| Variable name | Brief description |
| Developer assets | The amount of assets the developer has |
| Proposed land | The patch of land the developer is proposing to build a house on |
| Proposed house type | The house type the developer is proposing to build |
| Proposed house value | The value of the house the developer is proposing to build |
| Proposed land value | The land value under the house the developer is proposing to build on |
| Proposed building value | The building value of the house the developer is proposing to build |
| Proposed council tax band | The council tax band of the house the developer is proposing to build |
| Proposed property tax fee | The property tax fee of the house the developer is proposing to build |
| Proposed flood damage list | The flood damage list of the house the developer is proposing to build |
| Proposed flood risk | The flood risk of the house the developer is proposing to build |
| Income cost ratio for development | The ratio of income vs cost the developer wants to reach by building a house |
| Development approval status? | The status of the approval of the development plan the developer send to the local government (true if the proposal is approved) |
| Build time | The time it takes the developer to build a house |
| Proposed Flood Re insurer cost | The proposed Flood Re insurer cost of the house the developer is proposing to build |
| Variable name | Brief description |
| Local government assets | The amount of assets the local government has |
| Percentage of land sales used for flood defences | The percentage of land sale income that goes towards the flood protection budget |
| Percentage of property taxes used for flood defences | The percentage of property tax income that goes towards the flood protection budget |
| Maximum fraction of value at risk | The maximum fraction of house values that can be at risk before the local government starts acting (building flood defences) |
| Number of projects in flood defence portfolio | The number of project the local government will look at before deciding on projects to build |
| Minimum houses in flood defence project | The minimum number of houses that should be in a flood defence project |
| Flood defence portfolio | The portfolio with flood defence project to choose from |
| Wanted benefit-cost ratio | The benefit cost ratio a local government want to get from a flood defence project |
| Maximum flood risk | The flood risk that the local government will accept as the maximum risk a house can be in to approve a development proposal |
| Development approval ratio | The maximum ratio between the value of flood risk a house adds to that of the total municipality and the profit the local government will gain, for the local government to approve a development proposal |
| Development proposal status? | The status of a development proposal sent to the local government (true if evaluation is requested) |
One time step represents a year to allow the consequences of a flood as well as the reaction of the housing market to be investigated. Simulations were run for 30 years. Flood events were simulated using flood event time series data generated using an urban spatial weather generator.
Based on GIS data an outline of the Borough of Camden, major parks and areas of opportunity for the developer to build houses in are outlined. Also based on GIS data 95,561 initial houses are positioned on a grid of 300 by 300 patches. Because of the size of the housing data set and the amount of available patches, a patch can have two houses of different house types assigned to it. Each flat consist of 15 houses that are placed on top of each other. Only one of these houses is assigned to be at the bottom level and will be at risk of surface water flooding.
Process overview and scheduling
Because of the size and complexity of the model the full process overview will not be given here. However, an extensive overview of all the behaviours in the model, their explanation and their pseudo code can be found in appendix D of Dubbelboer (2015. Besides this the model code is also published on OpenABM (https://www.openabm.org/model/4647/version/1/view).
To give an overview of the process and scheduling of the model, the order in which all actions within the model are performed is given here:
Setup
First the environment is set up. After this the insurer is set up because it provides information that houses need when they get set up. After houses are set up persons can be set up and directly move into houses. After this the three remaining agents are set up. This gives the following order of setup:
- Setup environment
- Setup insurer
- Setup houses
- Setup persons
- Setup bank
- Setup developer
- Setup local government
Go
The go procedure is a bit more complex than the setup and goes as follows:
- First the flood event action of the environment will be run. This is done first because it provides information on flooding in the current year that is used by all agents
- After this the process house action of houses will be run because in this action houses gather and compute data that is used by the persons in the model. Within the action of processing houses the following actions are run by each house individually
- Calculate flood risk (house action)
- Set flood insurance premium and excess (insurer action)
- Calculate expected average annual loss (insurer action)
- Decide on re-insuring in Flood Re (insurer action)
- House flood repair (house action)
- After the houses are processed, the process person action of persons will be run. Within the action of processing persons the following actions are run by each person individually:
- Decide on house selling (person action)
- Foreclose house or sell on market (person actions)
- Invest in PLPMs (person action)
- Correct income for inflation (person action)
- Decide on house selling (person action)
- After the persons are processed the process insurer action of the insurer will be run. Within the action of processing the insurer the following actions are also run by the insurer:
- Compensate policy holders (insurer action)
- Calculate current loss ratio (insurer action)
- Adjust insurer assets (insurer action)
- Now that the houses, persons and insurer have gathered and computed all needed data the process market action of the environment can be run. Within the action of processing the market the following actions are also run:
- Developer market run (environment action)
- Set maximum affordable house price (person action)
- Disconnect seller from house if buyer is found (houses action)
- House buyer enters house (person action)
- Set flood insurance (person action)
- Set mortgage fee (house action)
- Update land values based on the made transaction (environment action)
- Person market run (environment action)
- Same actions as in developer market run above
- Bank market run (environment action)
- Same actions as in developer market run above
- Update building value based on the total of all made transactions (environment action)
- Developer market run (environment action)
- Now that the market is run the process bank action of the bank can be run. This needs to be done after the market because the bank needs to process the houses it just bought on the market. Within the action of processing the bank the following actions are run:
- Bank flood insurance set
- Bank maintain house
- Now the local government and developer actions are run. The process developer action of the developer will first be run so that they can pass information on proposed developments to the local government. Within the action of processing the developer the following actions are also run:
- Locate land for development (developer action)
- Decide to create development proposal (developer action)
- Evaluate development proposal (local government action)
- Develop housing (developer action)
- Finish house construction (developer action)
- Developer flood insurance set (developer action)
- Developer maintain houses (developer action)
- After the developer is processed the process local government action will be run. Within the action of processing the local government the following actions are also run:
- Collect property taxes (local government action)
- Collect flood protection Investment (local government action)
- Decide on building flood defences (local government action)
- Build flood defences (local government action)
Design concepts
Basic principles: The model takes a microeconomic model of a US double auction market, adapts it to the UK situation and extends it to include a more elaborate insurance system and a larger focus on the role of housing developments and the local government in regards to flood risk management.
Emergence: This model was designed to explore the reaction of a housing market to flood risk and the uptake of flood protection measures under different circumstances. Transaction prices and person selling behaviour are modelled as emerging behaviour resulting from changes in agent characteristics and the surrounding environment. Behaviour of the local government to invest in flood protection emerges from changing patterns of flood risk in the model. Investing in PLPMs is less emerging as it is based on set states and flood events, but becomes more so when different insurance scheme policies are tested in the model. Lastly, decisions of the insurer to place a person in Flood Re is emergent, resulting from changing flood risk patterns that lead to changing insurance premiums and excesses for the policy holder.
Adaptation: Home owners who proactively invest in PLPMs will experience less loss from a flood event. Home owners who reactively invest only see benefits when a second flood occurs. Home buyers that consider flood risk will not buy houses that have recently been flooded, putting them in less flood risk. Insurers react to a flood event by increasing the flood insurance excess of people hit by the flood, better covering their flood risk in the future. Based on the flood risk within its municipality the local government build flood defences to protect homeowners, lowering any damage from future flood events.
Objectives: Homebuyers want to get the best affordable property. Home owners want to live in a house they can afford for as long as possible and want to feel safe. Home sellers want to sell their house for a price higher than the houses market value. The insurer wants to make profit while providing everyone with affordable flood insurance. The developer wants to make a profit by selling houses for a higher price than the building cost them. The local government wants to protect people living in their municipality by building flood defences, and wants to keep up with the high housing demand set by the national government.
Learning: When a flood event occurs some people will invest in PLPMs. After a flood event the local government also invests in flood defences in the affected area.
Predictions: People invest in PLPMs and the local government invests in flood defences because they predict that a flood event will again occur in the future. The insurer calculates flood insurance premiums and excesses by predicting the probabilities of flood events occurring in the future. The developer develops houses by predicting the future demand for housing.
Sensing: Agents within the FloodRe model save all information that has previously been provided to them and they make decisions based on this. Besides this, every agent maximizes his utility, being able to perfectly calculate the result of every action. Information is complete and certain and agents behave in a rational way.
Interaction: Persons, the bank and the developer interact whit each other in the housing market when houses are sold and bought. People interact with the house they own to get information on its current state and value. When a person takes flood insurance he interacts with the insurer, after which the insurer interacts with the house to gather information on the basis of which the flood insurance premium and excess is set. The local government interacts with houses when it builds flood defences for them. The developer interacts with the local government when it wants a development proposal to be approved.
Stochasticity: Certain values of states are stochastically assigned to make it represent the variability within the real world.
Collectives: Houses are grouped into types, indicating whether the house is a flat, terraced, semi-detached or detached property. Based on market transactions the values of all houses of a certain type will be updated. Persons are grouped into homeowners, home seller and home buyers. Within the housing market the homebuyers and home sellers interact with each other.
Observation: Data is collected on an annual basis. Data gathered includes: House values; the number of houses put on sale and the reason for selling; flood risk; flood insurance premium and excess value; flood repair fees; the number of houses re-insured in Flood Re; the number of PLPM investments; and the number of houses for which flood defences are built. Average values are calculated based on the number of houses and people in the model. Data is analysed using the data analysis tool R.
Initialization
The initial set up environment consists of 95,561 houses that are placed on a grid according to GIS data. Every house gets a person assigned to them and a single insurer, bank, developer and local government are set up. This is the same in every simulation run.
The states the agents get assigned can however vary. Although most states are set the same every time for every agent, some states are stochastically assigned to allow the model to better represent the real world. This is done in places where limited information was available. For instance market values for each individual house are not know, just an average house value for each of the 4 house types in the study area. Because every house of the same house type does not have the same value every house gets a value assigned to it based on a normal distribution over this average.
A full overview of the description of the initialization of the model can be found in appendix D of Dubbelboer (2015) and the model code is also published on OpenABM (https://www.openabm.org/model/4647/version/1/view).
Input
The model uses data sets provided by the London Datastore; the Office for National Statistics; residential building data from Landmap (2014); derived data from the UK Buildings Residential Building Class Dataset[3]; surface water flood depth maps from the DrainLondon project led by the Greater London Authority; and flood depth-damage functions for short (<12hr) duration floods (Penning-Rowsell et al. 2010). Besides this many sources are used for assigning specific values to states of agents. A full overview of all input data and their sources can be found in appendix L of Dubbelboer (2015).
Submodels
Because of the size and complexity of the model the full process overview will not be given here. However, an extensive overview of all the behaviours in the model, their explanation and their pseudo code can be found in appendix D of Dubbelboer (2015). The model code is also published on OpenABM (https://www.openabm.org/model/4647/version/1/view).
Notes
- The GeoInformation group data ® copyright by The GeoInformation® Group, 2014 Licence No. 3786.
- We model houses as separate agents as they need to be able to behave independently from each other and the person agent. They respond to what is happening in the model even if they are not owned, such as being hit by a flood. A single patch can contain multiple houses, and a single building footprint multiple dwellings (e.g. a block of flats).
- The GeoInformation group data ® copyright by The GeoInformation® Group, 2014 Licence No. 3786.
References
ADAPTATION SUB-COMMITTEE. (2012). Climate Change - Is the UK preparing for flooding and water scarcity? London: Committee on Climate Change.
BEVAN, K., & HALL, J. (Eds.). (2014). Applied Uncertainty Analysis for Flood Risk Management. London: Imperial College Press.
BLANC, J., HALL, J. W., ROCHE, N., DAWSON, R. J., CESSES, Y., BURTON, A. & KILSBY, C. G. (2012). Enhanced efficiency of pluvial flood risk estimation in urban areas using spatial–temporal rainfall simulations. Journal of Flood Risk Management,5, 143-152. [doi:10.1111/j.1753-318X.2012.01135.x ]
BOTZEN, W. J. W. & VAN DEN BERGH, J. C. J. M. (2008). Insurance Against Climate Change and Flooding in the Netherlands: Present, Future, and Comparison with Other Countries. Risk Analysis,28, 413-426.
BROUWERS, L., & BOMAN, M. (2011). A computational agent model of flood management strategies. In H. A. do Prado, A. J. B. Luiz, & H. C. Filho (Eds.), Computational Methods for Agricultural Research: Advances and Applications (pp. 296–307). Hershey, PA, USA: IGI Global. [doi:10.4018/978-1-61692-871-1.ch014 ]
CAMDEN COUNCIL. (2013). Camden's housing strategy 2011-2016. http://www.camden.gov.uk/ccm/cms-service/download/asset?asset_id=2683563. Archived at: http://www.webcitation.org/6ZYDShmt4.
CAMDEN COUNCIL. (2015). Opportunity Areas. http://www.camden.gov.uk/ccm/content/business/starting-and-growing-your-business/about-camdens-economy/opportunity-areas-.en. Archived at: http://www.webcitation.org/6ZYD6sRkd.
CHANDRA-PUTRA, H., ZHANG, H., & ANDREWS, C. (2015). Modeling Real Estate Market Responses to Climate Change in the Coastal Zone. Journal of Artificial Societies and Social Simulation, 18(2) 18: https://www.jasss.org/18/2/18.html.
DAWSON, R. J., BALL, T., WERRITTY, J., WERRITTY, A., HALL, J. W. & ROCHE, N. (2011). Assessing the effectiveness of non-structural flood management measures in the Thames Estuary under conditions of socio-economic and environmental change. Global Environmental Change,21, 628-646. [doi:10.1016/j.gloenvcha.2011.01.013 ]
DEFRA (2008). Consultation on policy options for promoting property-level flood protection and resilience. London: Defra.
DEFRA (2011). Commencement of the Flood and Water Management Act 2010, Schedule 3 for Sustainable Drainage: Impact Assessment. London: Defra.
DEFRA (2013). Securing the future availability and affordability of home insurance in areas of flood risk. London: Defra.
DEFRA (2014). Flooding recovery: households and businesses applying for the Repair and Renew Grant Scheme. https://www.gov.uk/government/publications/flooding-recovery-households-and-businesses-applying-for-the-repair-and-renew-grant-scheme. Archived at: http://www.webcitation.org/6ZYEU6IbB.
DRAIN LONDON (2011). Surface Water Management Plan: London Borough of Camden: Camden Council.
DUBBELBOER, J. (2015). Structuring flood insurance in the UK: An assessment of the London market using Agent Based Modelling. Delft University of Technology.
EUROPEAN WATER ASSOCIATION. (2009). EWA Expert Meeting on Pluvial Flooding in Europe. Brussels: EWA.
FALCONER, R. H., COBBY, D., SMYTH, P., ASTLE, G., DENT, J., & GOLDING, B. (2009). Pluvial flooding: new approaches in flood warning, mapping and risk management. Journal of Flood Risk Management, 2(3), 198-208. [doi:10.1111/j.1753-318X.2009.01034.x ]
FILATOVA, T., PARKER, D., & VAN DER VEEN, A. (2009). Agent-Based Urban Land Markets: Agent's Pricing Behavior, Land Prices and Urban Land Use Change. Journal of Artificial Societies and Social Simulation, 12(1) 3: https://www.jasss.org/12/1/3.html.
FILATOVA, T., PARKER, D., & VAN DER VEEN, A. (2011). The Implications of Skewed Risk Perception for a Dutch Coastal Land Market: Insights from an Agent-Based Computational Economics Model. Agricultural and Resource Economics Review, 40(3), 405-423. [doi:10.1017/S1068280500002860 ]
FILATOVA, T. (2015). Empirical agent-based land market: Integrating adaptive economic behavior in urban land-use models. Computers, Environment and Urban Systems, 54, ¬397-413.
GREATER LONDON AUTHORITY (2009). London Regional Flood Risk Appraisal. London: GLA.
GREATER LONDON AUTHORITY (2011a). The London Climate Change Adaptation Strategy. London: GLA.
GREATER LONDON AUTHORITY (2011b). The London Plan: Spatial Development Strategy for Greater London. London: GLA.
GREATER LONDON AUTHORITY (2014). Flood risks in London: Summary of findings. London: GLA.
GREATER LONDON AUTHORITY (2015a). Drain London. http://www.london.gov.uk/drain-london. Archived at http://www.webcitation.org/6YIlgF36K.
GREATER LONDON AUTHORITY. (2015b). Ward profiles and atlas. http://data.london.gov.uk/dataset/ward-profiles-and-atlas. Archived at: http://www.webcitation.org/6Ze2kH8rz.
GREATER LONDON AUTHORITY. (2015c). 2015 round population projections. http://data.london.gov.uk/dataset/2015-round-population-projections. Archived at: http://www.webcitation.org/6hYBbc46S.
HALL, J. W., DAWSON, R. J., SAYERS, P. B., ROSU, C., CHATTERTON, J. B. & DEAKIN, R. (2003a). A methodology for national-scale flood risk assessment. Water & Maritime Engineering,156, 235-247.
HALL, J. W., MEADOWCROFT, I. C., SAYERS, P. B. & BRAMLEY, M. E. (2003b). Integrated flood risk management in England and Wales. Natural Hazards Review,4, 126-135. [doi:10.1061/(ASCE)1527-6988(2003)4:3(126) ]
HARRIES, T. (2012). The anticipated emotional consequences of adaptive behaviour - impacts on the take-up of household flood-protection measures. Environment and Planning A, 44(3), 649-668.
HOME CHECK (2012). National surveys reveal highly concerning results regarding flooding and flood risk: http://www.homecheck.co.uk/Article.do?articleId=15755.
HOUSE OF COMMONS ENVIRONMENT, FOOD AND RURAL AFFAIRS COMMITTEE (2013). Managing Flood Risk. Third Report of Session 2013–14. Volume I. London: The Stationery Office.
INMAN, P. (2014). Mark Carney: rising house prices pose biggest risk to recovery. http://www.theguardian.com/business/2014/may/18/mark-carney-house-prices-risk-economy-bank-of-england. Archived at: http://www.webcitation.org/6ZYBNuPnc.
IPCC (Ed.) (2013). Summary for Policymakers. In: Climate Change 2013: The Physical Science Basis. Contribution of Working Group I to the Fifth Assessment Report of the Intergovernmental Panel on Climate Change (Vol. 1). Cambridge: Cambridge University Press.
JENKINS, K., HALL, J., SURMINSKI, S., & CRICK, F. (2015). London Case Study: Flood risk and climate change implications for MSPs. ENHANCE deliverable 7.3: University of Oxford
JENKINS, K., SURMINSKI, S., HALL, J., &CRICK, F. (2016). Assessing surface water flood risk and management strategies under future climate change: an agent-based model approach. Centre for Climate Change Economics and Policy Working Paper No.252; Grantham Research Institute on Climate Change and the Environment Working Paper No.223.
LAMOND, J., PROVERBS, D., & HAMMOND, F. (2009). Flooding and Property Values. In S. Brown (Ed.), Findings in Built and Rural Environments (FiBRE). London: Royal Institution of Chartered Surveyors.
LAMOND, J., & PENNING-ROWSELL, E. (2014). The robustness of flood insurance regimes given changing risk resulting from climate change. Climate Risk Management, 2(1-10).
LANDMAP (2014). Building Class. http://learningzone.rspsoc.org.uk/index.php/Datasets/Building_Class/Download-Building-Class. Archived at: http://www.webcitation.org/6Ze3ANv4E.
MAGLIOCCA, N.R., BROWN. D.G., McCONNELL, V.D., NASSAUER, J.I., WESTBROOK., S.E. (2014). Effects of alternative developer decision-making models on the production of ecological subdivision designs: experimental results from an agent-based model. Environment and Planning B: Planning and Design, 41(907-927).
MCNAMARA, D.E., KEELER, A. (2013). A coupled physical and economic model of the response of coastal real estate to climate risk. Nature Climate Change, 3(559-562). [doi:10.1038/nclimate1826 ]
ONS (2014). 2011 Census: Internal and international migration for the United Kingdom in the year prior to the 2011 Census. Office for National Statistics: London. Archived at: http://www.webcitation.org/6hYb2MBBK.
PARKER, D.C., SUN, S., FILATOVA, T., MAGLIOCCA, N., HUANG, Q., BROWN, D.G., RIOLO, R. (2015). The implications of alternative developer decision-making strategies on land-use and land-cover in an agent-based land market model. International Congress on Environmental Modelling and Software Managing Resources of a Limited Planet, Sixth Biennial Meeting, Leipzig, Germany.
PENNING-ROWSELL, E., PRIEST, S., & JOHNSON, C. (2014). The evolution of UK flood insurance: incremental change over six decades. International Journal of Water Resources Development, 30(4).
PENNING-ROWSELL, E., VIAVATTENE, C., PARDOE, J., CHATTERTON, J., PARKER, D., & MORRIS, J. (2010). The Benefits of Flood and Coastal Risk Management: A Handbook of Assessment Techniques. London: Flood Hazard Research Centre.
PITT, M. (2008). Learning Lessons from the 2007 Floods, The Pitt Review. London: Cabinet Office.
PRUDENTIAL REGULATION AUTHORITY. (2015) The impact of climate change on the UK Insurance sector. Prudential Regulation Authority: London.
RAMSBOTTOM, D., SAYERS, P., & PANZERI, M. (2012). Climate Change Risk Assessment for the Floods and Coastal Erosion Sector. UK Climate Change Risk Assessment. London: Defra.
SOBIECH, C. (2013).Agent-Based Simulation of Vulnerability Dynamics: A case study of the German North Sea Coast. Berlin: Springer-Verlag Berlin Heidelberg. [doi:10.1007/978-3-642-32365-2 ]
SURMINSKI, S., & ELDRIDGE, J. (2015). Flood insurance in England – an assessment of the current and newly proposed insurance scheme in the context of rising flood risk. Journal of Flood Risk Management, Online Advance Access.
THURSTON, N., FINLINSON, B., BREAKSPEAR, R., WILLIAMS, N., SHAW, J., & CHATTERTON, J. (2008). Developing the evidence base for flood resilience. London: Defra.
ULBINAITĖ A., KUČINSKIENĖ, M., & LE MOULLEC, Y. (2011). Conceptualising and Simulating Insurance Consumer Behaviour: an Agent-Based-Model Approach. International Journal of Modeling and Optimization, 1(3), 250-257.
ULBINAITĖ, A., & LE MOULLEC, Y. (2010). Towards an ABM-based framework for investigating consumer behaviour in the insurance industry. ekonomika, 89(2), 95-110.
VAN DAM, K. H., NIKOLIC, I., & LUKSZO, Z. (Eds.). (2012). Agent-based modelling of socio-technical systems. Netherlands: Springer.
WILENSKY, U. (1999). NetLogo Software. Available at http://ccl.northwestern.edu/netlogo. Last Accessed June 2015.
WYNN, P. (2005). Development control and flood risk: Analysis of local planning authority and developer approaches to PPG25. Planning, Practice & Research, 20(3), 241-261.