
Introduction
Science as a social process has been the topic of agent-based models (from now on, ABM) studies for a long time. The model covered aspects of the research organization and activities. For instance, a lot of attention has been paid to citation networks and bibliometric statistics (Watts et al. 2011; Zhou 2012; Simkin et al. 2003; Simkin et al. 2006) and the peer review process (Cabotà et al. 2014; Sobkowicz 2015; Squazzoni et al. 2012; Squazzoni et al. 2013; Squazzoni el al. 2011; Kovanis et al. 2016; Paolucci et al. 2014; Roebber et al. 2011). More general models have examined the emergent behavior of the scientific community, including aspects such as: new knowledge creation, spontaneous grouping of the research interests into loosely connected domains and the time evolution of the communities and domains (Baier 2012; Bramoulle 2010; Gilbert 1997; Gilbert et al. 2005; Gu et al. 2015; Payette 2011; Payette 2012; Sobkowicz 2011; Vitanov et al. 2012; Zollman 2007), as well as the effects of funding (Gerard et al. 2010; Bentley 2009 ) and bias (Allesina 2012). Bailetti (2015) have studied fragmentation of the disciplines with the goal of understanding the forces driving it[1].
The present work aims to combine several phenomena in a flexible, integrated model. The main focus is on the evolution of the interests of the research community through the decisions of individual scientists, driven by the availability of the funding and curiosity. The former is dependent on the policies of funding agencies and companies involved in R&D activities. These policies largely correspond to the perceived needs of the society and industry in general. A perfect example of such subordination of the research funding to the needs of the industrial leadership and to tackling societal challenges are the principles of the current Horizon 2020 European Community framework. In many cases, the 'industry-driven' research is rather technical and incremental, offering few opportunities for scientific breakthroughs -- for example research devoted to gradual improvements of some specific material properties. At the same time, there are domains where the connection between truly astonishing discoveries of basic science and their innovative applications is immediately perceived (for example, the developments around CRISPR/Cas9[2]).
Discussing the utility and societal impact dependent funding decisions, we should remember that the scientists are, by and large, very intelligent people. They are capable of influencing (not to say manipulating) the system. After all, the senior researchers often serve on the very committees that decide the funding allocation, or, at the very least, on important advisory boards. Any discussion of the science related appropriations should, therefore, include the effects of lobbying, as well as the advantage that one research community or domain may get over the others, less effective in their lobbying efforts. This leads to situations where the amount of funding devoted to specific topics and technologies exceeds not only the short term application revenues, but also long term estimates of future benefits. In some cases, such over-funding is due to a natural interest in the topic, in some others it is a result of a successful lobbying (an example is readily provided by the graphene research)[3].
The decisions of individual scientists and research teams regarding the choice of topics are not based solely (or even predominantly) on funding availability. Curiosity, desire to make a lasting contribution and for recognition are just as important. Therefore it is fortunate that not all research policies are decided with utility and impact in mind. Some research fields are still driven by excitement due to breakthrough, paradigm-changing discoveries. Scientists are sometimes able to convince the governments or companies that some domains of basic research, even those without a visible link to the economic growth, are still worthy of increased attention and funds. The recent experimental discovery of gravitational waves may serve as an example. The 'fertility' of a research field, measured by the expectations for such attention-grabbing discoveries, is an important factor when choosing the career paths of young scientists, and weighs in decisions related to funds distribution, especially in basic science. There are numerous examples of research directions that gain popularity (and research jobs) because they are 'fashionable'. In some cases, these fashions, leading to the virtual exclusion of the competitive investigation routes, have attracted bitter criticism and heated discussions (for example in the case of the string theory and its criticisms, Smolin 2006; Woit 2006).
The financial landscape, determined by the interplay of the forces described above (as well as others, not mentioned) is superimposed on the epistemic landscape (Ahrweiler et al. 2015). The concept is rather vague and may differ between 'large-scale' disciplines. The scope of a single domain in the epistemic landscape would likely be different for physics, biology or sociology. Weisberg el al. ( 2009) have focused on a scale where a domain corresponds to the topic that a specialized research conference or advanced level monograph might be devoted to. While not always applicable, this is also a reasonable unit at which the funding preferences can be recognized, so it provides a natural common ground for combining the financial interests and the research subjects. The connections between the domains are rather complex and multidimensional, involving the similarity of the conceptual base, research tools and equipment, hierarchical dependence of the concepts, etc. Despite this complexity, the visual representation of the domain relationships as a simple two-dimensional map on which some of them are close to each other while others are more distant has the obvious advantage of easy, if not accurate, understanding. It allows to visualize the domain characteristics, including the amount of funds available, the number of scientists working on the related topics etc., so it is most useful for modeling purposes.
Looking at these complex problems also requires to consider the individual decisions of scientists, who are typically faced with the challenges of combining the desire to conduct meaningful and interesting research with the necessities of securing funds. The diminishing 'success ratio', observed in most funding programmes, with the number of funded proposals falling sometimes below single digits forces researchers to make tough decisions. Should they continue to try, yet again, to submit proposals in their current domain, or should they change the direction, learn new skills and move to a 'neighbouring' one, which might offer better chances of success? Because the effects of these individual decisions take some time before bearing fruit, they may lead to all kinds of phenomena found in the classical studies of population dynamics, such as cyclical changes in 'population' of research disciplines or overgrazing effects. Our goal is to introduce a model that is simple enough to allow a meaningful play with the parameters describing various aspects of the processes described above, yet rich enough to include the most important factors.
Conceptual model description
Let us start by presenting a drastically simplified, conceptual model. The research landscape has no relation to the real world of disciplines, sub disciplines, and topics. The aim of the conceptual model is to introduce and describe the individual dynamics of scientist decisions, the parameters governing their behaviour and the resulting global behaviour of the system. Of course, the results of such model may bear only weak qualitative resemblance to the observed statistical trends in the real world.
We will first present the groundwork for an application of the dynamics tested in the conceptual model and then turn to a realistic research landscape and discuss the remaining requirements for a full-scale model.
Abstract research domains
As noted in the introduction, the current model is built from two core components: research domains and individual scientists. In contrast to models focusing on creation of separate research fields due to the underlying similarities and differences of the studied topics, such as the classical model of Gilbert with his concept of 'kenes' (Gilbert 1997), we are going to assume the existence of a certain number of related but distinct domains, located in a simple square grid topology on a 2D surface. Topics and research tools of the neighboring domains allow a scientist to move from one to a neighbour (Moore neighbourhood), with a minimal disruption of the research career (we assume that one year has to pass before the scientist can successfully apply for a research grant in the new domain).
Each domain \(D\) characterized, at time \(t\), by its capacity to attract funding \(V_{TOT}(D,t)\) (research potential), which is a sum of three components. The first is the domain utility or impact on economic or societal needs, \(V_U(D)\). To simplify the situation we assume that \(V_U(D)\) is constant over time, an assumption that is obviously not true for longer time periods. The importance and the economic impact of many research fields change over time, increasing or decreasing in accordance with social needs, external technological advances enabling progress and political factors such as wars. We note that technically it is possible to extend the model to any form of the time dependence of the parameters, but these would be probably different in different disciplines and social environments. \(V_U(D)\) are distributed randomly from a uniform distribution ranging between \(V_{Umin}\) and \(V_{Umax}\).
The second component to the research potential at time \(t\) is due to the effects of the crucial discoveries made in the domain \(D\), \(V_{CD}(D, t)\). Each domain 'contains' a finite number of such discoveries to be made \(L_{cruc}(D,t)\), distributed initially randomly in a uniform fashion between zero and \(L_{cruc}^{max}\). The initial value of \(L_{cruc}(D,0)\) is 'unknown' to both the scientists and the funding agency. The decisions are based on the actual number of such breakthrough discoveries made in each year, \(L_{cruc}^{act}(D,t)\).
The two components of the research potential, \(V_U(D)\) and \(V_{CD}(D, t)\), are treated as independent. This reflects a dual vision of the motivation to conduct and support research. Curiosity driven research is determined by \(V_{CD}(D, t)\), via the chances of making significant discoveries, as perceived by the scientists. On the other hand, the utility potential \(V_U(D)\) corresponds to the public and governmental perception of the contribution that the discipline \(D\) can bring to economy or societal well being. Various combinations of high/low values of \(V_U(D)\) and \(V_{CD}(D, t)\) are possible. For example, astrophysics or archeology belong to the class of curiosity driven, low utility value topics. Technical studies of machine manufacturing or soil science are mainly utility driven. Modern biology and biochemistry offer examples of disciplines where there are many fundamental discoveries and, at the same time, important contributions to medicine.
Within the model value of \(V_{CD}(D, t)\) is determined in the following process. Once the number of crucial discoveries made in a given year \(L_{cruc}^{act}(D,t)\) passes a threshold value \(L_{cruc}^T\), the domain 'grabs the attention' of the research community (and the funding agencies) and \(V_{CD}(D, t)\) jumps from zero to \(T_F V_{CD}\), where \(V_{CD}\) is an adjustable model parameter and \(T_F\) denotes the fashion multiplier. The fame of the domain is not permanent, however. A fashionable patch will decrease its appeal if the number of the crucial discoveries made in a year falls below \(L_{cruc}^T -2\). In such case the value of \( T_F \) is decreased by one. Thus, a single 'miraculous' year, with no repeated significant advances can 'ensure' a linearly diminishing appeal, lasting at most \( T_F \) years. On the other hand, if \(L_{cruc}^{act}(D,t) \geq L_{cruc}^T -2\), the decay process is stopped, and if \(L_{cruc}^{act}(D,t)\) once again passes the \(L_{cruc}^T\) value, the fashion multiplier is reset back to the maximum value. Thus, truly 'fruitful' disciplines have a lasting advantage.
The third component in the determination of the research potential is due to the effects of lobbying. The lobbying process works as follows. If the number of the senior scientists \(N_S(D,t)\) in the domain is greater than a clique size threshold \(N_C\) and, at the same time, at least one breakthrough discovery has been made (so that the lobbyists have a 'story' to narrate), then with a probability \(p_L\) the domain may achieve a special status. In such a case, there is an additional component to the research potential, \(V_L(D,t)\), which is set at \(V_L\), another model parameter. For domains without the special status \(V_L(D,t)=0\). As with fashion, the special status obtained via lobbying is not permanent. It vanishes if the number of the senior scientists falls below a minimum clique size value \(N_C^{min}\) or if more than \(T_0\) years pass without any crucial discovery is made. In both cases, the modelled behaviour aims at reproducing the necessary conditions for a clique to successfully portray the domain as an important and active one. The total research potential is thus:
| $$ V_{TOT}(D,t) = V_U(D) + V_{CD}(D,t) + V_L(D,t). $$ | (1) |
Agents' characteristics
Agents representing scientists are relatively simple. There are \(N_{TOT}(t)\) scientists at any time \(t\). Each one is characterized by age and seniority status. An agent starts as a junior scientist, and if no crucial discoveries are made, it attains seniority after \(Y_S\) years. Thus for each domain the total number of the scientists is \(N_{TOT}(D,t) = N_S(D,t)+N_J(D,t)\). If a junior scientist makes a breakthrough discovery, it receives the senior status immediately. All agents retire at the age of \(Y_R\), and in their place, new junior agents are brought into the system.
Another source of the 'churn' in the agent population is the 'starvation' due to the lack of success in obtaining funding. If an agent does not receive funding for more than \(Y_Q\) years it quits the research community (looking for another job) and is replaced by a new junior agent.
In addition to replacements, there are new agents entering the system, so that the total number grows exponentially \(N_{TOT}(t) = N_{TOT}(0) (1+r_S)^t\), with the growth rate \(r_S\) being a model parameter.
The new agents and the replacements are distributed among the patches in the following way. Certain fraction \( f_F \) follows the combined effects of utility, fashion, and lobbying, and are distributed randomly among ten domains with the highest research potential \( V_{TOT}(D,t) \) . The remaining ones do not look for the research potential maxima, but are, instead, distributed randomly among all domains where there is at least one senior scientist. The two classes correspond to the 'active' and 'passive' career movement of young researchers. The active ones are those who evaluate the funding chances and the current fashions, while the passive ones rely on the guidance of their tutors and PhD advisers, and follow the local interests of their universities.
Discovery process
The research process that leads to discoveries is relatively simple in our model. At any time, all agents have a chance of making a discovery. The word should be understood very broadly, and we divide the discoveries into two classes: ordinary ones (leading to 'normal', low-impact papers) and the breakthrough, crucial discoveries, leading to a large number of citations and boost in both the individual career and the interest in the research topic. There are several possible situations.
- A junior agent with funding makes a discovery with a probability of \(p_{norm}\) .
- A senior agent with funding makes a discovery with a probability increased by a factor \(k_S > 1\), thus the probability becomes \(k_S p_{norm}\) .
- For any agent (senior o junior) working without funding, the probability of making a discovery is decreased by a factor \(k_U < 1\).
- The chance that the discovery is a crucial one is given by \(L_{cruc}(D,t)/L_{normalize}\), where the denominator \(L_{normalize}\) is greater than the maximum possible value of the number of crucial discoveries within a domain, \(L_{cruc}^{max}\), introduced in Section 2.5. The remaining discoveries are considered ordinary.
Each time a crucial discovery is made in domain \(D\), the remaining number of \(L_{cruc}(D,t)\) is decreased by one. Thus the chances of making a breakthrough discovery diminish in time.
Funding distribution
The model assumes an exponentially growing amount of funding available, given by \(M_{TOT}(t) = M_{TOT}(0) (1+r_M)^t\), with \(M_{TOT}(0)\) defined in 'grant units', sufficient to fund a scientist for a period of two years (grant duration), and \(r_M\) being another model parameter.
This amount is divided among the patches according to the equation:
| $$ M(D,t) = M_{TOT}(t) \frac{V_{TOT}(D,t) N_{TOT}(D,t)}{\sum_D V_{TOT}(D,t) N_{TOT}(D,t)}. $$ | (2) |
Domains with no scientists receive no funds. Domains with the same number of scientists may receive different amounts, due to differences in \(V_{TOT}(D,t)\), which means that the success ratio in obtaining funding would be different.
Once funding is distributed among the domains, agents may submit research proposals. The proposals are submitted by 'eligible' scientists, i.e. those who are not in a midst of a running a project, or those who have just migrated to a new domain and are 'learning new tricks' (see Section 2.20). The model does not distinguish between 'good' and 'bad' proposals, and the individual success histories, and assumes random award distribution between the applicants of the same type (junior/senior). Therefore, there is no provision for quality improvement, grantsmanship and learning -- with the sole exception that the senior agents have their chances increased by a 'seniority advantage factor' \(Z_S\), (\(Z_S > 1\)). If we denote the numbers of eligible senior and junior agents in the domain \(D\) by \(N_{S,E}(D,t)\) and \(N_{J,E}(D,t)\) then the probability of getting a grant by a senior scientist is
| $$ p_{S,E}^{grant} = \frac{M(D,t) Z_S}{Z_S N_{S,E}(D,t) + N_{J,E}(D,t)}, $$ | (3) |
| $$ p_{J,E}^{grant} = \frac{M(D,t)}{Z_S N_{S,E}(D,t) + N_{J,E}(D,t)}. $$ | (4) |
We remind here that it is possible to conduct research without funding, albeit with lesser chances of success.
Agent migration
As already noted, unlucky agents who do not get their proposals approved for more than \(Y_Q\) years are forced to quit the research. But even before this happens, the agents may change their 'strategy'. Some (chosen randomly among the unfunded ones with a probability \(1-p_{M}\)) remain in the same domain and re-apply for funding the next year. Others (probability \(p_M \)) decide to migrate to a neighbouring domain, facing a loss of a year in applying for funding due to the necessary training, but perhaps facing a decreased competition later on.
As in the case of new agents, migrating agents may either follow their evaluation of the chances offered by other disciplines or simply move randomly. Therefore, a fraction \(f_F\) of migrants picks the neighbouring domain with the highest research potential, while the remaining ones just pick a random neighbouring domain, including the 'empty' ones.
Time evolution and starting conditions
The time evolution happens in discrete steps, each corresponding to a year. Each year the following actions are performed:
- Updating the domain characteristics, in particular, the research potential and allocation of funds
- Distribution of grants among the scientists
- Conducting the research
- Recalculation of the fashions among the domains according to the discoveries
- Migration of unlucky scientists, ageing and retirement
For the simulations reported in this work, we have chosen a specific form of the initial conditions, designed to mimic an expanding research field in which there are many 'virgin' research domains. At time \(t=0\) agents are randomly distributed among a central patch of the epistemic landscape (covering about \(1/4\) of its total area). We also assume that the starting age distribution is uniform. The latter choice most likely overestimates the number of senior scientists, but as the time passes it quickly evolves to a pattern in which the number of scientists decreases with age.
Model implementation
The model architecture fits perfectly with the conceptual framework of the NetLogo modelling environment (Wilensky 1999). The two-dimensional research domains landscape corresponds directly to NetLogo patches, the agents representing the scientists to NetLogo turtles, ticks allow an efficient time evolution description. This has made the implementation of the model relatively quick. Moreover, the flexibility of the language makes further extensions possible. The NetLogo code of the model will be made publicly available.
Conceptual model results
The number of parameters of the model and flexibility in choosing their values allows simulating a broad range of situations. Depending on the relative values of the parameters determining the relative size of the components to the research potential \(V_U(D)\), \(V_{CD}(D,t)\) and \(V_L(D,t)\), the agents group in different domains, in accordance with the natural intuition of 'following the money'.
Figure 1 compares the situation in year 1 and year 10 for a rather small landscape. The bright squares indicate fashionable domains, while the magenta ones indicate domains successfully lobbied for. These domains attract significantly larger numbers of agents than the neighboring ones.
Figures 2--4 present examples of results obtained for a much larger system, after 50 years of the evolution, with higher growth rates for both funding and the number of scientists, \(r_M=0.006\) and \(r_S=0.02\). Figure 3 shows the exponential dependence of the number of discoveries made by the scientists.
After a sufficiently long time the domain funding follows approximately power-law distribution, the scientists age an exponentially decreasing one, while the relation of the average number of scientists in a domain and its research potential may be approximated by a shifted power law (Figure 4).
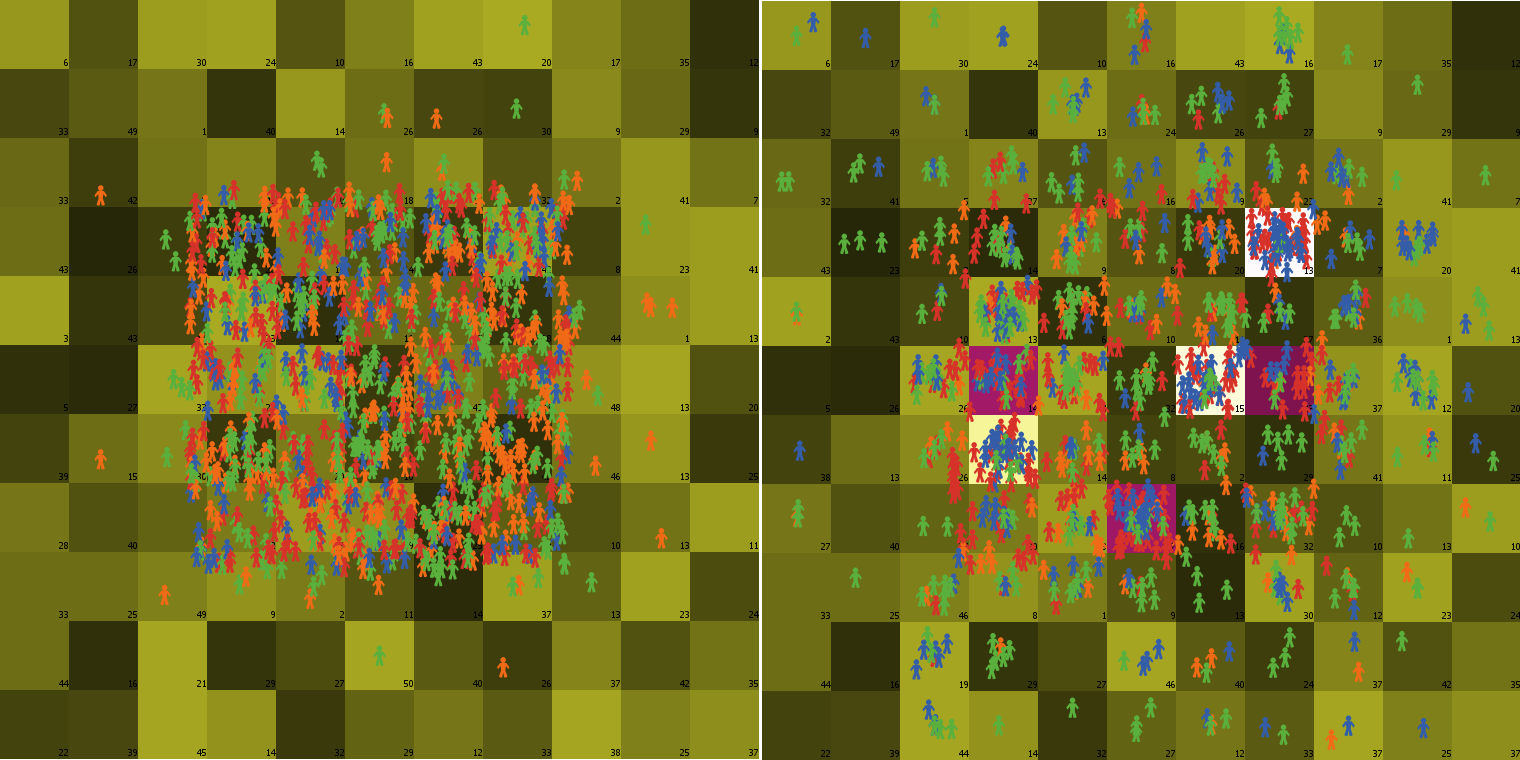
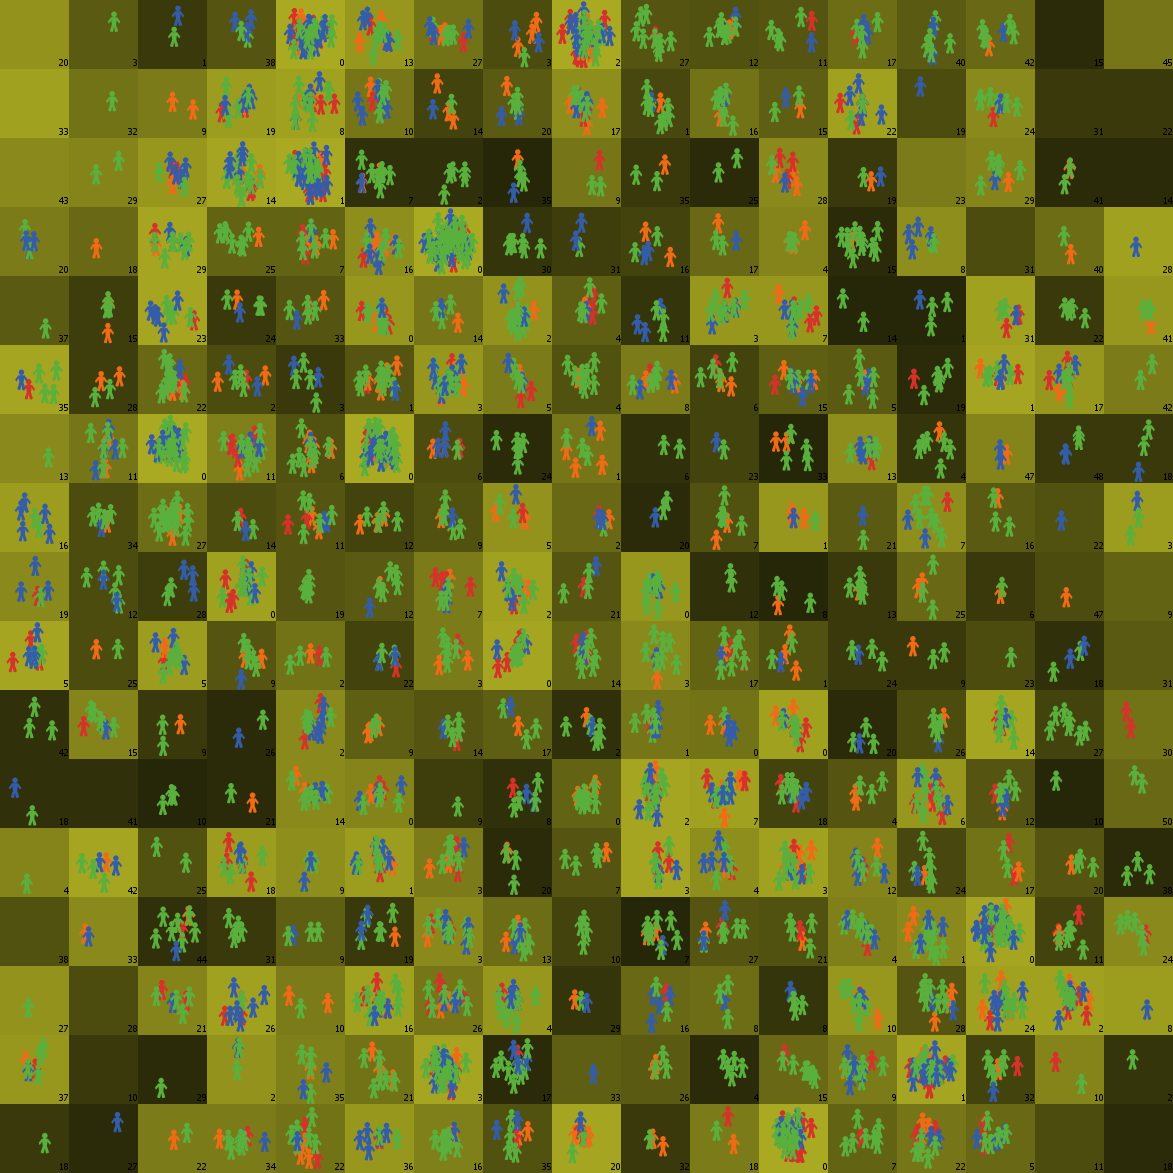
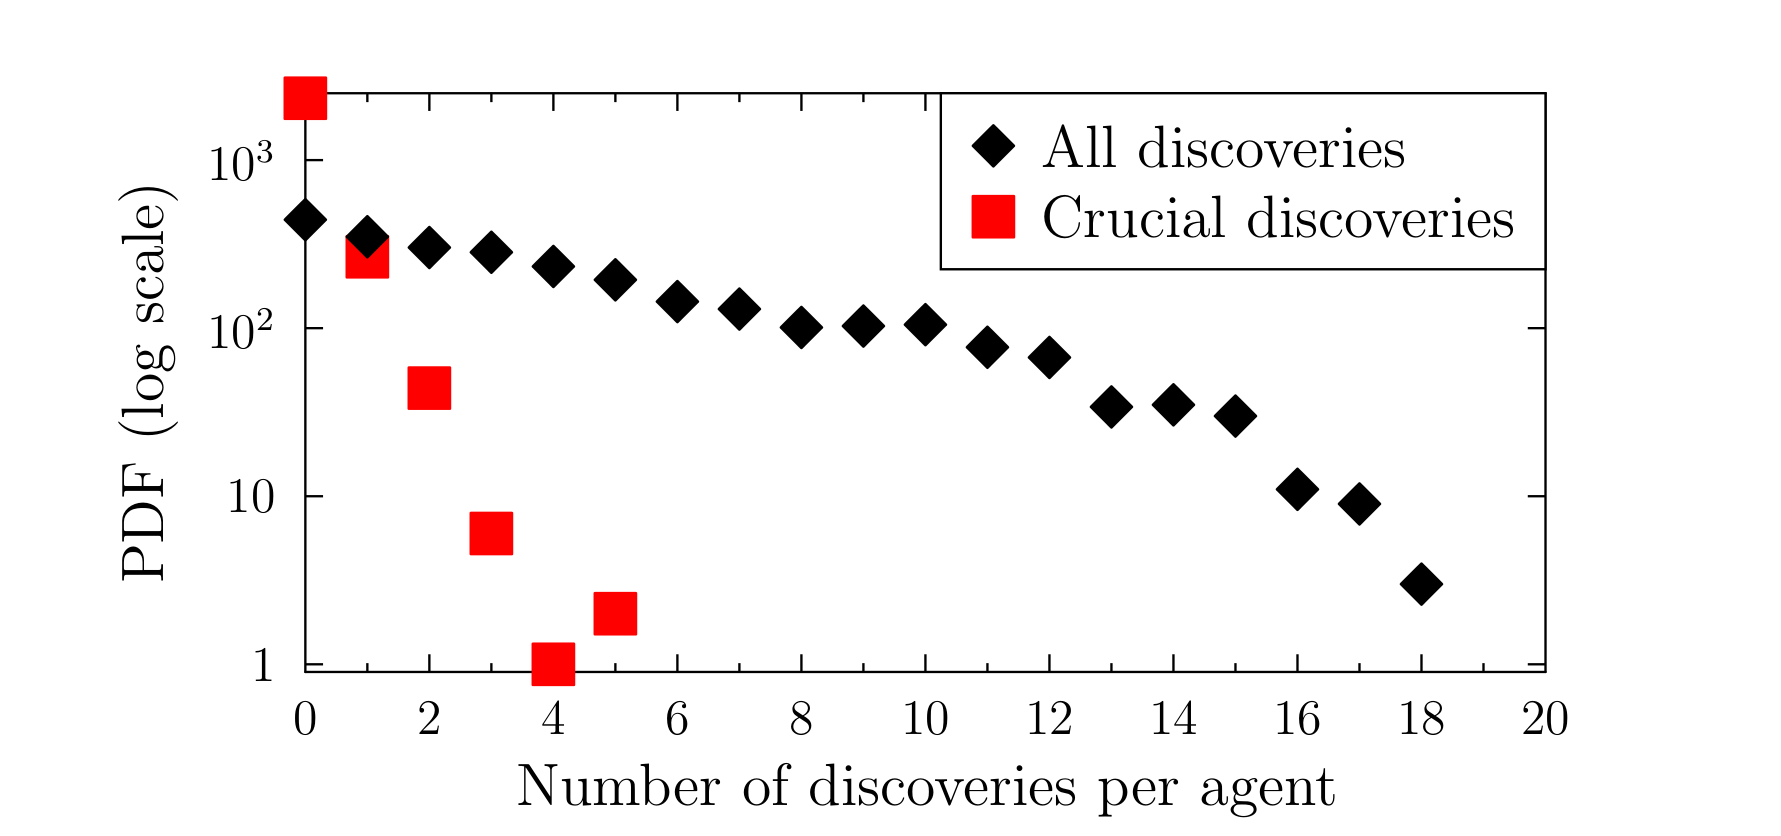
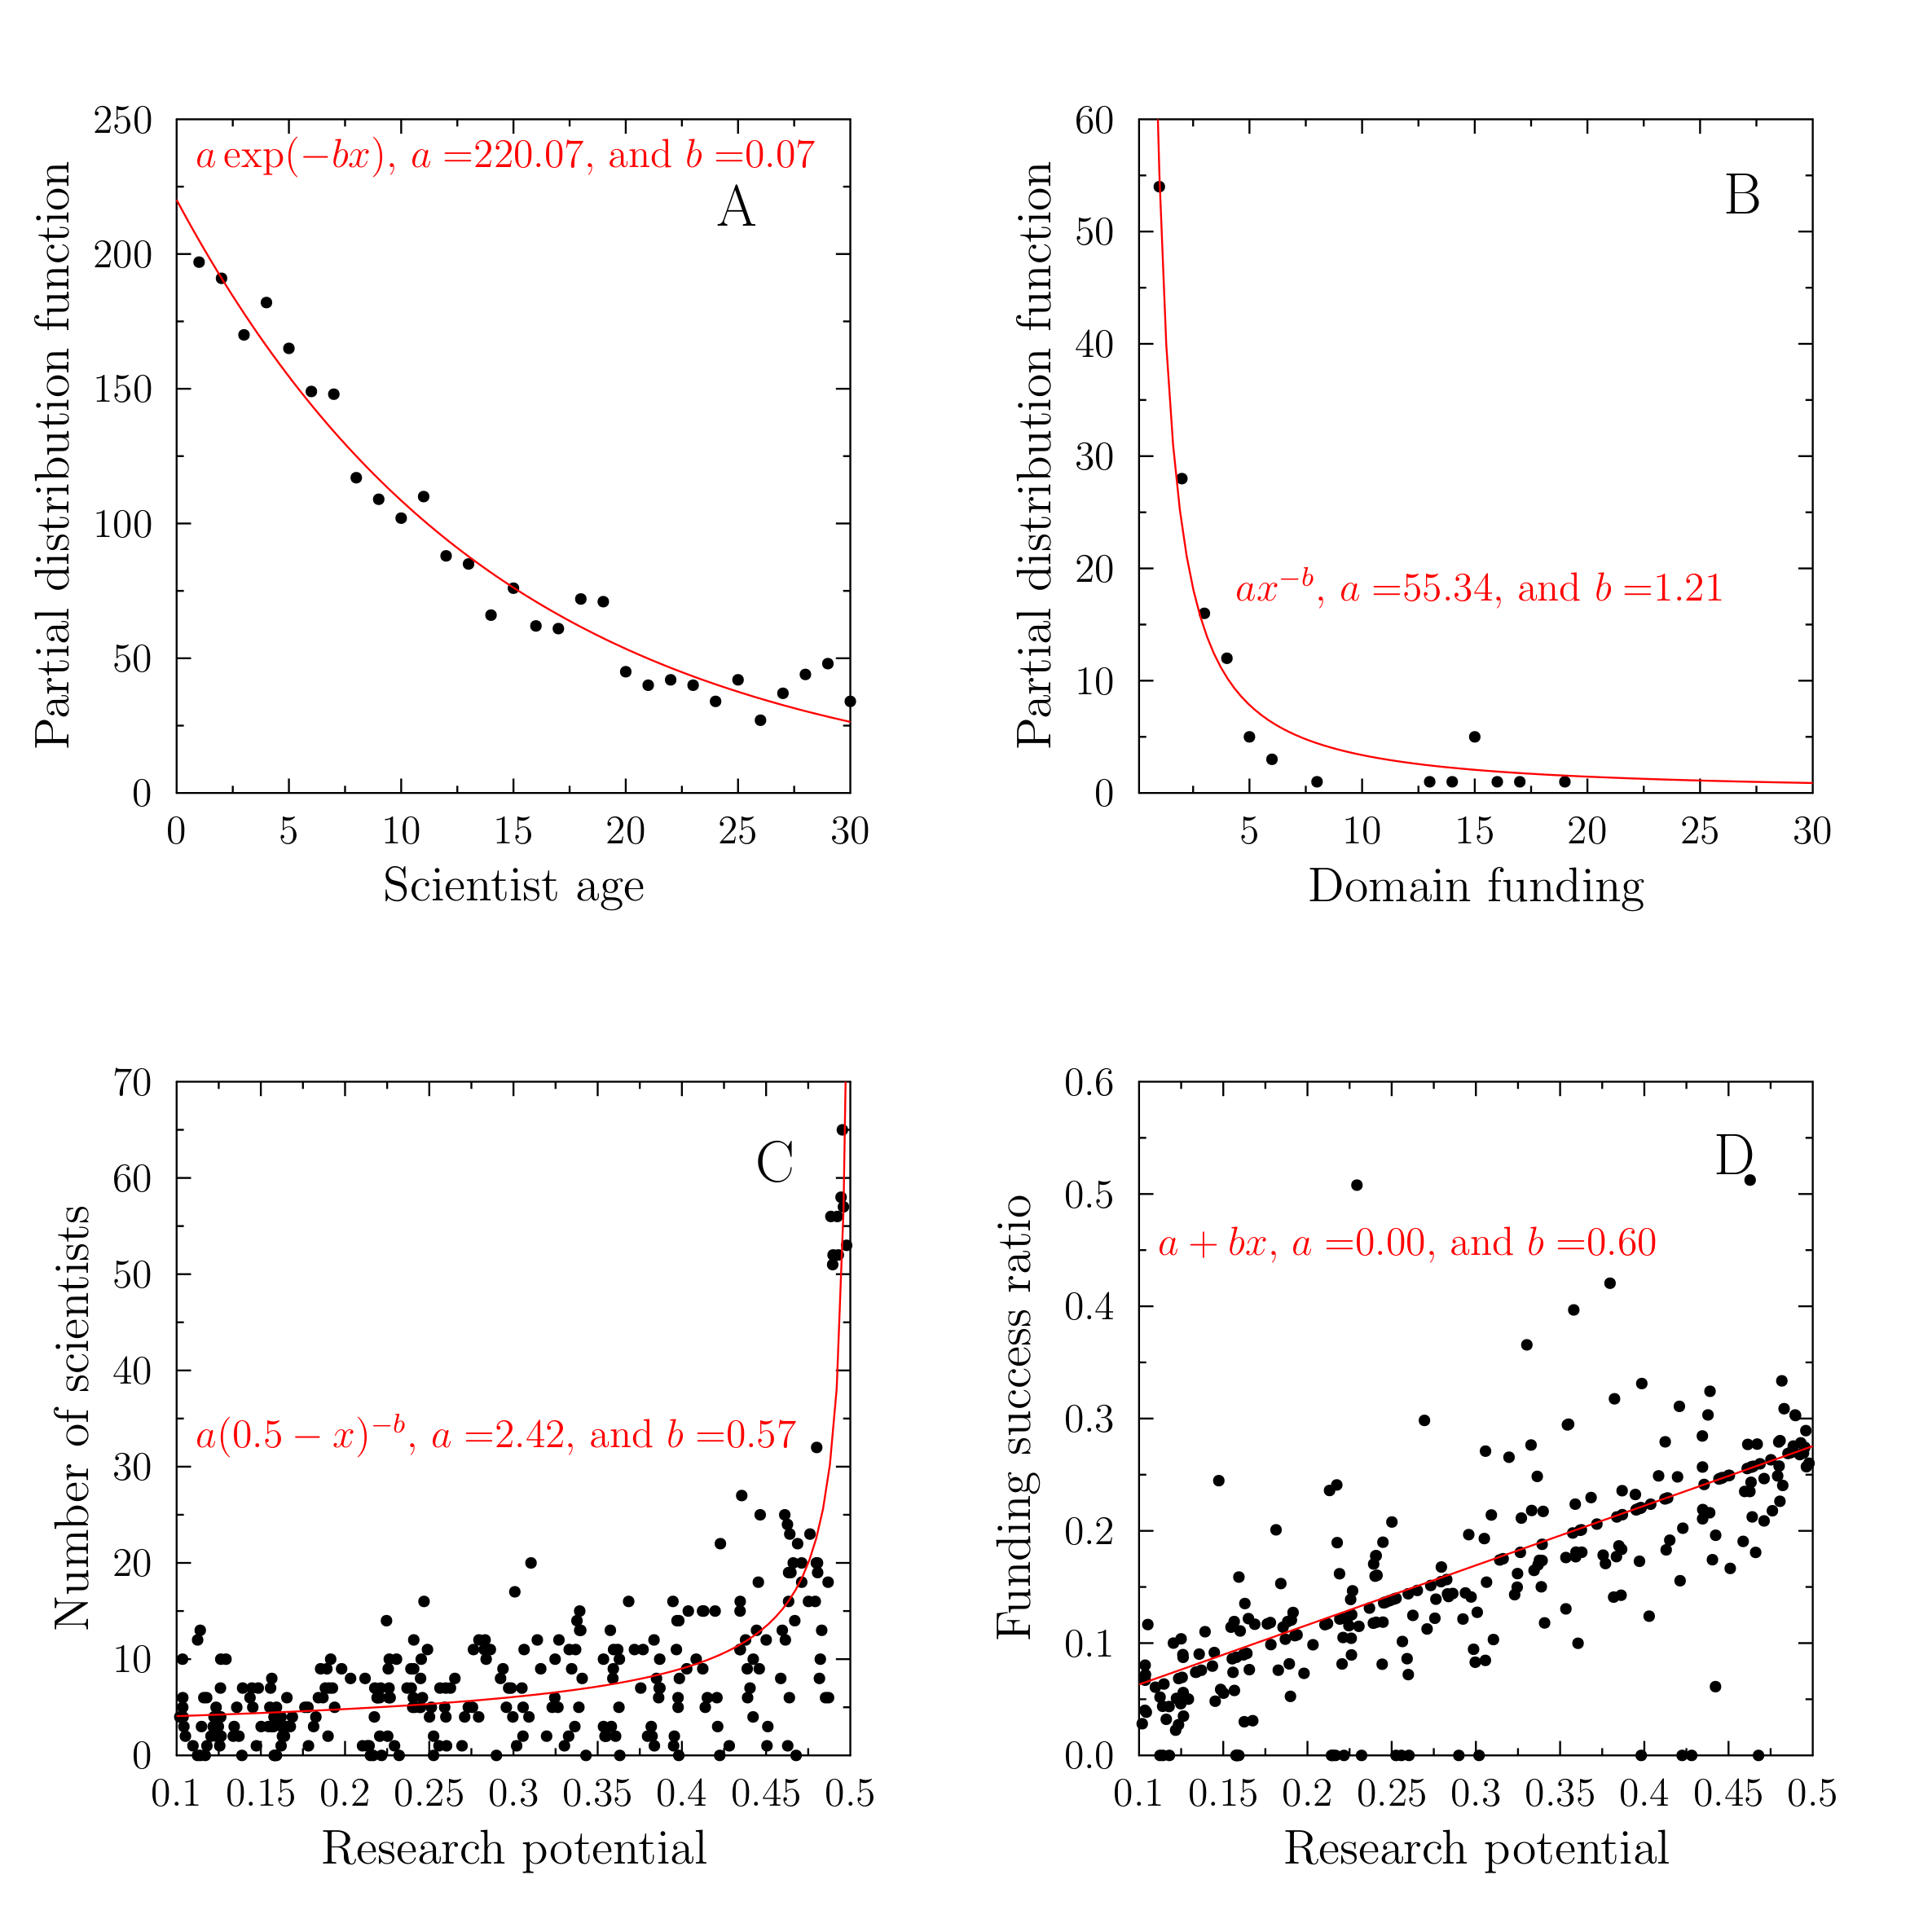
Figure 5 presents examples of time evolution of the number of scientists working in a domain, depending on its research potential. Panel A shows a topic which is initially not populated, but because of a relatively high \(V_U(D)\) value, it gains some popularity during the first ten years. At \(t=10\), thanks to crucial discoveries, it becomes fashionable (increasing the total \(V_{TOT}(D,t)\) value). At \(t=23\), in addition to the slowly dropping fashion appeal, the topic becomes successfully lobbied for. The resulting high values of the total research potential lead to very high popularity of the topic, persisting in time many years after the period of the crucial discoveries. Such behaviour would suggest that the abstract model domain offers a good representation of mature, fruitful topic, in which an initial spurt of high importance works leads to a steady stream of incremental research.
In contrast, panel B of Figure 5, presents the evolution of the research potential and popularity of a topic with a low value of \(V_U(D)\), losing the initial popularity rather quickly and becoming rather obscure.
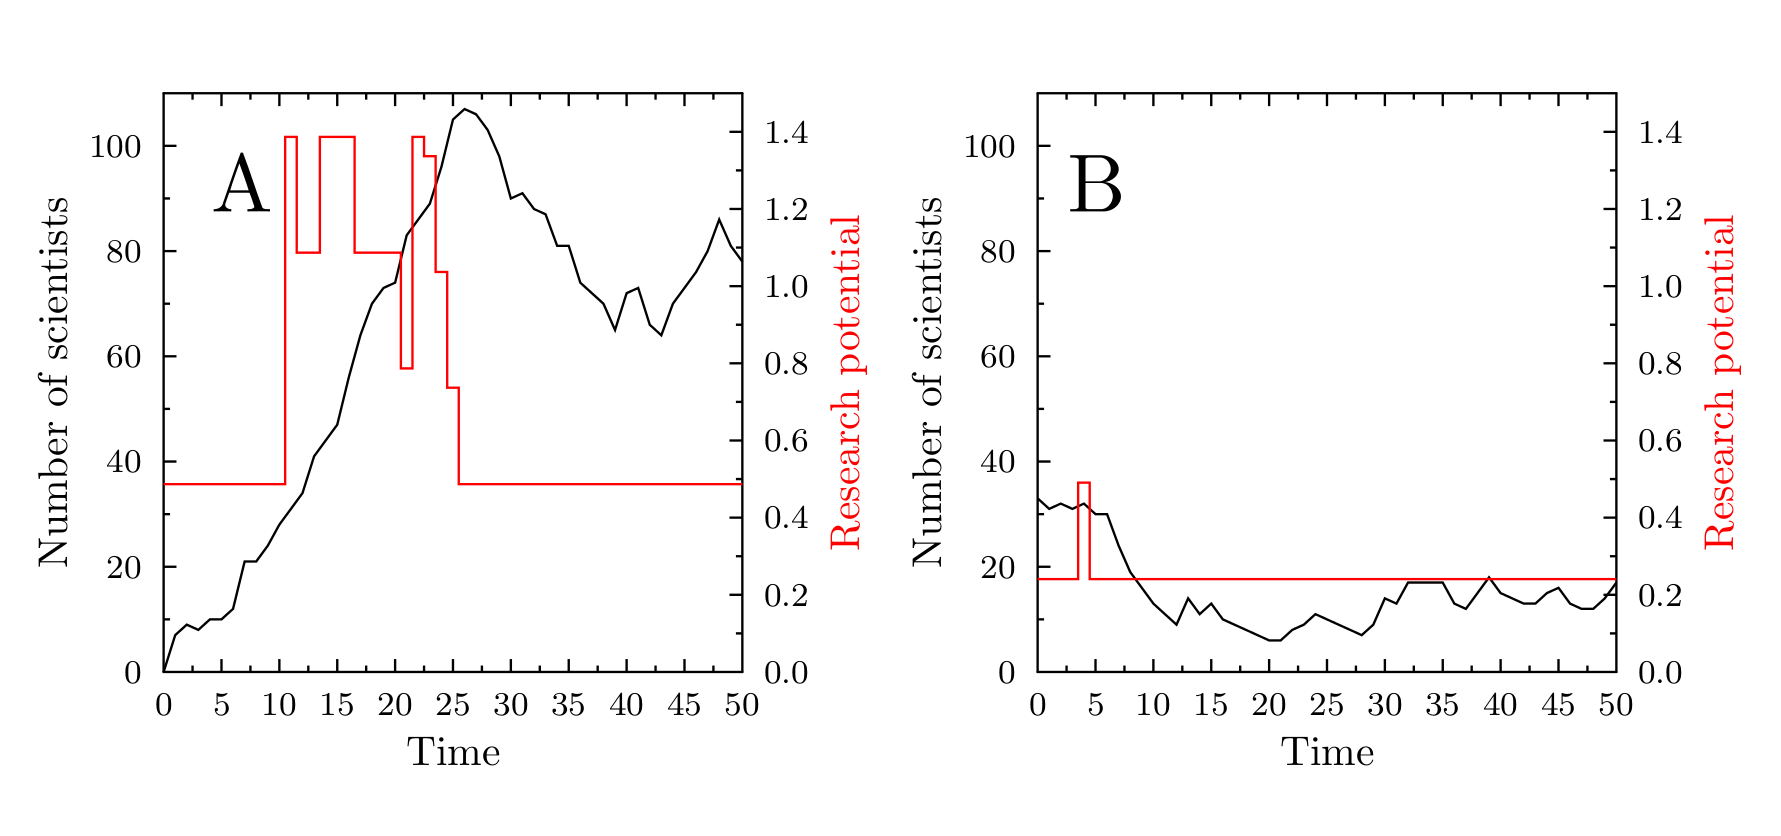
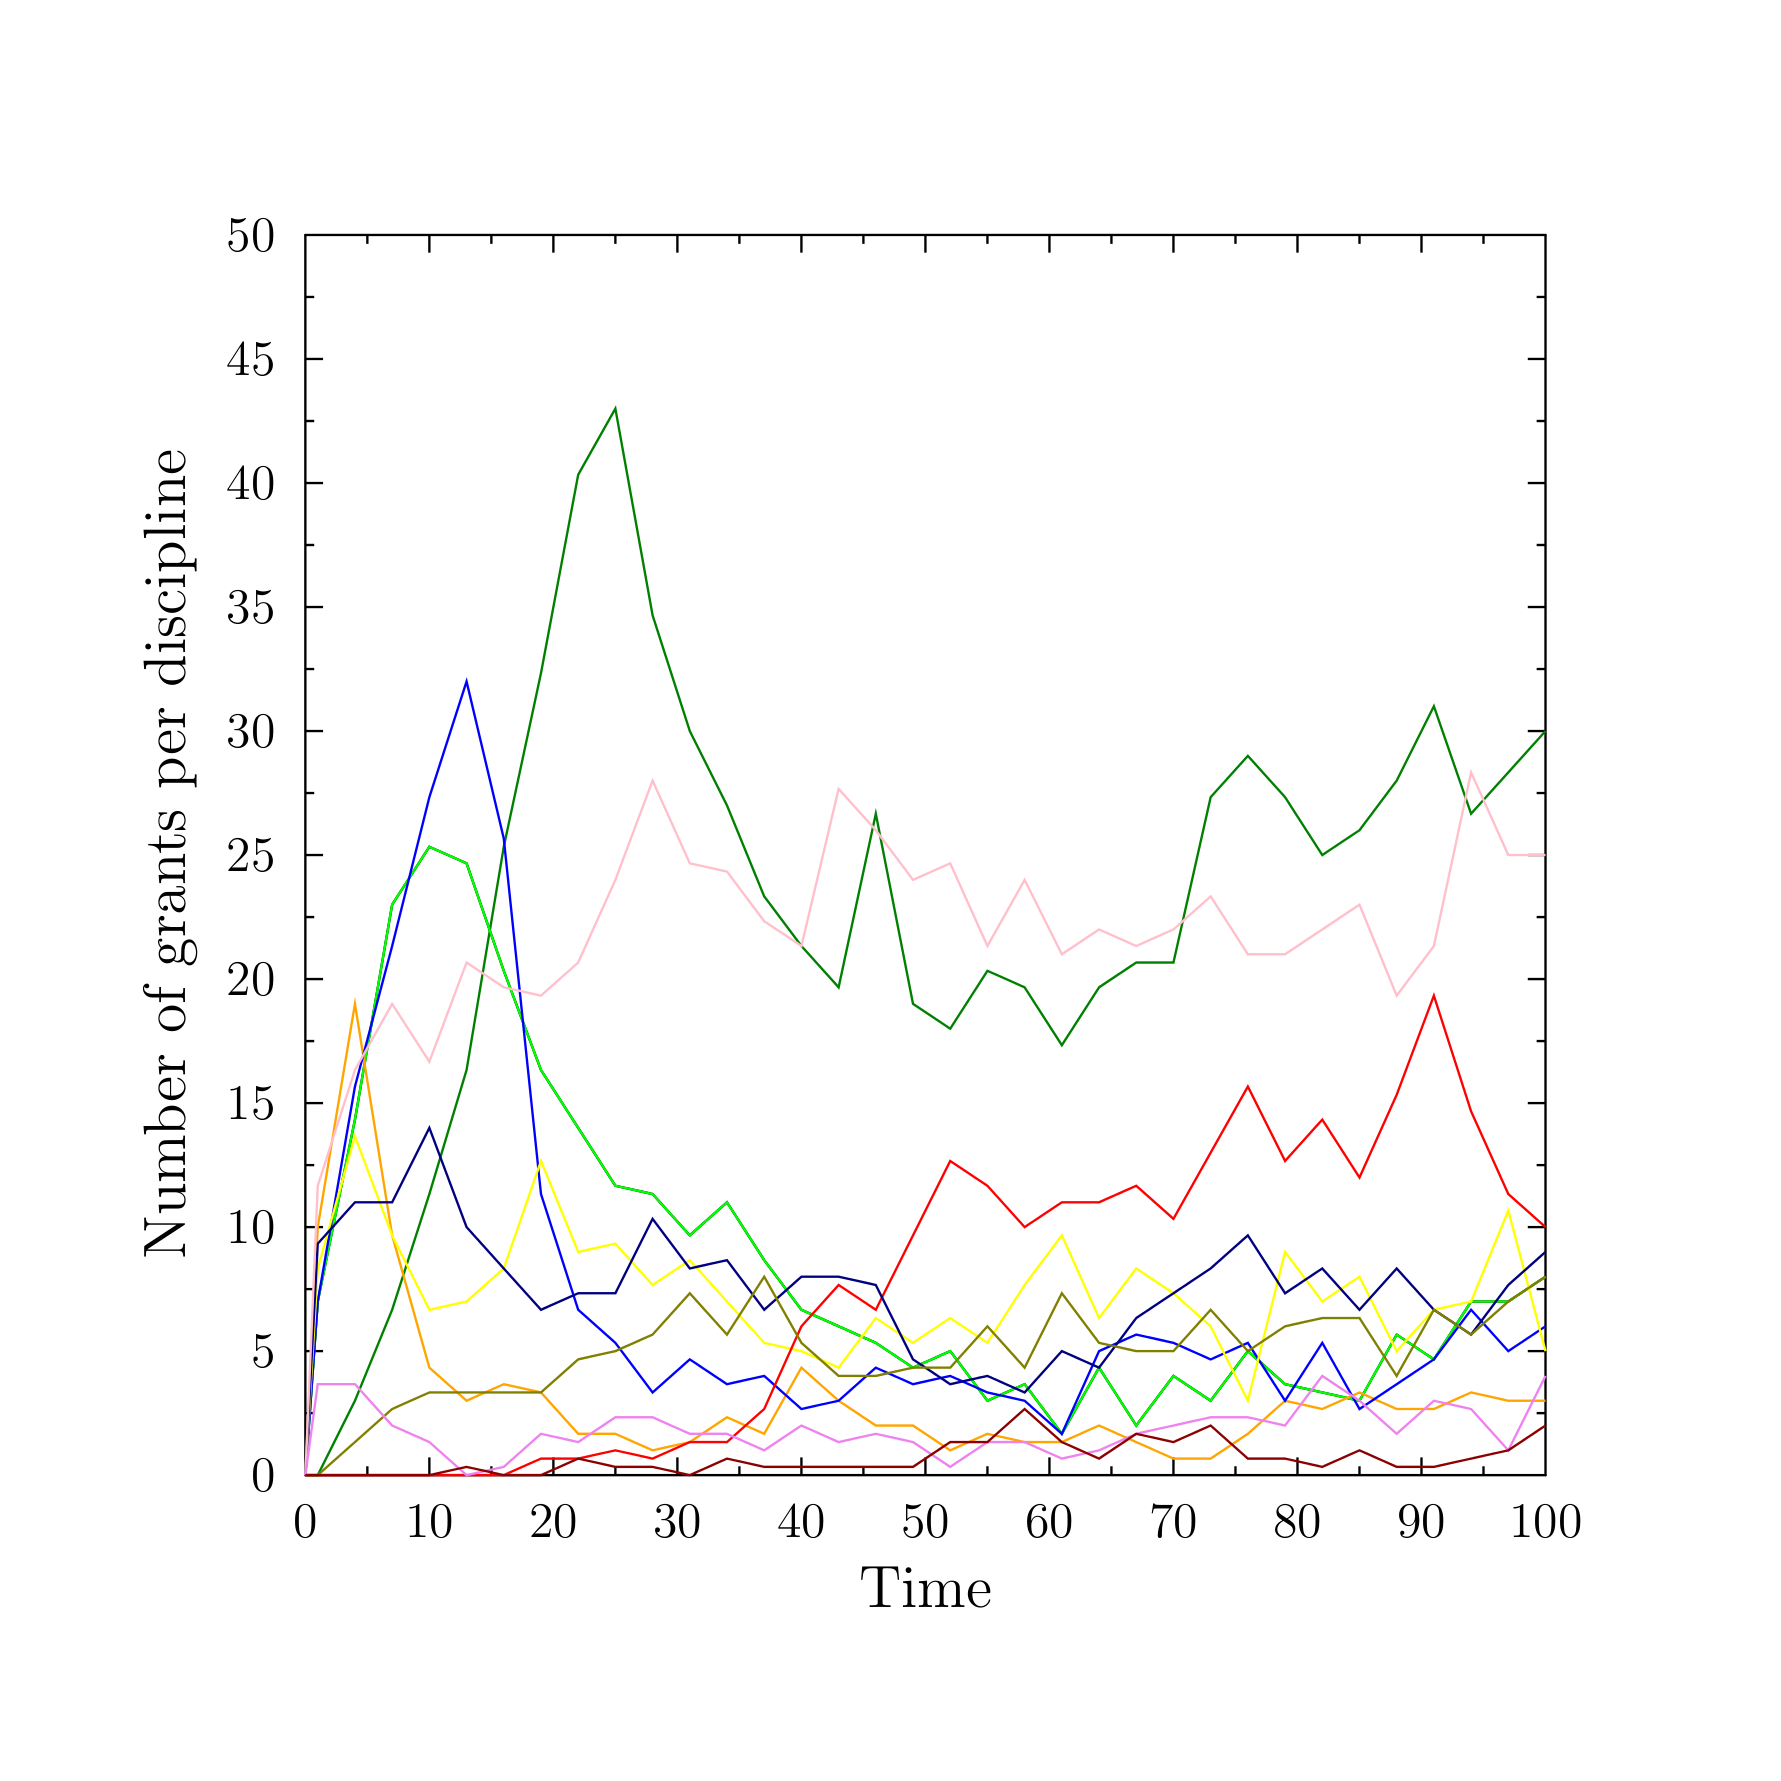
Figure 6 presents the time evolution of the popularity of several disciplines in the model. Despite the simplicity of the topology of research landscape, the figure resembles quite closely the ups and downs of the actual funding of research, with some disciplines gaining more funds and researchers, some remaining relatively stable and some decreasing in their appeal, for example, Swiss National Science Foundation (http://p3.snf.ch/Default.aspx?id=grantsbydiscipline), Research Council UK (http://gtr.rcuk.ac.uk/), US NIH categorical spending (https://report.nih.gov/categorical_spending.aspx).
The above examples indicate that, at least for some aspects of how scientific community chooses the research topics, the model leads to a qualitative and intuitive resemblance of the empirical data. This has encouraged us to develop a more realistic version of the model.
Towards a realistic model of science
Empirical background for a refined model
The open nature of the model makes it possible to consider developments that would make it more realistic. Some of these possible enhancements focus on the dynamics of the system. The first of such directions would be an inclusion of the 'PhD/postdoc slavery' stage for very junior scientists, in which their choices and work are related to (dictated by) their senior partners. The second direction would be to change the assumption of the fixed number of crucial discoveries per discipline. The assumption has the advantage of being simple to program. However, it implies that once a research field exhausts all the crucial discoveries, it becomes 'boring' forever-after. Yet, it is quite frequent that advances in other disciplines (new mathematical techniques, new instrumentation, interdisciplinary ideas) may 'revive' a field previously considered fully explored. It is possible to rewrite the model to an open ended configuration, in which the probability of making such discoveries is different for various disciplines, and diminishes in time -- but remains higher than zero. While these improvements are possible, our attention is drawn to a more fundamental issue of a realistic description of the epistemic landscape.
Our focus in the remaining part of the paper is on a different, much more fundamental model characteristic. This is the change from the abstract square grid topology to a network of correlated research topics/sub disciplines, based on the real world connections between them. The topology based on similarities between the research topics allows to describe the 'migratory' patterns of the researchers better: changing one's research focus is relatively easy within a domain (e.g. between landscape and environmental archaeology and prehistoric archaeology or between astronomy and space technology and the solar system physics) than between quantum gravity and general relativity and neurobiology (even though the latter are also sometimes viable). Such networks and science maps are already studied in the literature (e.g. Börner et al. 2012; Boyack 2008; Leydesdorff and Rafols 2009, 2012; Leydesdorff et al. 2013; Rafols et al. 2010; Rosvall et al. 2008; van Eck 2014; Waltman et al. 2010; West et al. 2015). There are multiple ways of determining which topics may be grouped together. The simplest, fixed classifications are based on the traditional macro-disciplines (physics, chemistry, biology ...) and their subdivisions. More advanced methods are based on automated identification of topics and their linkage via text analysis of publications, citation networks, and similar scientometric approaches.
For our current analysis we have chosen the data provided by the UK Gateway to Research website ( http://gtr.rcuk.ac.uk/), which contains a wealth of information on the research projects funded by the UK Research Councils (RCUK), stretching back to 2006. The categories defining the research disciplines and sub disciplines are based on traditional categories, so it does not automatically recognize new or changed research topics yielding a dynamic taxonomy (Klavans et al. 2015). However, the network connecting them is constructed using the declarations used by proposal authors to define their projects. Specifically, the project proposals contain the keywords indicating of the relevant sub disciplines. The connections between the topics result, therefore, directly from the way the actual research is done, sometimes with surprising, interdisciplinary links. Each project listing research fields A and B strengthens the network link between these two fields: as a result, we obtain a weighted network connecting 591 sub disciplines. There are 15930 links (with weights between 1 and 575), the resulting network is relatively dense, with graph density of 0.091.
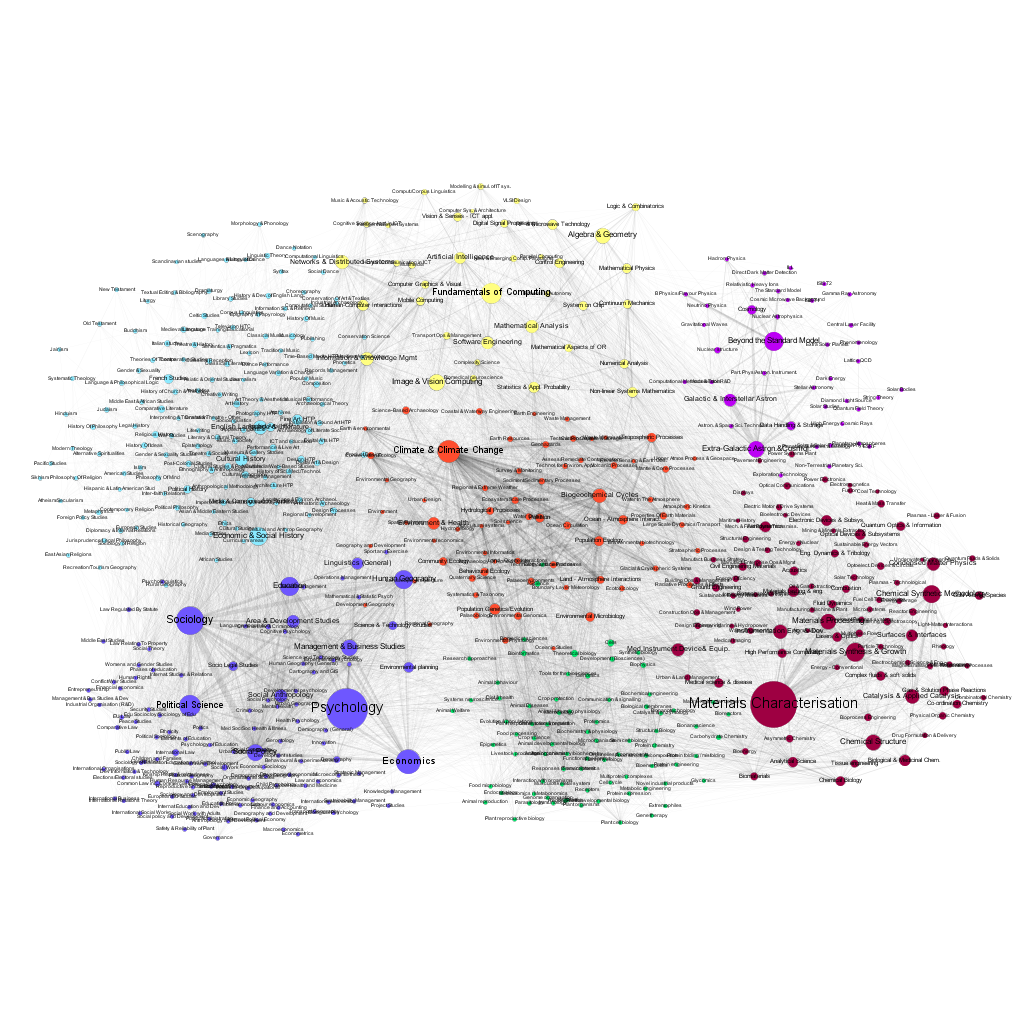
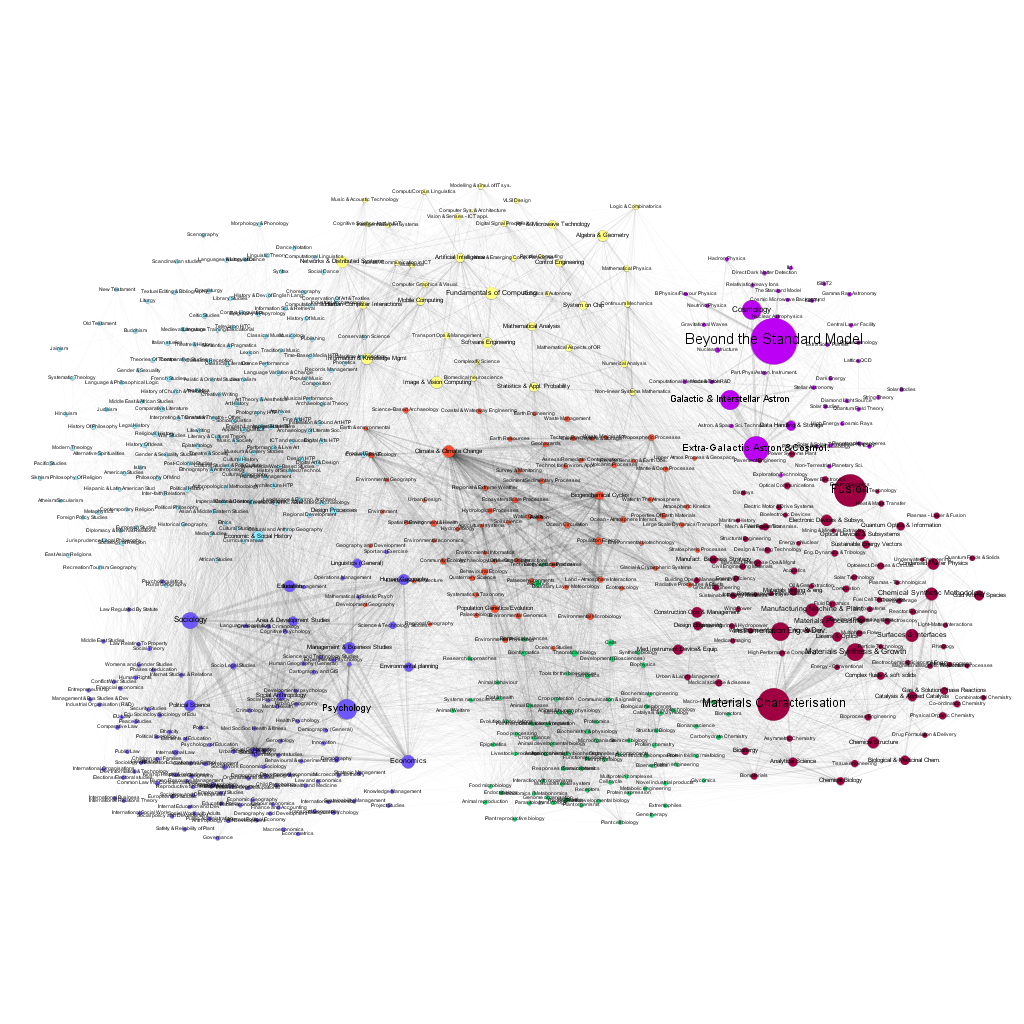
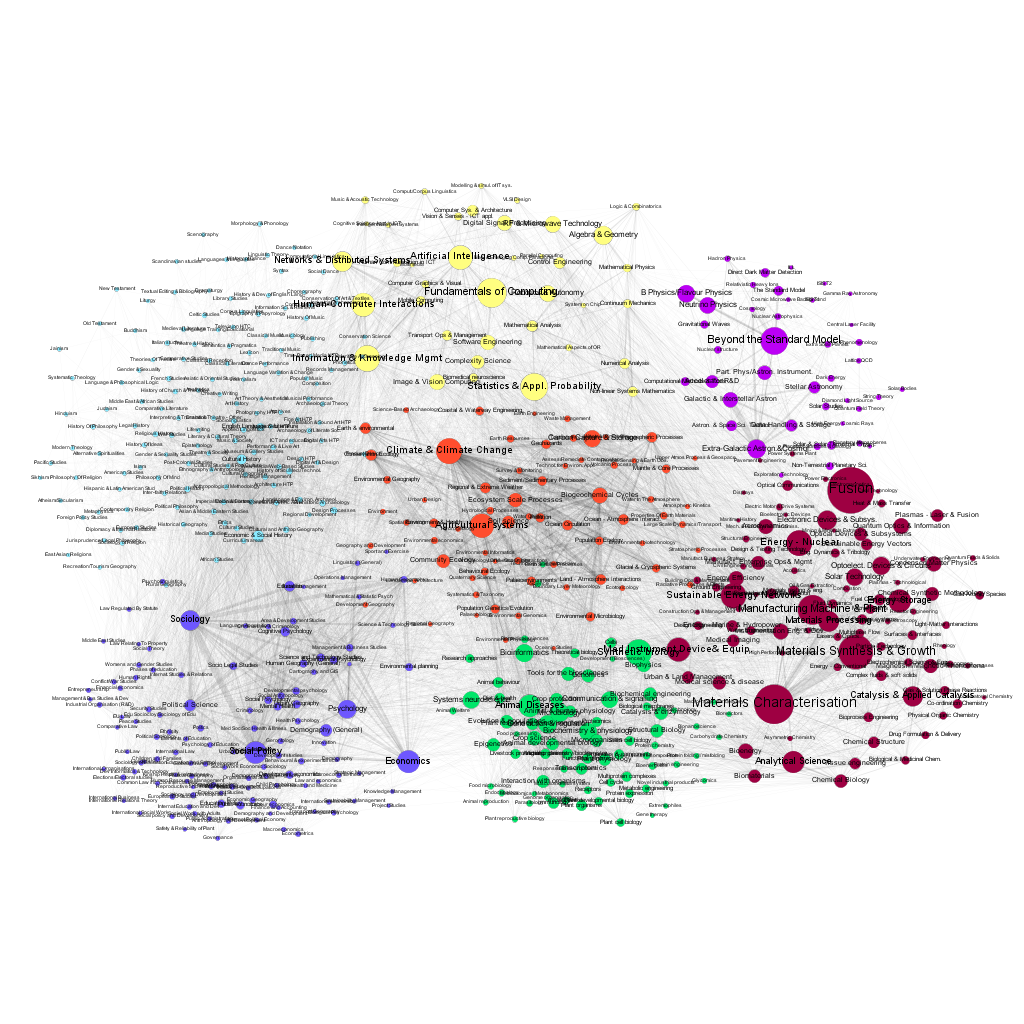
Figures 7 and 8 present the visualization of the network, with the size of the nodes corresponding to the number of projects funded in 2007 and 2016. One can easily discern the changes in the popularity of various fields.
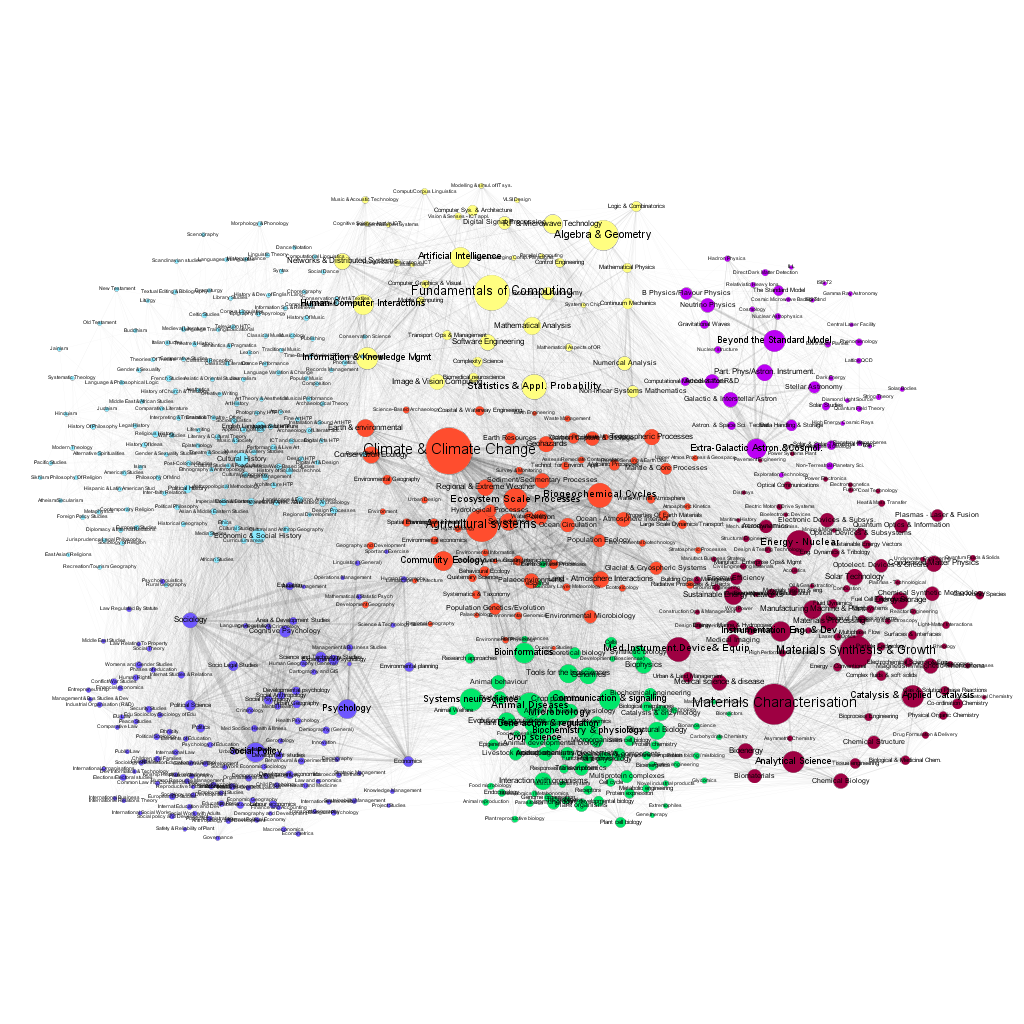
Figures 9 and 10 show corresponding views, however, the node size is now given by the actual funding awarded to projects in 2007 and 2016. Some macro disciplines are characterized by significantly larger average funding per project (e.g. fusion research or elementary particle physics). As in the case of the number of projects, there are significant differences in the distribution of funding among the sub disciplines over time. The network data file, containing all the relevant data for all years from 2007 to 2017 is available in the Supplementary Information.
The choice of the GtR data has been motivated by the richness of the database and the existence of well-defined APIs, allowing the use of automated data-mining. It has been possible, for example, to determine the temporal changes of the number of projects in each sub discipline, and to create a dynamic map of the changing landscape of projects funded by the RCUK. This is important because only a limited number of previous works on the 'maps of science' have gone beyond single time-frame snapshots (e.g. Mane et al. 2004; Porter et al. 2009; Small et al. 2014). We should note here that the GtR dataset contains only the successful projects, i.e. those that actually received the funding. The only way of estimation of the characteristics of the 'invisible' part of the research community activities (projects that did not receive funding) is via the average success ratios published by the six research Councils (http://www.rcuk.ac.uk/research/efficiency/successrates/, which are much less detailed).
Unfortunately, despite the relative richness of information provided by the RCUK (compared with some other funding agencies), there is quite a lot of data still missing or impossible to obtain using automated tools. Among the unknowns are the numbers of scientists working on each project (the data contains only the principal investigator name) and their age/seniority distribution. Monitoring the potential 'movements' of particular scientists between the research fields, even if we limit ourselves to the principal investigators requires manual work on over thirty thousand successful projects -- and no way to monitor the unsuccessful proposals. Nevertheless, the GtR dataset seems well suited to provide a basis for a more realistic ABM of the dynamics of the research community.
Groundwork for the ABM based on the GtR discipline network
Discipline network topology
Using the empirical network of the disciplines and sub disciplines defined by the GtR data instead of the abstract square grid is the easiest part of the transition from simplistic, conceptual domain to a semi-realistic setting.The import of the topology and characteristics of the research fields and their relationships is done using the graphml format. The movements of agents who are unsuccessful in getting the funding in their current field are now restricted to the domains directly linked with the current sub discipline, with the probability of choosing driven by the neighbouring sub discipline popularities.
We note here, that the topology of the network is assumed to be fixed -- neither new disciplines nor new links are created during the simulation runs. The dynamics of the system is thus limited to the numbers of agents working on specific subjects, their movements between the research topics, and the related numbers of the crucial and normal discoveries, funding allocation changes etc. -- determined exactly in the same way as for the square lattice.
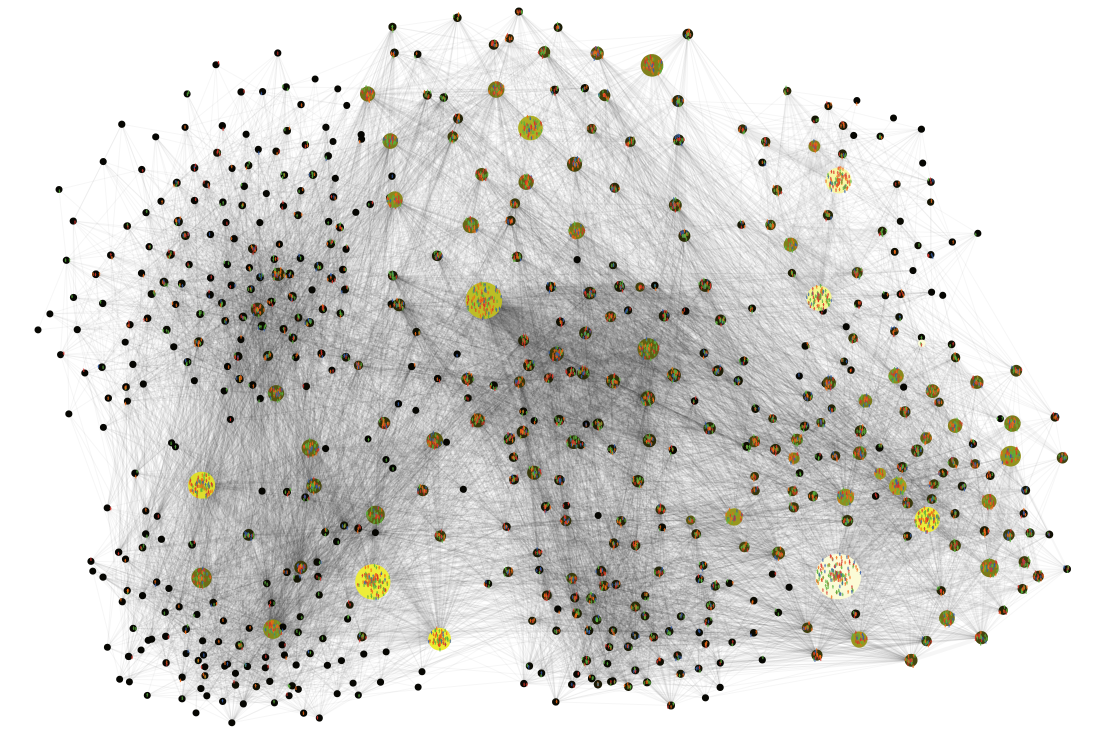
Figure 11 presents a snapshot of the simulation program based on the GtR data. The size of the nodes corresponds to the number of the projects. The colour indicates the funding: the lighter the color the higher is the average funding received during 2007-2016 period.
Initial conditions
The square lattice topology model has not been intended to resemble neither the actual landscape of research nor the starting conditions. The aim of the initial random distribution of the agents in the central group of patches ( Figure 1, left panel) was to emphasize the existence of the 'unexplored' part of the landscape. The situation is quite different in the case of the model based on the network of actual sub disciplines. The use of unrealistic initial conditions would destroy the gains due to the more realistic landscape description. For this reason, the preparation of the starting configuration must be considered very carefully. Moreover, it requires considerable amount of datamining and guesswork.
The first challenge is the initial distribution of scientist-agents between domains. As the GtR landscape is constructed from research projects, which typically list only one or two principal investigators, the number of projects in a sub discipline is only a poor proxy for the number of scientists working in the field (and, as we have noted, only of the successful ones). There are systematic differences in the typical number of scientists actually working on research projects in various disciplines. This may vary from thousands (typical for advanced experiments in elementary particles), through mid-sized teams in biology or medical sciences to single scientists, found in some humanities.
One could be tempted to use the amounts on money provided to each project as an estimate of its size (assuming standardized yearly researcher costs). However, such approach requires to know the part of the project budget devoted to researchers and not to the infrastructure, equipment, materials and other non-personnel costs. These differ considerably not only between different sub disciplines (e.g. between astrophysics and psycholinguistics) but also within a discipline (for example, when one project uses equipment already paid for and the other includes, in its budget, some new and expensive infrastructure). Taking into account the number of projects in the GtR database, the task of estimating the starting numbers of scientists for each sub discipline realistically requires extensive data analysis. Even of successful, the information would cover only the scientists who were successful in their grant applications, which, depending on the year and discipline are small parts of the whole community.
A solution to the problem, lacking finesse, but useful as a starting point for the model development, is to use a simple rule that the initial number of the scientists in each domain is equal to the number of projects devoted to this domain in one of the early years of the GtR database, corrected by a success ratio coefficient. Further simplification is provided by the use of a single success ratio for all research disciplines. Such approach allows effective, if not deeply realistic initial distribution of the scientists-agents.
The next challenge is related to an estimation of the societal and economic utility of the research sub discipline. The square lattice model simply assumed a random distribution of the \(V_U(D)\) values, constant in time. In a fully realistic model such random distribution is obviously not applicable. Some disciplines are considered to be providing greater value to the society and, therefore, worthy of greater funding. This value changes in time, not only thanks to the crucial discoveries (included in the model) but also due to other factors, such as changing societal needs (e.g. the need to solve specific problems in health and defense industries or to respond to climate change). The latter changes are not modeled in our approach.
The proposed solution is to use the actual amounts of funding devoted to each sub discipline, averaged over the 10 year period, as measures of the societal utility. These values are then re-scaled to the model parameter range. The total research potential would then be given, as before, by equation (1). For the future version of the model, the baseline \(V_U(D)\) values could be made time dependent.
Initial results
The model has a significant number of adjustable parameters: probabilities of certain events (such as grant proposal being funded or an agent decision to change the research topic, probabilities of normal and crucial discoveries) and the general settings, such as the average success ratio or the number of scientists in the system, fashion benefit due to crucial discoveries and lobbying, etc. With a very large number of topics and projects and the reliance on a guesswork in the choice of the parameters, it is not reasonable to expect a faithful reproduction of the evolution of the individual popularity of specific topics.
At the current stage, the model allows, however, to reproduce certain statistical properties of the UK science funding landscape. Once the basic network structure and the relative initial popularity of the sub disciplines are reproduced (see Figure 11) we were able to track the time dependence of the statistical distribution of the popularity of the topics (measured by the number of grants).
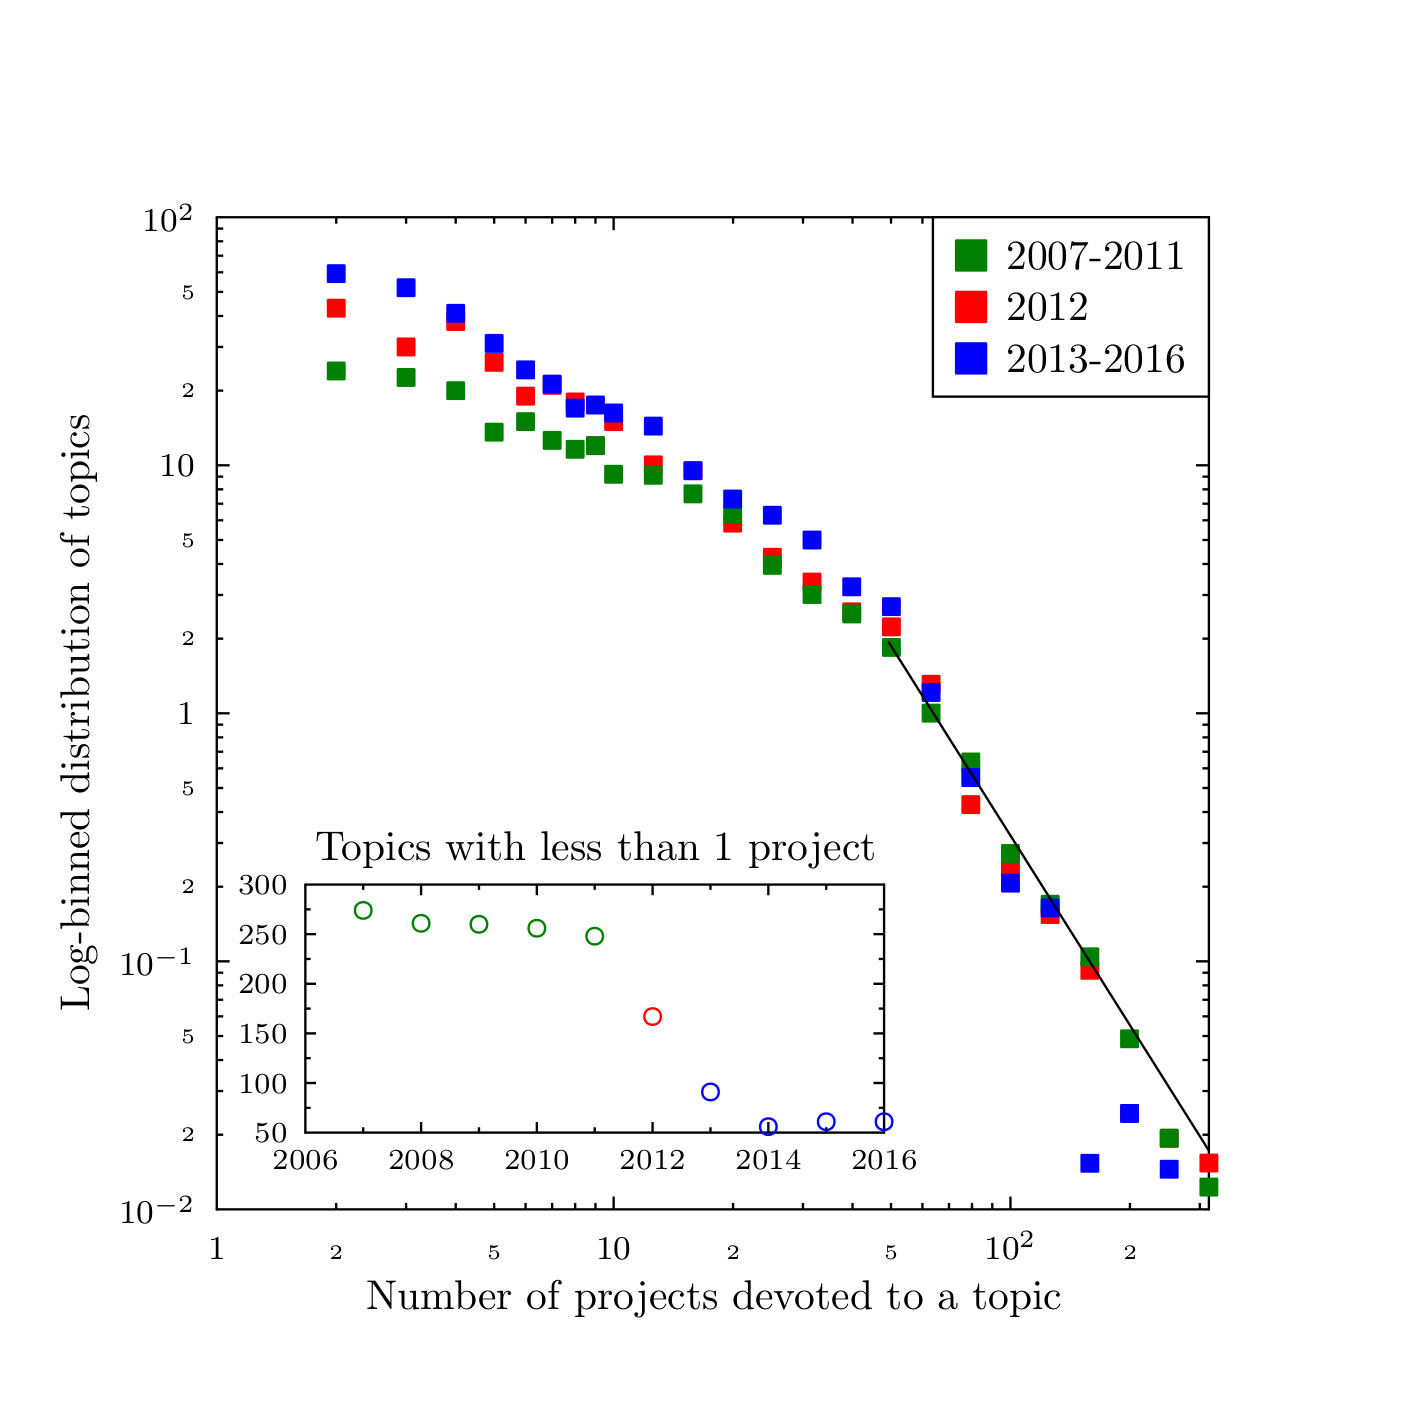
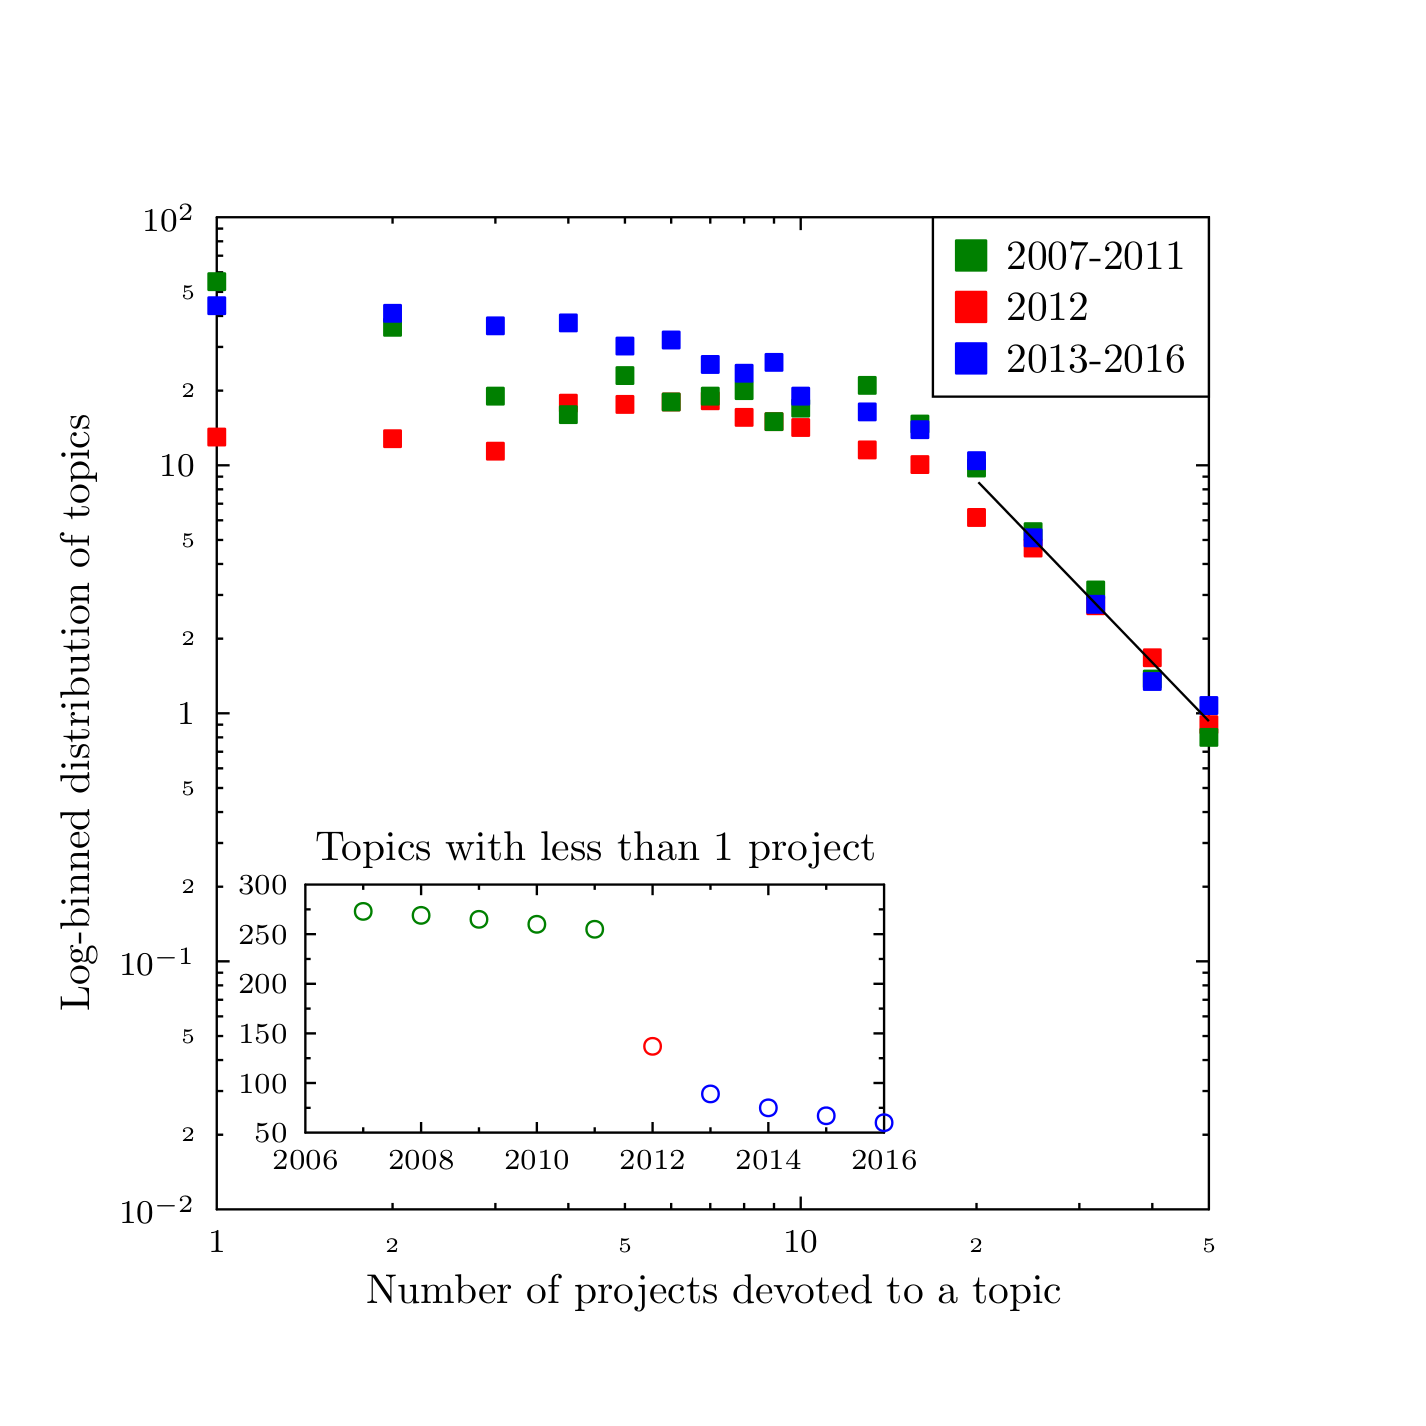
Figure 12 presents the actual statistical data as derived from the GtR dataset. The inset of the figure indicates that during the 2007--2016 period there were two very distinct periods. The first one, until 2011, was characterized by a relatively large number of sub disciplines which had less than one active project[4]. These 'forgotten' or 'niche' topics constitute almost 50% of the 591 sub disciplines. Beginning 2013, the number of the forgotten topics has become much smaller - in the 10\%--5\% range.
When we average the distribution of the number of projects per sub discipline (main part of Figure 12), we also observe significant differences between these two periods. The distributions for the most popular topics (attracting more than 40 projects) remain almost unchanged in time. They decrease in accordance with a power law, with an exponent of \(-2.54\pm 0.5\). On the other hand, the values for the medium-popularity subjects (attracting between 2 and 20 projects) is significantly different for the two periods. In this context, 2012 may be recognized as a transition year.
While there is no direct 'smoking gun' evidence for a single decisive action in the UK research funding practice around 2011-2013, which would lead to such step-wise decrease in the statistics of the 'forgotten' topics, there are some possible connections. First, most of these sub disciplines were new. Their creation (invention) might be due to the desire to fit within the new, multidisciplinary focus. The changes in the British industrial strategy introduced in 2012, which has led to the 'Eight great technologies' initiative (http://www.stfc.ac.uk/research/engineering-and-enabling-technologies/the-eight-great-technologies). The technologies that are the focus of the initiative: advanced materials, agricultural science, big data, energy storage, regenerative medicine, robotics and autonomous systems, satellites and commercial applications of space, and synthetic biology force a view of science different from the traditional domains (such as physics, chemistry, sociology etc.). It is reasonable to expect that to address the changed preferences in the funding programmes, the proposal authors would tend to list more diverse topics in their applications, leading to the increase of the list of the 'active' topics observed since 2013.
Despite the crudeness of the current version of the model, it has been possible, via careful choice of the model parameters, to reproduce the observed characteristics of the UK science landscape. Figure 13 presents the results of a simulation corresponding to the statistical properties of the empirical data. Most parameters are chosen to reproduce the initial distribution of the topic popularity. The transition in 2012 is simulated by a change of a single parameter: the relative attention that the migrating agents pay to the 'empty' topics, i.e. topics with no other agent present in their search for a more profitable or interesting field. The model reproduces quite well the general properties of the real system: different behaviours for the low, medium and high popularity topics and time dependence of the number of the niche disciplines. Even the exponent for the power-law describing the highest popularity subjects, equal to \(-2.44\pm 0.2\), is very close to the observed one. The ease in which such a simple model modification leads to the behaviour closely matching the empirical observations was quite surprising and encouraging at the same time.
Conclusions
Science as a social process is incredibly complex. Discoveries are unpredictable, especially the crucial ones -- opening new avenues of research -- because science is an experimental endeavour that deals with the unknown. The individual decisions of the scientists, regarding the topic of their research are driven by varying combinations of curiosity, skills, risk acceptance or aversion, financial interests, obedience, etc. On top of the individual differences, there are many levels of social influences, from the role of the senior scientists (spanning the range from gentle advisor to 'postdoc-slave' owner), institutional hierarchies up to the political decisions shaping the general research funding policies.
As with similarly complex social phenomena, the ABM can only aim at a partial and statistical description of the observed characteristics. Our goal was to construct a model that would take into account some aspects of the individual behaviour and describe the resulting trends in the researcher mobility (defined as the change of research discipline), success rate and popularity of the research topics. The square lattice ('toy') model allows to focus on the effects of the parameters representing the individual behaviours (such as the tendency to follow fashion, productivity differences between senior and junior scientists etc.) and parameters statistically describing the research landscape (e.g. relative numbers of crucial discoveries or funding distribution due to societal needs). The abstract nature of the epistemic landscape prohibits any realistic comparison of the model results with the real world, but the model dynamics is 'reasonable', showing variations of the popularity of the sub disciplines comparable to those recorded by funding agencies in many countries.
The more realistic model presented here, using mostly the same parameters as the toy version but based on the actual research topic list and project funding data from the UK Research Council could become a reasonable basis for further work, that would capture the contextual factors more precisely. The planned future developments focus on more realistic initial conditions and more careful treatment of the research teams and individual scientists, for example via the use of the bibliometric data of publications resulting from the projects.
In looking into the future directions it is quite illuminating to refer to two editorial reviews, accompanying collections of papers devoted to ABM of science (Edmonds et al. 2011; Börner et al. 2017). During the six years separating the reviews modelling community has made significant progress, especially by using the improved data availability. Interestingly, both editorials stress the importance of the potential predictive use of science models. Achieving the goal of using ABM in data-driven, informed decision and policy making related to research, depends on the completeness of the models and on the quality of data on which they are based. We are not there yet.
The path envisaged in our approach, combining individual scientist motivation perspective with large scale social phenomenology (funding priorities, industrial use...) may be a step in the direction of predictive models. Such models, including factors that come from outside of science's own perspective becomes even more important in the light of financial austerity and decreasing understanding of the role of science in society. Recent drastic budget cuts in Argentina (Kornblihtt 2017) and Brazil (Escobar 2017) show how fragile the system may be.
Acknowledgements
This work was partially supported by the COST Action TD1306 "New frontiers of peer review" (http://www.peere.org). A previous version of the paper has been presented at the Social Simulation Conference, SSC2016, Rome, September 19-23, 2016.Notes
- The cited reference lists are by no means exhaustive, because the field is growing rapidly. For a recent review see Scharnhorst et al. (2012).
- For more information on the rapid rise of the topic, from a study of a specialized defense mechanism in bacteria (2007) to its actual use, as precision method of gene-editing on human patients (2016), one could consult the special topic sections of Science (http://www.sciencemag.org/topic/crispr) or Nature (http: //www.nature.com/news/crispr-1.17547/).
- The research funding devoted to graphene, largely driven by the promises of its industrial applications, exceeds billions of dollars. For example, the EC Graphene Flagship project is estimated at 1.3 billion US$, UK Graphene Research Centre funding is about 350 million dollars, similar size efforts are taking plane throughout the world, with China investing heavily in carbon nano-technologies (https://www2.deloitte.com). The press and the governments are continuously fed the news such as "Commercial Graphene is Almost Here" (https://www.uschamberfoundation.org) or "Global Market for Graphene: a Sleeping Lion Soon to Roar" (http://www.bccresearch.com). At the same time, the actual market for the graphene products for the forthcoming decade is smaller by an order of magnitude. The Deloitte report mentioned above estimates that the graphene market in 2016 will likely not surpass 30 million dollars in 2016 and would grow to a little more than 100 million by the end of the decade. Other estimates concur: Allied Market Research predicts the market in 2021 to be about 150 million dollars (https://www.alliedmarketresearch.com); IDTechEx Research projects that the graphene market will grow to 220 million in 2026 http://www.idtechex.com).
- We remind here that, for example, if a project description lists two disciplines, then both of them receive 1/2 of a contribution. This allows the existence of topics with less than one project per year.
References
AHRWEILER, P., Schilperoord, M., Pyka, A. & Gilbert, N. (2015). Modelling research policy: Ex-ante evaluation of complex policy instruments.Journal of Artificial Societies and Social Simulation, 18(4), 5: https://www.jasss.org/18/4/5.html. [doi:10.18564/jasss.2927 ]
ALLESINA, S. (2012). Modeling peer review: an agent-based approach. Ideas in Ecology and Evolution, 5(2), 27-35.
BAIER, M. (2012). A simulation model of scientists as utility-driven agents. In K.G. Troitzsch, M.Mohring & U.Lotzmann (Eds.), Proceedings 26th European Conference on Modelling and Simulation. ECMS, 683-689. [doi:10.7148/2012-0683-0689 ]
BALIETTI, S., Mas, M. & Helbing, D. (2015). On disciplinary fragmentation and scientific progress. PloS one, 10(3), e0118747.
BENTLEY, P.J. (2009). The game of funding: modelling peer review for research grants. In Proceedings of the 11th Annual Conference Companion on Genetic and Evolutionary Computation Conference: Late Breaking Papers. ACM, 2597-2602. [doi:10.1145/1570256.1570367 ]
BLONDEL, V.D., Guillaume, J.-L., Lambiotte, R. & Lefebvre, E. (2008).Fast unfolding of communities in large networks.Journal of Statistical Mechanics: Theory and Experiment, 2008(10), P10008.
BÖRNER, K., Edmonds, B., Milojevic, S. & Scharnhorst, A. (2017). Editorial.Scientometrics, 110, 387-390. [doi:10.1007/s11192-016-2104-1 ]
BÖRNER, K., Klavans, R., Patek, M., Zoss, A.M., Biberstine, J.R., Light, R.P., Lariviere, V. & Boyack, K.W. (2012). Design and update of a classification system: The ucsd map of science.PloS one, 7(7), e39464.
BOYACK, K. (2008).Using detailed maps of science to identify potential collaborations.Scientometrics, 79(1), 27-44. [doi:10.1007/s11192-009-0402-6 ]
BRAMOULLÈ, Y. & Saint-Paul, G. (2010). Research cycles. Journal of economic theory, 145(5), 1890-1920.
CABOTÀ J.B., Grimaldo, F. & Squazzoni, F. (2014). Do editors have a silver bullet? An agent-based model of peer review. In Squazzoni F., Baronio F., Archetti C. and Castellani M. (Editors), Proceedings 28th European Conference on Modelling and Simulation. ECMS. [doi:10.7148/2014-0725 ]
EDMONDS, B., Gilbert, N., Ahrweiler, P. & Scharnhorst, A. (2011). Simulating the social processes of science.Journal of Artificial Societies and Social Simulation, 14(4), 14: https://www.jasss.org/14/4/14.html.
ESCOBAR, H. (2017). Facing 'doomsday' scenario, scientists consider fleeing Brazil. http://www.sciencemag.org/news/2017/01/facing-doomsday-scenario-scientists-consider-fleeing-brazil.
GERARD, N. & Noble, J. (2010). Modelling academic research funding as a resource allocation problem. In 3rd World Congress on Social Simulation: http://eprints.soton.ac.uk/271374/.
GILBERT, N. (1997). A simulation of the structure of academic science. Sociological Research Online, 2(2). [doi:10.5153/sro.85 ]
GILBERT, N. & Troitzsch, K.G. (2005).Simulation for the Social Scientist. Open University Press, second edn.
GU, X., Blackmore, K., Cornforth, D. & Nesbitt, K. (2015). Modelling academics as agents: An implementation of an agent-based strategic publication model.Journal of Artificial Societies and Social Simulation, 18(2), 10: https://www.jasss.org/18/2/10.html. [doi:10.18564/jasss.2725 ]
KLAVANS, R. & Boyack, K.W. (2015). Which type of citation analysis generates the most accurate taxonomy of scientific and technical knowledge? arXiv preprint arXiv:1511.05078
KORNBLIHTT, A. (2017). Where science and nonsense collide.Nature, 541, 135. [doi:10.1038/541135a ]
KOVANIS, M., Porcher, R., Ravaud, P. & Trinquart, L. (2016). Complex systems approach to scientific publication and peer-review system: development of an agent-based model calibrated with empirical journal data. Scientometrics, 106, 695-715.
LEYDESDORFF, L., Carley, S. & Rafols, I. (2013).Global maps of science based on the new web-of-science categories.Scientometrics, 94(2), 589-593. [doi:10.1007/s11192-012-0784-8 ]
LEYDESDORFF, L. & Rafols, I. (2009). A global map of science based on the isi subject categories.Journal of the American Society for Information Science andTechnology, 60(2), 348-362.
LEYDESDORFF, L. & Rafols, I. (2012). Interactive overlays: A new method for generating global journal mapsfrom web-of-science data. Journal of Informetrics, 6(2), 318-332. [doi:10.1016/j.joi.2011.11.003 ]
MANE, K.K. & Börner, K. (2004). Mapping topics and topic bursts in PNAS. Proceedings of the National Academy of Sciences, 101(suppl 1), 5287-5290.
PAOLUCCI, M. & Grimaldo, F. (2014). Mechanism change in a simulation of peer review: from junk support to elitism. Scientometrics, 99(3): 663–688. [doi:10.1007/s11192-014-1239-1 ]
PAYETTE, N. (2011). For an integrated approach to agent-based modeling of science.Journal of Artificial Societies and Social Simulation, 14 (4), 9: https://www.jasss.org/14/4/9.html.
PAYETTE, N. (2012). Agent-based models of science. In Models of science dynamics (pp. 127--157), Heidelberg: Springer. [doi:10.1007/978-3-642-23068-4_4 ]
PORTER, A. & Rafols, I. (2009). Is science becoming more interdisciplinary? Measuring and mapping six research fields over time. Scientometrics, 81(3), 719-745.
RAFOLS, I., Porter, A.L. & Leydesdorff, L. (2010). Science overlay maps: A new tool for research policy and library management. Journal of the American Society for information Science andTechnology, 61(9), 1871-1887. [doi:10.1002/asi.21368 ]
ROEBBER, P.J. & Schultz, D.M. (2011). Peer review, program officers and science funding. PloS one, 6(4), e18680.
ROSVALL, M. & Bergstrom, C.T. (2008). Maps of random walks on complex networks reveal community structure. Proceedings of the National Academy of Sciences, 105(4), 1118-1123. [doi:10.1073/pnas.0706851105 ]
SCHARNHORST, A., Börner, K. & van den Besselaar, P. (Eds.) (2012). Models of science dynamics: encounters between complexity theory and information sciences. Springer, Heidelberg.
SIMKIN, M.V. & Roychowdhury, V.P. (2003). Read before you cite. Complex Systems, 14, 269-274.
SIMKIN, M.V. & Roychowdhury, V.P. (2006). An introduction to the theory of citing. Significance, 3, 179-181.
SMALL, H., Boyack, K.W. & Klavans, R. (2014). Identifying emerging topics in science and technology. Research Policy, 43(8), 1450-1467. [doi:10.1016/j.respol.2014.02.005 ]
SMOLIN, L. (2006). The Trouble with Physics: The Rise of String Theory, the Fall of Science and What Comes Next. Penguin Books Ltd, London.
SOBKOWICZ, P. (2011). Simulations of opinion changes in scientific communities. Scientometrics, 87(2), 233-250. [doi:10.1007/s11192-011-0339-4 ]
SOBKOWICZ, P. (2015). Innovation suppression and clique evolution in peer-review-based, competitive research funding systems: An agent-based model. Journal of Artificial Societies and Social Simulation, 18 (2), 13: https://www.jasss.org/18/2/13.html.
SQUAZZONI, F. & Gandelli, C. (2012). Saint Matthew strikes again: An agent-based model of peer review and the scientific community structure. Journal of Informetrics, 6(2), 265-275, [doi:10.1016/j.joi.2011.12.005 ]
SQUAZZONI, F. & Gandelli, C. (2013). Opening the black-box of peer review: An agent-based model of scientist behaviour. Journal of Artificial Societies and Social Simulation, 16 (2), 3: https://www.jasss.org/16/2/3.html.
SQUAZZONI, F. & Takacs, K. (2011).Social simulation that 'peers into peer review'. Journal of Artificial Societies and Social Simulation, 14 (4), 3: https://www.jasss.org/14/4/3.html. [doi:10.18564/jasss.1821 ]
VAN ECK, N.J. & Waltman, L. (2014).Visualizing bibliometric networks. In Y.Ding, R.Rousseau & D.Wolfram (Eds.), Measuring scholarly impact (pp. 285--320), Heidelberg: Springer.
VITANOV, N. & Ausloos, M. (2012). Knowledge epidemics and population dynamics models for describing idea diffusion chap.3, (pp. 69--125). Heidelberg: Springer, [doi:10.1007/978-3-642-23068-4_3 ]
WALTMAN, L., van Eck, N.J. & Noyons, E.C. (2010). A unified approach to mapping and clustering of bibliometric networks. Journal of Informetrics, 4 (4), 629-635.
WATTS, C. & Gilbert, N. (2011). Does cumulative advantage affect collective learning in science? An agent-based simulation. Scientometrics, 89(1), 437-463. [doi:10.1007/s11192-011-0432-8 ]
WEISBERG, M. & Muldoon, R. (2009). Epistemic landscapes and the division of cognitive labor. Philosophy of science, 76(2), 225-252.
WEST, J., Bergstrom, C.T. & Rosvall, M. (accessed 08.11.2016). Maps of science, http://www.eigenfactor.org/map/maps.php.
WILENSKY, U. (1999).Netlogo. Tech. rep., Center for Connected Learning and Computer-Based Modeling, Northwestern University. Evanston, IL. http://ccl.northwestern.edu/netlogo/.
WOIT, P. (2006).Not Even Wrong: The Failure of String Theory And the Search for Unity in Physical Law. New York: Basic Books.
ZHOU, Y., Lü, L. & Li, M. (2012).Quantifying the influence of scientists and their publications: distinguishing between prestige and popularity.New Journal of Physics, 14 (3), 033033.
ZOLLMAN, K.J. (2007).The communication structure of epistemic communities. Philosophy of science, 74 (5), 574-587. [doi:10.1086/525605 ]