
Introduction
Networks provide one of the most useful analytical and theoretical frameworks for studying social phenomena. Real-world social networks often exhibit a set of characteristic structural properties that do not occur jointly as often in different kinds of complex networks (i.e. technological, informational, biological). In particular, they tend to be sparse, have non-trivial clustering coefficients, positive degree assortativity, and short average path lengths (small-world property). Moreover, social networks often have right-skewed but rarely power law degree distributions (Newman & Park 2003; Watts & Strogatz 1998; Boguñá et al. 2004; Broido & Clauset 2019). Therefore, one should account for these characteristic properties when modeling social networks. This is especially important in the context of simulation studies, in which researches often either explicitly or implicitly assume some underlying network structure, but sometimes lack appropriate tools to generate or model such structures and have to resort to well-known generic models such as Erdős-Rényi random graphs (Erdős & Rényi 1959) or preferential attachment networks (Barabasi & Albert 1999) that may not fit well to the social problem at hand. Moreover, proper understanding of how various social processes affect networks’ structures and vice versa is also theoretically and practically important for many fields and problems within social sciences such as opinion dynamics, diffusion of information/diseases (Flache et al. 2017; Sobkowicz 2009; Stroud et al. 2007), consensus emergence (Stocker et al. 2001), social impact theory and dynamical social psychology (Latane 1981; Nowak et al. 1990; Nowak & Vallacher 1998), as well as many kinds of agent-based models (Bianchi & Squazzoni 2015). Perhaps even more importantly, this question constitutes also the central problem in sociological theories of social structure.
Social structure and social networks are related through the fundamental principle of homophily, according to which agents that are similar to each other with respect to some significant social features are more likely to be somehow connected than dissimilar agents (Blau 1977; McPherson 1983; Popielarz & McPherson 1995; McPherson et al. 2001). Social structure corresponds to a distribution of social positions (combinations of features), and relative positions determine probability of an occurrence of a tie of a given type between any two agents. This idea is reflected in sociology in a long and rich tradition of thinking about social structure in terms of social spaces[1] in which actors are represented as points and relations between them follow from distances in the space (Blau 1977; McPherson 2004; Bourdieu 1986, 1989). In other words, structure of social networks is directly linked to geometry (distribution of positions) of social spaces they are embedded in.
Thus, it is quite natural to represent social networks with various models of spatially-embedded graphs such as Random Dot Product Graphs (Scheinerman & Tucker 2010), Latent Space Model (Hoff et al. 2002) or Social Circles (Hamill & Gilbert 2009). However, perhaps one of the most generic and parsimonious models are Random Geometric Graphs (RGG), in which connection probabilities are modeled explicitly with non-increasing functions of distances in an embedding space (Dall & Christensen 2002; Krioukov 2016), since their mathematical formulation corresponds directly to the sociological notions of social structure and homophily.
The aim of this paper is to examine the extent to which the principle of homophily is sufficient to explain the typical structural features of social networks and to determine whether it can be the sole generating process or rather needs to be complemented by other processes. This question is important because the link between structure of social networks and homophily is already a well-established sociological fact (Blau 1977; McPherson et al. 2001) and homophily itself is one of the most universal processes observed in social systems (McPherson & Smith-Lovin 1987; Marsden 1987; Kossinets & Watts 2009), socio-technological systems (Aiello et al. 2012; Colleoni et al. 2014; Halberstam & Knight 2016) and even animal societies (Lusseau & Newman 2004; Jiang et al. 2013). This is not a new question of course, as already a great deal of work on this problem has been done (e.g. Popielarz & McPherson 1995; Centola et al. 2007; Carletti et al. 2011; Centola & van de Rijt 2015). However, the novelty of our contribution follows from the fact that we use a very general formal model of homophily-driven network formation which we derive from first principles. Moreover, we explicitly address the question of the extent to which homophily is sufficient to reproduce structural properties considered typical for social networks. We also examine its robustness with respect to several factors such as system size changes and combining with other processes.
To achieve our goal we first use existing analytical results to show an approximate equivalence between social networks shaped by homophily and random geometric graphs and derive the proper form of the connection probability function. Next we use and extend a particular type of RGG introduced by Boguñá et al. (2004), which we call the Social Distance Attachment (SDA) model, to conduct simulation studies to validate our analysis and extend it beyond the existing analytical results. We run SDA simulations for much wider range of parameters than the one used by the authors in the original paper (Boguñá et al. 2004) and extend the model so one can control expected average degree as well as enforce arbitrary degree sequences. The goal of our simulation study is to assess the extent to which pure homophily or homophily combined with other processes such as a random edge rewiring and degree distribution constraints can reproduce the typical properties of social networks. Through all this we want both to provide a theoretical insight into the role homophily may play as a process structuring social networks, as well as equip researchers with graph models that are both simple, interpretable and useful for generating artificial networks that reproduce some of the most typical features of real-world social networks.
The rest of the paper is structured as follows. First, we briefly define network metrics that will be used later and discuss in more detail structural properties that are typical for social networks. Then, we position our approach to the problem within the broader literature about homophily and social networks. Next, we discuss the connection between homophily and random geometric graphs based on existing analytical results. After that we introduce the SDA model and discuss the results of the first simulation study. Then, we introduce a hybrid of SDA and the configuration model that allows generating homophilic networks with arbitrary degree sequences and discuss the results of the second simulation study. Last but not least, we discuss all the results in the light of the existing literature on social networks and homophily and use them to propose a crude, but easy-to-apply, rule of thumb that may help to identify real-world social networks which may be shaped by homophily to a significant degree.
Code and replication
Python implementation of both models and scripts replicating the simulations as well as R code for the data analysis are available at GitHub: https://github.com/sztal/sda-model. The repository contains both code and documentation. Frozen version of the repository can be accessed through CoMSES library[2].
Properties of Social Networks
Here we define network metrics which we will use and describe in detail the characteristic features of social networks. We focus on the following structural properties:
- Sparsity. A graph is sparse if its mean degree (\(𝔼[k]\)) grows sublinearly with the system size/number of nodes (\(N\)). This implies that edge density (fraction of existing edges) goes to zero with increasing \(N\). In particular, networks with fixed mean degree are sparse (Newman 2010). Sparsity is typical for many types of real-world networks, but it is especially important for social networks. Fixed average degree in social networks is implied by the notion of Dunbar’s numbers, which corresponds to the typical amount of meaningful relationships (of a given closeness) a person may effectively maintain (Hill & Dunbar 2003; Mac Carron et al. 2016). Hence, any model of social networks, at least in the case of relations between individuals, should take this into account.
- Non-trivial clustering. Clustering (transitivity), measures probability that if a randomly selected node is connected to two other nodes, then these two nodes are also connected (such property is called triadic closure). In the case of dense graphs clustering may be trivial. Consider an Erdős-Rényi random graph (Erdős & Rényi 1959) in which every possible edge occurs with probability \(p\) (hence \(𝔼[k] = p(N-1)\) grows linearly with \(N\)). In such a graph expected clustering is \(p\) (Newman 2010, p. 347) and is equal to the edge density. In sparse networks density goes to zero, so if there is non-zero clustering, even for large \(N\), then there must be some non-trivial process that enforces triadic closure. This is exactly why joint sparsity and high clustering is a very important structural feature. It is considered one of the hallmarks of social networks (Newman & Park 2003; Newman 2010, p. 200). If not stated otherwise, by clustering we always refer to the global clustering / transitivity, rather than the mean nodal clustering coefficient (Newman 2010, p. 198–204).
- Positive degree assortativity. Degree assortativity quantifies the tendency of nodes to connect to other nodes of similar degree. It is defined as a Pearson correlation between degrees of adjacent nodes (Newman 2002). Not all social networks have positive degree assortativity — for instance the famous Zachary’s karate club network is disassortative. However, many do and positive assortativity is generally considered typical for a broad class of social networks (Newman & Park 2003).
- Small-world property. A network is a small-world if its average shortest path (\(L\)) between nodes grows proportionally to \(\log N\) (Watts & Strogatz 1998). The property can be formally assessed only on the basis of a generative model defining scaling of average path lengths with respect to the growth of the network size, but empirical studies showed that in large real-world social networks average shortest paths tend to be around 6 (Travers & Milgram 1969; Leskovec & Horvitz 2008). In other words, average shortest paths in social networks tend to remain short even when a network grows very large.
- Diverse but bounded degree distribution. A degree distribution can be considered bounded if at least its first two moments (expected value and variance) are finite, so the Central Limit Theorem applies. Most typically unbounded degree distributions are power laws. Of course researchers in social sciences usually work with observed networks which have fixed size and finite moments by definition and not so much with analytical models and asymptotic methods, so it is perhaps natural to expect degree distributions of social networks to be bounded. However, boundedness is rather a property of the data-generating process than the data itself, so it may be still worthwhile to consider the question of the prevalence of power laws in degree distributions of social networks. In fact, there are good reasons to expect many social networks to have bounded (not power law) degree distributions as this is implied by the Dunbar’s numbers and at least partially supported by data (Broido & Clauset 2019). Hence, we argue that the boundedness of degree distributions should be included in the list of typical properties of social networks. However, it does not imply that degree distributions in social networks are exclusively Poisson-like and symmetric. Quite the contrary, they may come in many different shapes, in particular markedly right-skewed ones (Newman & Park 2003; Boguñá et al. 2004; Broido & Clauset 2019).
It should be stressed that many other types of complex networks (i.e. technological, informational or biological) may exhibit some of the above-mentioned properties, but will usually also differ in some important respects. For instance, power laws are more common at least among biological and technological networks (Broido & Clauset 2019), clustering levels in non-social networks are more often very close to what is induced just by degree distributions (this may be considered a type of trivial clustering) (Newman & Park 2003), and food webs are usually dense (Newman 2010, p. 135).
Homophily and geometry of social networks
It is important to note that there are several different kinds of homophily. Usually in the literature one can find a distinction between value and status or choice and induced homophily (McPherson & Smith-Lovin 1987; McPherson et al. 2001). Value/choice homophily refers to similarity between agents that is due entirely to their more or less conscious preferences. For instance highly extrovert people may prefer to spend time with others who are also extrovert. On the other hand status/induced homophily refers to similarity that follows from structural constraints imposed on social agents such as geographical distance, racial and ethnic segregation etc.
Moreover, from the dynamical perspective similarity between connected social agents may result not only from selection (homophily), but also from influence, as when two individuals are initially dissimilar, but with time become more alike through repeated social interactions (Flache et al. 2017). This indicates that similarity in social networks is linked to two distinct causal mechanisms. It is either that similarity breeds connection or connection breeds similarity, and it is usually very difficult to disentangle these two effects (Anagnostopoulos et al. 2008).
However, from a static point of view the problem of selection and influence disappears, since these are dynamic processes. When looking at a single snapshot of a social network any statement about homophily is a correlational statement as it refers to a probabilistic pattern that any two connected agents are on average more similar than any two disconnected agents, irrespective of any causal/dynamic processes that might have produced it. Moreover, in this case the distinction between value/choice and status/induced homophily also reduces just to the issue of interpretation of dimensions of a social space. Therefore, the general problem of the connection between homophily and structure of social networks naturally decomposes into two parts:
- Static part. What would be the typical structure of a social network assuming that agents who are more similar to each other (with respect to a set of features) are more likely to connect?
- Dynamic part. Which structural features of social networks can be attributed to selection (subsequently decomposed into value/choice and status/induced homophily) and which to influence and to what extent?
In this paper we try to address the first part. To do so, we first note that random geometric graph (RGG) models, in which all connection probabilities are derived simultaneously from distances in an embedding space according to a fixed formula (Dall & Christensen 2002; Krioukov 2016), provide a very convenient framework for this problem, since their mathematical formulation corresponds exactly to the structure of the social process. Thus, now we turn to a brief overview of the main properties of RGG in order to further explicate their important connection to social networks and homophily.
First, we show how RGG emerge naturally in the context of social networks based on very weak and justifiable assumptions. We consider a family of networks in which expected node degree and node-level clustering are fixed to some positive values. It has been proved that under such assumptions the maximum entropy distribution over the family of networks meeting the constraints is a RGG model with nodes distributed uniformly along the real line and the connection probability function approximated by the Fermi-Dirac distribution[3] (Krioukov 2016):
| $$p_{ij} = \frac{1}{1 + e^{\alpha(d({x}_i, {x}_j) - b)}}$$ | (1) |
The fact that the obtained probability distribution is maximum entropy implies that among all possible probability distributions meeting the constraints this one is the most unbiased with respect to any network properties other than the expected degree and local clustering. Thus, sparsity and clustering (two of the typical features of social networks) leads naturally to RGG.
Now let us note that in the limit of large homophily (\(\alpha \to \infty\)) the connection probability function reduces to a step function:
| $$p_{ij} = \begin{cases} 1,& \text{if } d({x}_i, {x}_j) < b\\ 0,& \text{if } d({x}_i, {x}_j) > b \end{cases}$$ | (2) |
Combining the two analytical results together we see that there is a kind of an approximate equivalence between networks with the first three typical properties of social networks we listed and random geometric graphs, since we have a biconditional:
- Sparsity and clustering \(\Longrightarrow\) RGG
- RGG \(\Longrightarrow\) sparsity, clustering and positive degree assortativity
The equivalence is exact only in the limit of large system size and high homophily, but it strongly suggests that there is an important connection between a particular class of social networks (sparse ones with high clustering and positive degree assortativity) and random geometric graphs. This confirms the idea that RGGs provide a proper framework for studying the connections between homophily and structure of social networks, or at least the first (static) part of this problem in our formulation. However, the analytical results we reviewed rely on the assumption of uniform distribution of nodes in the embedding space, which is rather unrealistic in the context of social systems. Moreover, they tell little about small-worldness and degree distributions. We now turn to computer simulations to address these problems.
Social Distance Attachment Model
For the purpose of simulation studies we use the Social Distance Attachment (SDA) model introduced by Boguñá et al. (2004). It is a RGG model formulated as follows. Let \(S_m = ℝ^m\) be an \(m\)-dimensional social space with an associated distance metric \(d_{ij} = d(\cdot, \cdot)\) (e.g. Euclidean or manhattan distance) and let \({x}_i \in S_m\) for \(i = 1, \ldots, N\) be points in this space. Then, for all possible edges in an \(N\)-by-\(N\) adjacency matrix (except self-loops) the following connection probability is assigned:
| $$p_{ij} = \frac{1}{1 + [b^{-1}d({x}_i,{x}_j)]^\alpha}$$ | (3) |
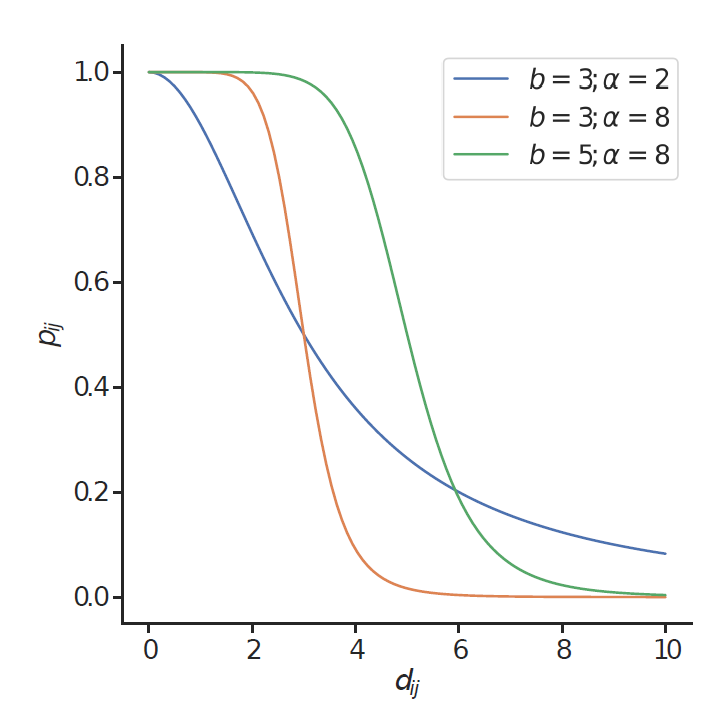
One remark is needed now. Why choose SDA function instead of Fermi-Dirac distribution, which we used to show the connection between social networks, homophily and random geometric graphs? The answer is two-fold. SDA function has a similar sigmoidal shape and also converges to hard RGG model when \(\alpha \to \infty\). Hence, being perhaps slightly more biased since Fermi-Dirac distribution is the maximum entropy solution, it is still qualitatively very similar. However, it also has two very important practical advantages.
Firstly, assuming there are no zero distances, for any \(\alpha\) we have that \(𝔼[k] \to 0\) as \(b \to 0\) and \(𝔼[k] \to N-1\) as \(b \to \infty\), while the former is not always true for Fermi-Dirac distribution (see Equation 1). This makes it always possible to find \(b\) yielding any desired \(𝔼[k]\) for any value of \(\alpha\), assuming that the distribution of nodes in an embedding space is not concentrated in a limited number of discrete positions. Together with the fact that conditionally on the embedding space edges in a network are independent Bernuolli random variables and that the expected degree can be easily computed as:
| $$𝔼[k] = \frac{1}{N}\sum_{i=1}^N\sum_{j=1}^N p_{ij}$$ | (4) |
Secondly, in the SDA model \(\alpha\) scales normalized unitless distance \(d_{ij} / b\) (see Equation 3), so values assigned to \(\alpha\) always correspond to the same level of homophily regardless of the distribution of nodes in the social space and its measurement scale. This makes it very easy to compare models run on different datasets.
Summing up, SDA model with fixed \(\alpha\) and \(𝔼[k]\) can be computed according to the following procedure:
- Let \(S_m\) be an \(m\)-dimensional social space and \({x}_i\) for \(i = 1, \ldots, N\) be points in \(S_m\).
- Derive \(N\)-by-\(N\) distance matrix \({D}_N\) between all pairs of points from \(S_m\) using some distance metric.
- Choose values of \(\alpha\) and \(𝔼[k]\).
- Find \(b\) using any univariate numerical root finding algorithm such as the bisection method. The objective is to find the root of the function:
- Transform \({D}_N\) into a connection probability matrix \({P}_N = (p_{ij})\). Note that \({P}_N\) specifies a probability distribution over all networks with \(N\) nodes.
- Use \({P}_N\) to generate undirected or directed adjacency matrices. Every edge is created independently (since they are conditioned on the social space) with probability \(p_{ij}\).
| $$f(b) = 𝔼[k] - \frac{1}{N}\sum_{i=1}^N\sum_{j=1}^N p_{ij}(b)$$ |
Simulation Study of Social Distance Attachment Model
In this section we study the behavior of SDA model with the Euclidean distance metric in regard to clustering, degree assortativity, average path lengths and degree distributions based on different underlying social spaces (different probability distributions used to sample nodes’ coordinates) and a wide range of parameters’ values. We also consider the behavior of the model when combined with a random edge rewiring process in which each edge is destroyed with some small probability and then a randomly selected node at one of its ends creates a new link picking a new neighbor uniformly at random from the pool of disconnected nodes. It is introduced to check whether such a small random disturbance may be enough to ensure small-worldness while not affecting the general effects of homophily with respect to clustering and degree assortativity. We considered the following parameter values:
- system size (\(N\)): \(1000, 2000, 4000, 8000\)
- social space:
- - uniform
- - \(4\) Gaussian clusters (equally sized spherical groups formed as multivariate Gaussian noise with different centroids)
- - lognormal (coordinates sampled from independent lognormal distributions)
- dimensionality of social space (\(m\)): \(1, 2, 4, 8, 16\)
- homophily (\(\alpha\)): \(2, 4, 8, \infty\) (hard RGG)
- expected average degree (\(𝔼[k]\)): \(30\)
- probability of random rewiring (\(p_{rewire}\)): \(0, 0.01\)
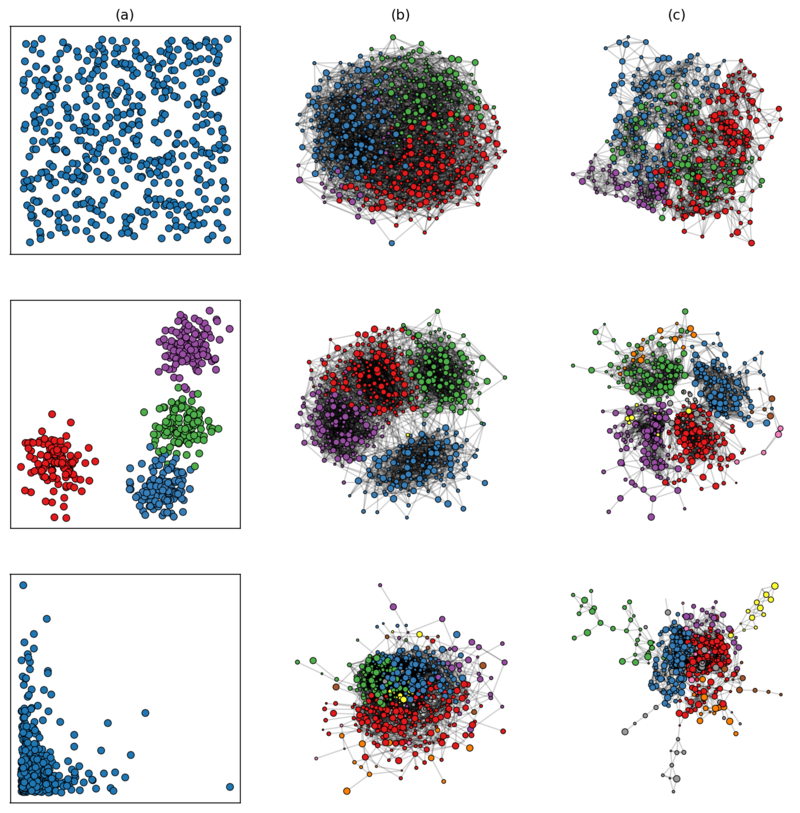
Every combination of simulation parameters was run 10 times (2 independent realizations of a social space and 5 independent realizations of an adjacency matrix). Confidence intervals on plots show minima and maxima estimated based on 100 bootstrap replicates. Social spaces were generated with standard pseudo-random numbers generators. This totaled to 4800 simulation runs. Appendix A presents example realizations of social space and corresponding networks.
The parameter space we explore is much richer than the one used by Boguñá et al. (2004). In particular, we study in detail distributions of nodes in social spaces other than uniform as well as behavior of SDA in high dimensions, while the original paper covers only the case of 1D uniform distribution. Our selection of distributions is of course somewhat arbitrary, but it also covers important qualitatively distinct cases. Uniform distribution must be included as a well-studied canonical benchmark, Gaussian clusters correspond to one of the most typical geometries of a structure with clear grouping (spherical clusters around different centroids) and lognormal is a very common type of a right-skewed distribution with a fixed lower bound. It is often used to model such quantities as income and arises naturally as a limiting distribution of multiplicative quantities, since it is a result of applying Central Limit Theorem to the logarithm of the product of a sequence of values.
All graph-theoretic quantities were computed with igraph (Csardi & Nepusz 2006). R language (R Core Team 2019) was used for data analysis and visualizations.
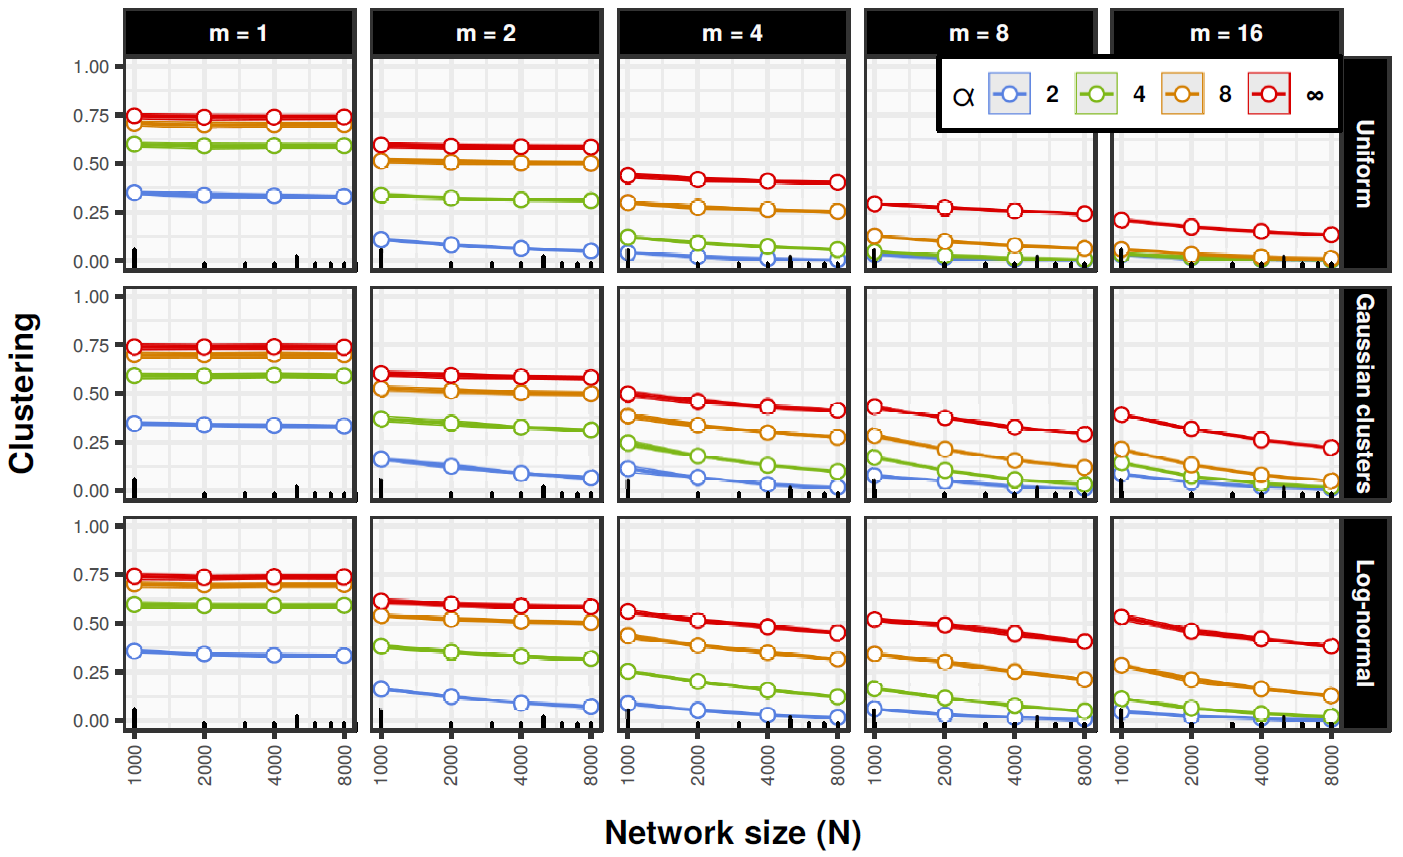
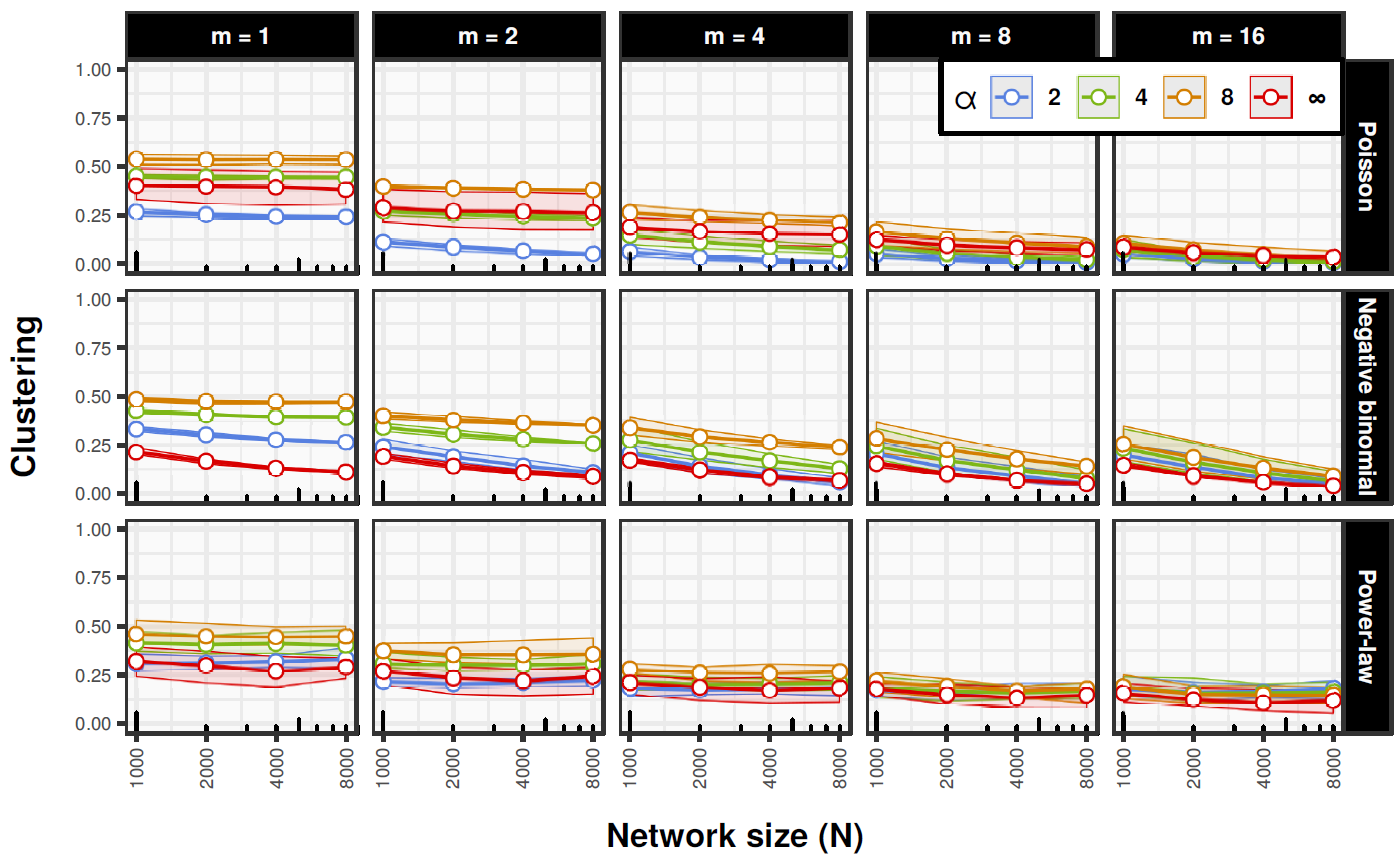
The simulations showed that for all of the embedding spaces clustering increases with \(\alpha\) and slightly decreases with system size and corresponding lower density of connections (see Figure 2). The relationship is approximately linear with respect to \(\log N\), but in low dimensional spaces (\(m = 1\) and \(m = 2\)) the level of clustering is approximately constant for all system sizes. Furthermore, clustering decreases markedly in higher dimensions and this effect seems to be strongest when nodes are distributed uniformly. This is consistent with the existing analytical results for RGGs with uniformly distributed nodes that show that clustering, while non-vanishing in the limit of large system size, decreases towards zero with the increasing number of dimensions of the embedding space (Dall & Christensen 2002). It suggests that homophily-induced clustering is more robust in higher dimensions when there is a natural grouping of nodes in the embedding space. Results are averaged jointly over networks with and without the random rewiring, but in all cases confidence bounds are very narrow indicating that there is little variation between different network realizations.
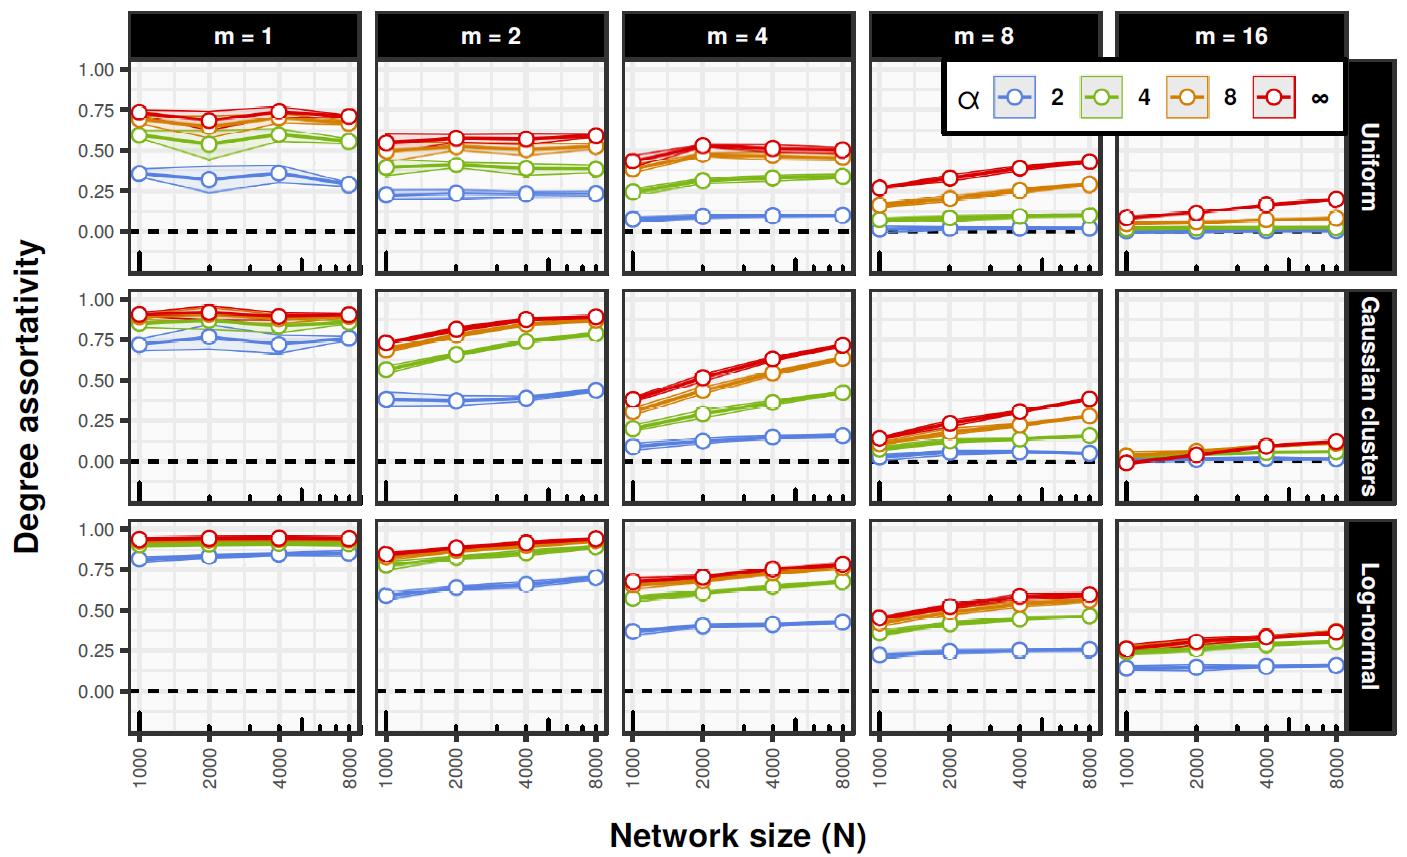
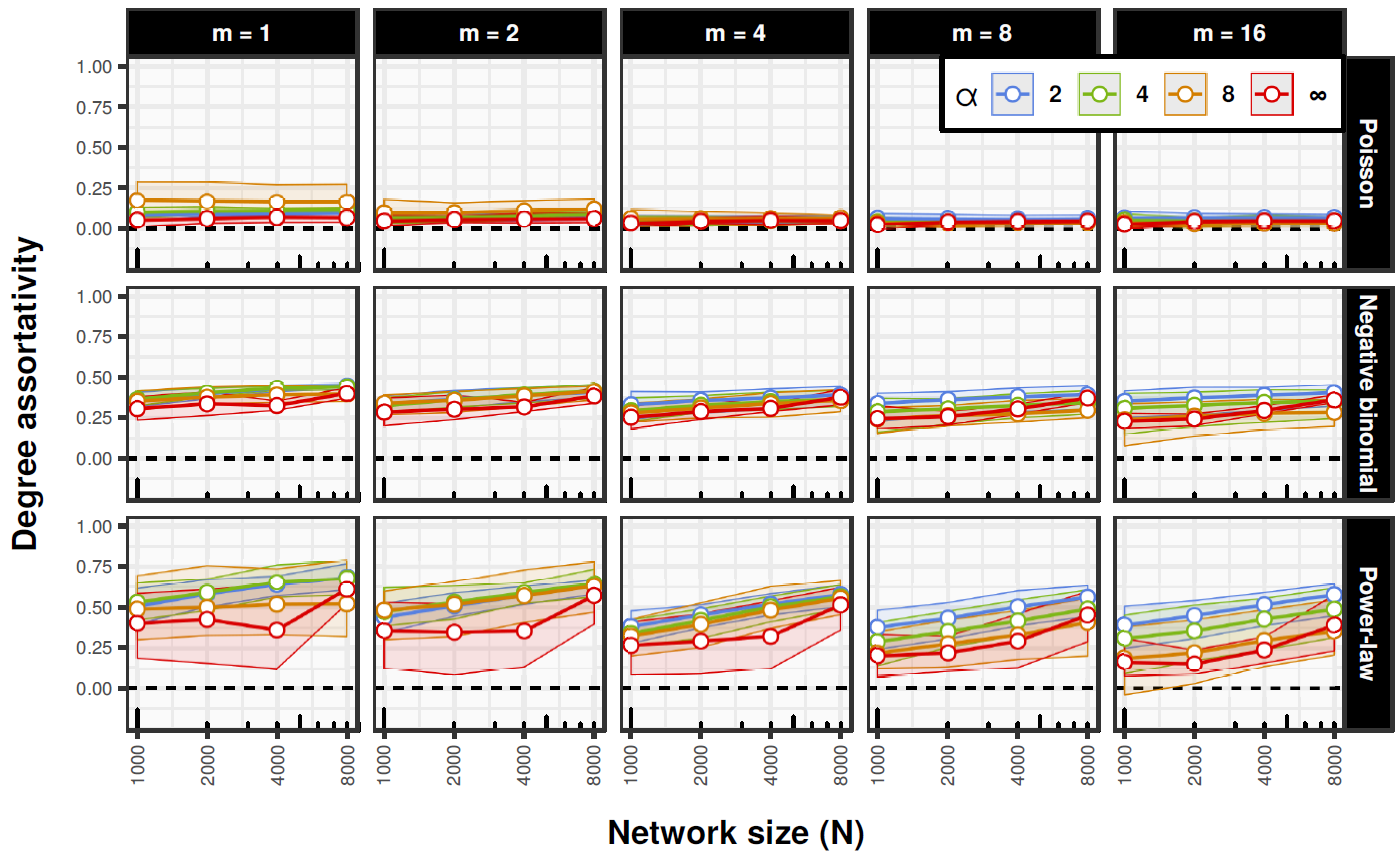
Assortativity (see Figure 3) also increases with \(\alpha\), but it also increases with \(N\), especially in higher dimensional spaces. The relationship is approximately linear with respect to \(\log N\). On average it also decreases with the dimensionality of an embedding space. Again, narrow confidence bounds show little variability between different network realizations and no significant differences between networks with and without the random rewiring.
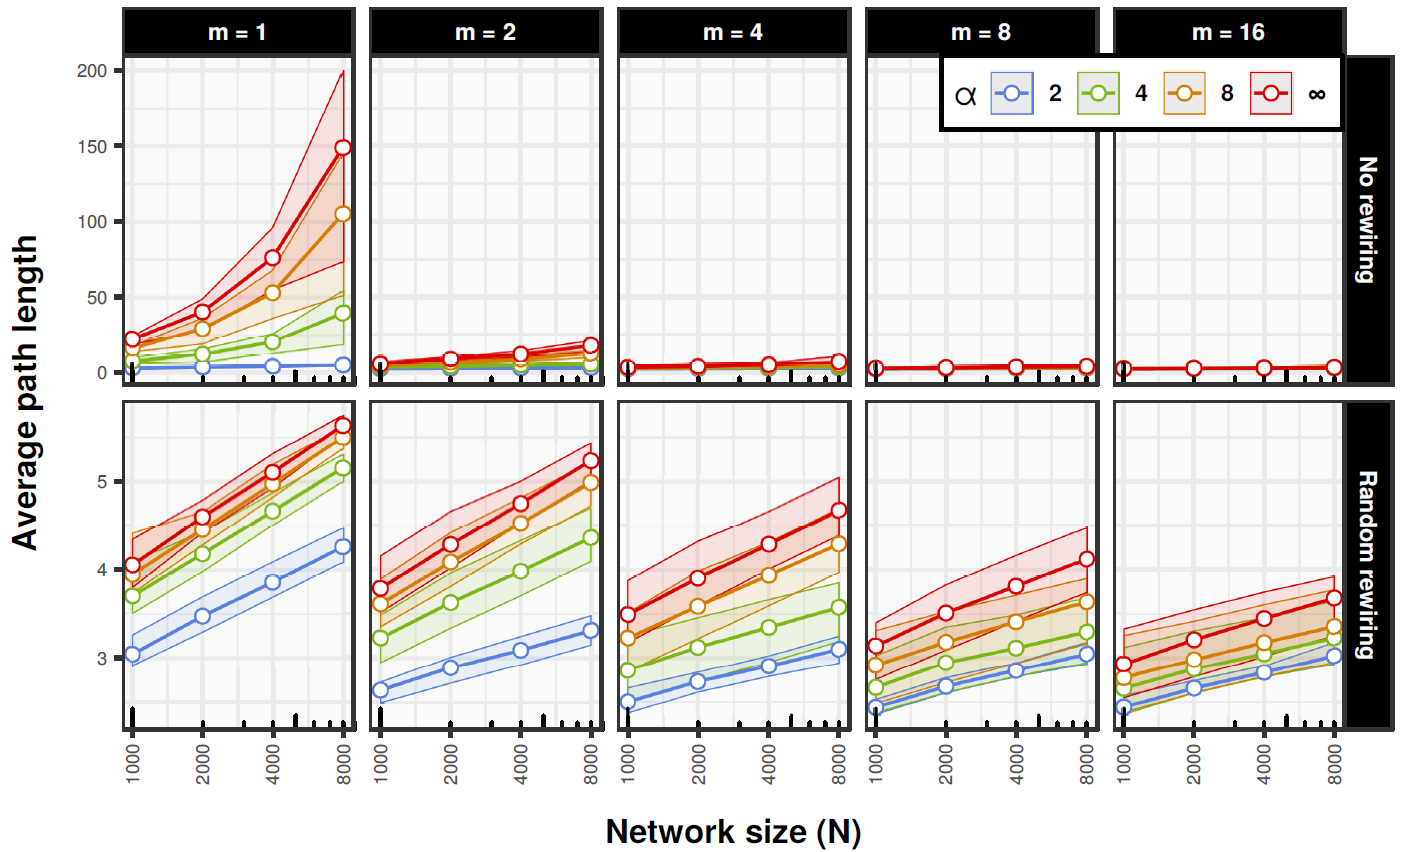
Average path lengths grow superlinearly with \(\log N\) in some cases when there is no random rewiring (see Figure 4). When the random rewiring is present average path lengths grow linearly with \(\log N\) in all cases. This shows that homophily by itself, especially when it is strong, does not yield the small-world effect. It suggests that in real social systems homophily-induced assortative mixing may be accompanied by more random-like processes creating some small number of relationships that go beyond structural constraints based on the structure of the social space. This connects very well to the seminal results concerning the importance of weak ties for connectivity and access to as well as distribution of resources in social networks (Granovetter 1973).
To assess the extent to which networks with the random rewiring conform to the small-world scaling we computed Pearson correlations between average path lengths and \(\log N\) for all combinations of parameters. Minimum correlation was 0.969, maximum 1 and median was 0.996. The scaling is almost perfectly linear, so we conclude that random rewiring ensures the small-world property in homophily-driven networks in all cases. Moreover, very narrow confidence bounds for clustering and assortativity show that the random edge rewiring does not affect these properties in any meaningful way, so it can be mixed with homophily without distorting or attenuating its main effects.
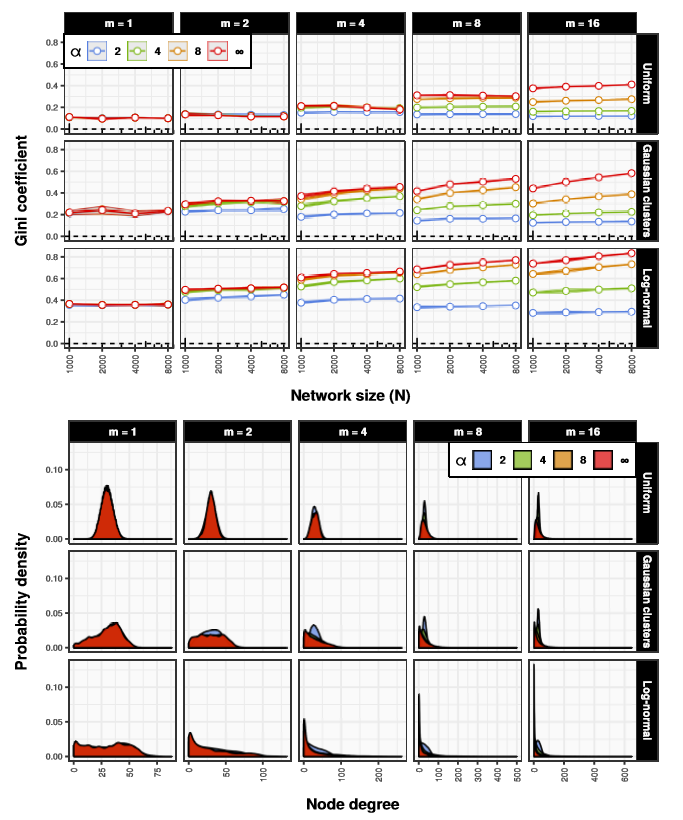
Diversity of degree distributions in terms of inequality (right-skewness) as measured with Gini coefficient (Badham 2013) clearly depends on the structure of social space (see Figure 5). The more clustered and concentrated the space is the more unequal is the distribution, so it is lowest for uniform social spaces and highest for log-normal ones. Also dimensionality of a space increases values of Gini coefficient. On the other hand the strength of homophily seems to matter only in higher dimensional spaces where it increases inequality when it is high and decreases when it is low. Also there is a clear linear scaling of inequality with respect to \(\log N\) in higher dimensions when homophily is strong. In general the results suggest that homophily is sufficient to generate a quite diverse range of degree distribution shapes.
Now we turn to the problem of boundedness of degree distributions. We have seen that homophily may lead to right-skewed degree distributions, but it is still unclear to what extent it may produce scale-free distributions. The Dunbar’s numbers hypothesis implies that strong power law degree distributions should be rare in social networks, so it is worthwhile to assess the prevalence of scale-free distributions in networks generated with SDA model. To do so, we use a statistical approach based on Extreme Value Theory developed by Voitalov et al. 2019). Our analysis showed that the prevalence of scale-free distributions in the simulated networks is really low. 4732 networks (98.6%) were classified as ‘not power laws’ (no statistical evidence of a power law tail) and 68 (1.4%) were classified as ‘hardly power laws’ (very little evidence of a power law tail) based on the classification scheme developed by the authors of the methodology. Hence, we conclude that homophily is unlikely to be sufficient to generate power law degree distributions.
Summary
In this section we presented and discussed an extensive simulation study of SDA model with respect to a variety of parameters’ configurations and embedding social spaces. The results confirm that SDA can produce networks with high clustering and positive degree assortativity that do not vanish in the limit of large system size. Therefore homophily may play an important role in the processes generating social networks for it reproduces the crucial properties of clustering and assortativity and at the same time has a natural sociological interpretation as well as has been frequently observed in empirical data. We also showed that (hard) RGG model properly describes the limiting behavior of SDA model when \(\alpha \to \infty\) and as such it can be used to deduce an approximate behavior of SDA with strong homophily.
Moreover, we showed that homophily alone does not guarantee the small-world property. In fact they can be in a direct conflict, especially when homophily is strong and the dimensionality of an embedding space is low. However, technically this problem can be remedied quite easily by randomly rewiring a small fraction of edges. Yet more importantly, it indicates that homophily, if occurs, is likely to be mixed with other random processes allowing some edges to go beyond structural constraints imposed by it.
Finally, right-skewness (inequality) of degree distributions clearly increases with system size and especially dimensionality of an embedding social space, so in general homophily is sufficient to generate a diverse range of degree distributions. Nevertheless, we found no evidence of scale-free distributions in the generated degree sequences, but applicability of this result is limited only to the boundaries of the parameters’ space that was explored. Moreover, the results indicate that degree distributions are to a large extent determined by geometry of an embedding social space. Together with the fact that levels of clustering and degree assortativity are relatively robust with respect to nodes’ position, it implies that the control over the distribution of positions in a social space allows some level of an indirect control over the shape of the degree distribution.
Social Distance Configuration Model
The configuration model which allows generating networks with arbitrary degree distributions, at least approximately if one corrects for multiple edges and self-loops, can be extended to produce also prespecified numbers of triangles and as a result arbitrary levels of clustering (Newman 2009). However, its formulation is strictly technical and algorithmic and as such can hardly be interpreted in sociological terms. Hence, it can be very useful analytically, but it is unclear what kind of theoretically significant social process it could represent. To address this issue we propose a hybrid model combining the standard configuration model with SDA model. For now we call it the Social Distance Configuration (SDC) model.
The idea is very simple. The algorithm of the ordinary configuration model can be defined as follows (Newman 2010, p. 435):
- Take a degree sequence \(k_1, k_2, ... , k_n\) (it must sum to an even number) and assign a degree \(k_i\) to each node. At this point node degrees represent not edges but so-called stubs or half-links.
- Choose a node uniformly at random from the set of all nodes with non-zero number of stubs and decrease its stub-degree by one.
- Choose another node in the same fashion and decrement its stub-degree. Note that it may be the same node.
- Connect the two selected nodes with an edge. Note that any given pair may be connected by multiple edges.
- Repeat steps 2-4 until there are no more free stubs.
The trick that we propose is to first compute edge creation probabilities according to SDA model and then sample pairs of nodes not uniformly at random but with probabilities proportional to corresponding edge creation probabilities. This achieves the objective of the configuration model, but does so in a way that privileges edges between nodes that are close to each other in an embedding social space. As a side effect, it allows setting very low connection probabilities (but necessarily non-zero) to multiple edges and self-loops so they can occur as rarely as possible. The pseudo-code is presented in the Appendix B.
The sociological rationale for this approach is the following. Connection probabilities are derived from SDA, which itself is based on the clearly interpretable notion of homophily. On this process we enforce an arbitrary degree sequence, of which interpretation depends on the context. For instance, preferential attachment can be interpreted in various social ways such as rich-get-richer mechanisms. At the same time it is associated with a well-defined degree distribution — a power law with the exponent \(\gamma \approx 3\). Hence, SDC may be used, for instance, to simulate preferential attachment process embedded in a social space with homophily. In general, SDC model makes it possible to study effects of homophily (as operationalized in SDA model) while allowing degree distributions to be constrained by some other processes.
In the next section we present the results of a simulation study of the behavior of SDC with respect to a variety of parameters’ values, social spaces and degree sequences. This will enable us to further explore properties of homophily as a social network generating process and examine its robustness under strict constraints imposed on degree distributions.
Simulation Study of Social Distance Configuration Model
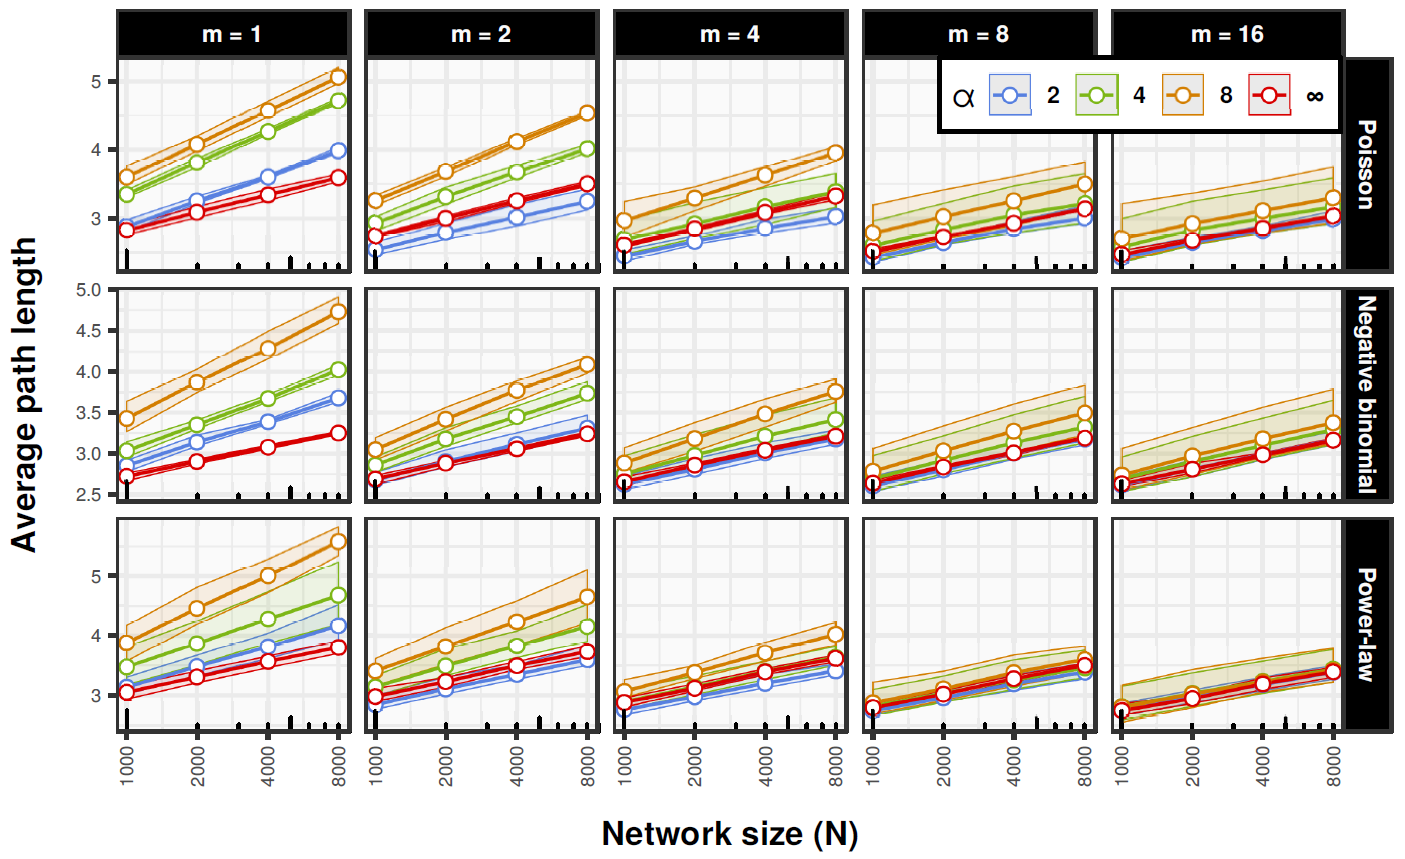
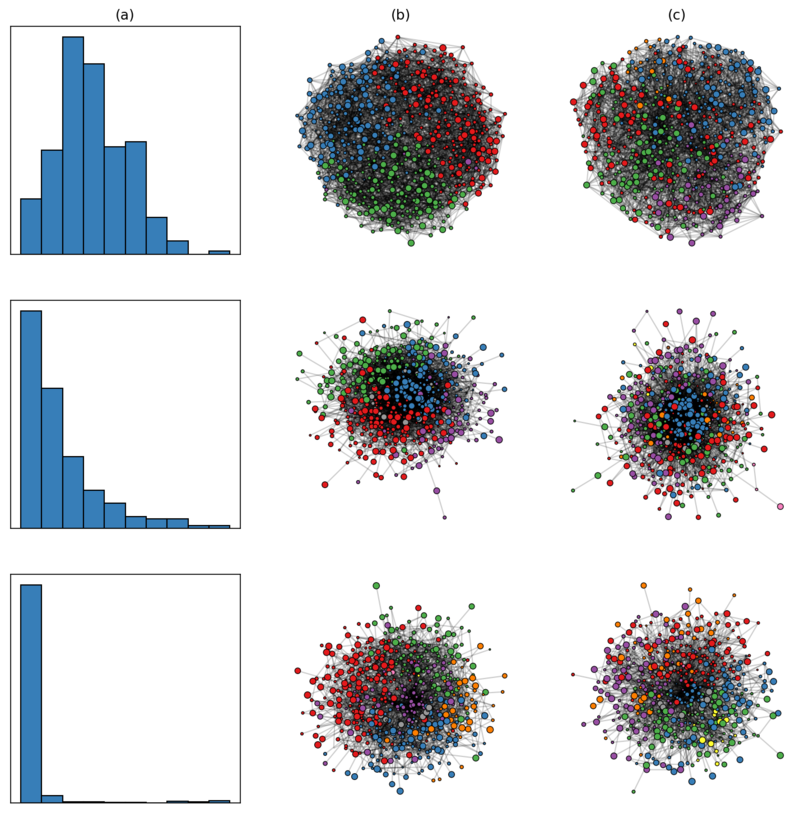
The setting is analogous to the simulation study of SDA model. We examine the behavior of SDC with the Euclidean distance metric with respect to clustering, degree assortativity and average path lengths under three enforced degree distributions: Poisson, negative binomial (\(n = 1\); \(p = 1 / 31\)) and discrete power law (characteristic exponent \(2 \leq \gamma \leq 3\)). All degree sequences are generated in such a way that their expected average values equal 30, which is the average degree simulated previously. Simulating Poisson and negative binomial sequences with fixed \(𝔼[k]\) is a trivial task, but power laws pose some technical difficulties. We describe our approach to simulating power law graph degree sequences with fixed \(𝔼[k]\) in the Appendix C. The types of degree distributions were selected to cover three very typical qualitatively different cases:
- Approximately symmetric distribution with finite moments (Poisson).
- Right-skewed distribution with finite moments (negative binomial).
- Right-skewed distribution with infinite moments (power law). Even though the prevalence of power law degree distributions in social networks is debatable, this case is still important for the study as it provides an ideal type for a strongly right-skewed distribution (dominated by few hubs), which is qualitatively different from more “well-behaved” right-skewed distributions with finite moments.
The same space of parameters’ values was explored, only this time we did not explore differences between networks with and without rewiring (\(p_{rewire}\) is set to 0.01 for all cases). All together the following parameters were used (see Appendix D for network examples):
- degree sequence: Poisson, negative binomial, power law
- system size (\(N\)): \(1000, 2000, 4000, 8000\)
- – uniform
- – \(4\) Gaussian clusters (spherical groups formed as multivariate Gaussian noise with different centroids)
- – lognormal (coordinates sampled from independent lognormal distributions)
- dimensionality of social space (\(m\)): \(1, 2, 4, 8, 16\)
- homophily (\(\alpha\)): \(2, 4, 8, \infty\) (hard RGG)
- expected average degree (\(𝔼[[k]\)): \(30\)
- probability of random rewiring (\(p_{rewire}\)): \(0.01\)
Every parameters’ configuration was run 12 times (2 independent realizations of a social space and 6 independent realizations of a degree sequence). This totaled to 8639 realizations (one run was dropped due to computational issues).
The general qualitative behavior of SDC with respect to clustering is similar to SDA (see Figure 2). In low dimensional spaces it is approximately constant regardless of system size, while in higher dimensional spaces it decreases approximately linearly with \(\log N\). However, general levels of clustering are markedly lower than in the case of SDA and hard RGG (\(\alpha = \infty\)) often exhibit lower clustering than SDC realizations with finite \(\alpha\). This is due to the fact that in hard RGG all nodes beyond the characteristic distance \(b\) look the same from the vantage point of connection probability (see Appendix B). This makes it more likely that some of the edges will be purely random and as result decreases clustering and assortativity. This is a computational artifact with no meaningful social interpretation, so perhaps it is preferable to run SDC with finite values of \(\alpha\).
With respect to degree assortativity the behavior of SDC is more complicated and there are some important differences between types of degree sequences (see Figure 7). In particular, it should be noted that in almost all cases assortativity for Poisson degree sequences is near zero and remains stable irrespective of the size of a system or the dimensionality of a social space, while in the case of negative binomial distributions it is approximately fixed around the value of \(0.3\). On the other hand power law sequences have more variability, but in general effects of the strength of homophily (\(\alpha\)) are quite weak. This, combined with the SDA model results concerning assortativity, suggests that the influence of \(\alpha\) on degree assortativity is largely dependent on the ability of homophily to reorganize degree distributions, so when they are fixed the influence decreases. On the other hand, also when combined with degree distribution constraints, homophily still seems to be unable to generate networks with negative assortativity, which points to the robustness of its connection to non-negative degree correlations.
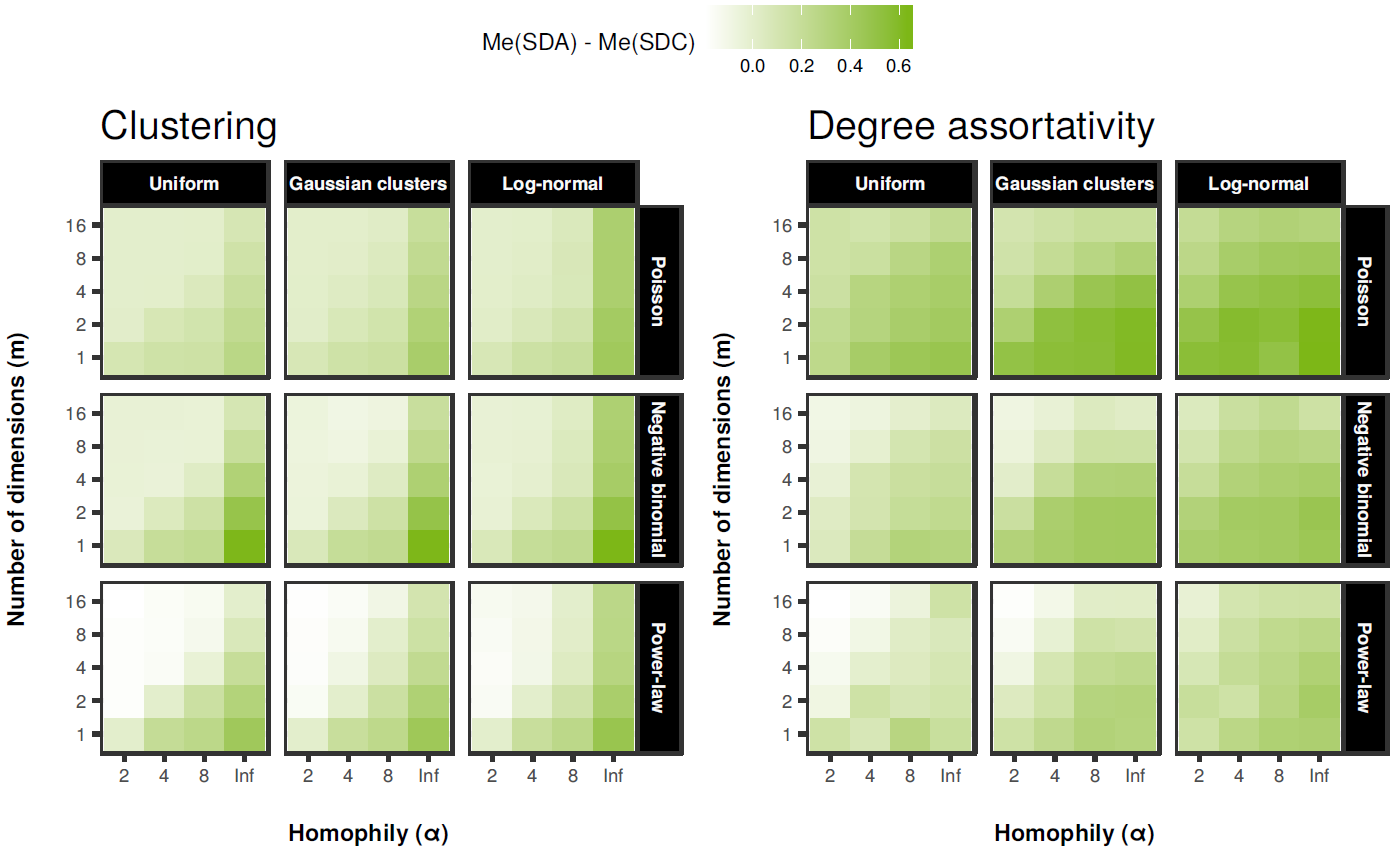
Additionally, we assessed differences between median values of clustering and assortativity in SDA and SDC networks (see Figure 8 for details). We found that in most of the cases SDC networks have both lower clustering and degree assortativity. The differences are largest for Poisson degree sequences and smallest for power laws. They also tend to be more pronounced when homophily is strong and slightly weaker in higher dimensional social spaces. This confirms that constraints on degree distributions attenuate the effects of homophily, although they do not cancel them completely. Thus, the results show that homophily as a network generating process may operate alongside other processes that constrain degree distributions without loosing its crucial influence on clustering.
Figure 9 shows the relationship between average path lengths and \(\log N\) in SDC model with the random edge rewiring. We see that in all cases the scaling is almost perfectly linear (bootstraped \(r \in [0.976, 1]\) with median of 0.999). Therefore, the process of random edge rewiring provides the small-world effect. Again, we see surprising results in the case of \(\alpha = \infty\), which tend to have lowest average path lengths. This is caused by the same computational issue as the anomalies concerning clustering and assortativity.
Summary
In this section we introduced a hybrid model combining SDA and the configuration model that allows generating social distance attachment networks with arbitrary degree distributions. We showed that in general the model behaves similarly to SDA, but in some cases its exact behavior strongly depends on imposed degree sequence. The results have also more theoretical implications. They show that homophily may operate in parallel to other process that impose constraints on degree distributions and still yield significantly positive clustering and in some cases positive assortativity as well, although this property seems to depend on degree distribution to a much larger extent. Therefore, homophily-induced clustering appears to be relatively robust with respect to degree distribution constraints. This provides further evidence that homophily may be an important process shaping real-world social networks, also when interwoven with other processes.
Discussion
Our results based on the Social Distance Attachment (SDA) model show that homophily can generate sparse networks with non-trivial clustering, positive degree assortativity and diverse degree distributions, including approximately symmetric as well as markedly right-skewed ones but no power laws. Hence, the principle of homophily is a sufficient condition for most of the typical properties of social networks to emerge. The results are consistent with a rich body of research indicating that homophily links social structure and social networks and shapes network structures (Blau 1977; Marsden 1987; Popielarz & McPherson 1995; McPherson et al. 2001; Kossinets & Watts 2009; Centola & van de Rijt 2015; Halberstam & Knight 2016). In our analysis we considered what we call the static view of homophily (see Section 2.2). In general, similarity between connected agents may be both due to selection (similarity breeds connection) or to social influence (connection breeds similarity) (Anagnostopoulos et al. 2008; Flache et al. 2017). However, the principle of homophily in its most general form is a statement about a correlation which just implies that on average connected agents are more similar than disconnected ones. Therefore we argued that it is important to study typical network structures that such a probabilistic pattern leads to, since if homophily is really an important force shaping networks, then such structures should be also relatively common in observed social networks. We showed that networks generated by homophily have most of the typical structural features of many social networks, so our results complement existing empirical evidence of the link between homophily and the structure of social networks.
Our analysis was based on formal models and computer simulations. This allowed us to study effects of both pure homophily and homophily mixed with other processes in a controlled and isolated manner. Through this we were able to show that the small-world property (Watts & Strogatz 1998) is not implied by homophily. In fact they can be in a direct conflict, especially when the strength of homophily is high and/or the social space is simple, that is, has few dimensions. However, we also showed that if some small fraction of edges is random then the small-worldness is guaranteed without destroying the structure induced by homophily (i.e. sparsity, high clustering, positive degree assortativity and degree distributions). This suggests that other processes ensuring some degree of randomness of social ties are necessary, which is consistent with the seminal results concerning the importance of weak ties (Granovetter 1973).
Our formal approach allowed us also to extend SDA model and combine it with the configuration model (Newman et al. 2001) to study effects of homophily with arbitrary degree sequence constraints. Based on this we showed that clustering induced by homophily is relatively robust and independent of a particular degree dis-ribution. On the other hand degree assortativity is strongly influnenced by the degree distributions, so once a distribution is fixed, assortativity is largely independent of the strength of homophily.
Last but not least, we derived our formal model from first principles based on the direct correspondence between the principle of homophily and random geometric graphs (Dall & Christensen 2002). This makes our synthetic results much less arbitrary and means that they can be considered an important addition to the large body of empirical results concerning connections between social structure, homophily and social networks. Let us also note that much of the theory of social structure (Blau 1977) is based on the assumption that the principle of homophily holds. Our results showing that homophily is sufficient to generate most of the typical structural properties of social networks provide an additional indirect validation of the correctness of this assumption. It is important since most of the empirical evidence for the principle of homophily stays at the micro level of the observed similarities between related social agents (e.g. Marsden 1987; Aiello et al. 2012). Our results add to that a formal support at the macro level as they show that the principle of homophily is also congruent with typical macrostructures of social networks.
We also note that our results suggest that homophily is unlikely to lead to significantly negative degree assortativity, at least under circumstances similar to those we studied. On the other hand of course not all social networks have positive degree correlations (see Estrada (2011) for some examples). Hence, it is possible that there is a broad class of networks for which homophily can not be the main generating process. This allows us to formulate a crude rule of thumb that may be helpful for assessing homophily/lack of homophily in real-world social networks:
- Clustering and positive assortativity \(\Longrightarrow\) Homophily can be the leading generating process
- Near zero clustering and/or assortativity \(\Longrightarrow\) Inconclusive
- Significantly negative assortativity \(\Longrightarrow\) Homophily can not be the leading generating process
The ‘rule’ we propose is of course greatly oversimplified, but we believe it may be useful as a first guess when trying to assess possible generating mechanisms of a social network.
Even though we derived our model and formalization of the homophily principle in a systematic and analytic manner, it can not be ruled out that some other models would be more appropriate and yield different results and conclusions. Therfore it would be worthwhile to check in future studies the robustness of our results based on other possible formalizations of homophily-like processes. However, some similar work has already been done and it points to the robustness of our results (e.g. Hamill & Gilbert 2009). Furthermore, as we pointed earlier, our analysis was based on the static view of homophily which does not differentiate between value/choice and status/induced homophily as well as effects of selection and influence. Thus, our results say little about the extent to which the typical properties of social networks are shaped by any of these more specific social forces. More dynamical analyses, both empirical and formal/analytical, are needed to answer this question (some good examples can be found in: Centola et al. 2007; Anagnostopoulos et al. 2008; Kossinets & Watts 2009; Carletti et al. 2011; Centola & van de Rijt 2015). However, there are also some partial results indicating that homophily-based selection may be more prevalent than influence (Anagnostopoulos et al. 2008). If this is the case, then it is more justified to interpret our results in terms of causal effects of homophily on the structure of social networks.
Conclusion
In this paper we studied the extent to which the homophily principle (McPherson et al. 2001) is sufficient to explain the typical structural properties of social networks such as sparsity, high clustering, positive degree assortativity, short average path lengths (small-worldness) and right-skewed but not scale-free distributions. To do so we conducted simulation studies based on the Social Distance Attachment (SDA) model introduced by Boguñá et al. (2004), which is a type of a random geometric graph (RGG) (Dall & Christensen 2002). We derived the form of the model from first principles based on the direct correspondence between the homophily principle and RGGs and showed that homophily is indeed sufficient to reproduce most of the typical properties of social networks, but it does not imply the small-world property. However, we also showed that even a small amount of random edge rewiring, as done by Watts & Strogatz (1998), is enough to guarantee it without destroying the structure induced by homophily.
We also extended SDA model and combined it with the configuration model (Newman et al. 2001) in order to study homophilic networks with arbitrary degree distributions. We used it to further examine the robustness of the effects of homophily. We found that clustering is relatively independent of degree distribution constraints, while degree assortativity depends strongly on the degree distribution and only weakly on the strength of homophily.
Our results complement existing literature on linkages between social structure, homophily and social networks by showing that under very general assumptions homophily leads to network structures that are characteristic for many observed social networks. This suggests that it should be considered one of the important generative processes for social networks. Moreover, based on our results we proposed a simple rule of thumb for distinguishing between networks that are likely and unlikely to be shaped by homophily.
Last but not least, our results are of use also from a purely practical perspective, since we provide researchers with two graph models that can be used to efficiently simulate networks with a wide range of structural features typically observed in real-world social networks.
Acknowledgements
The authors thank Tomasz Zarycki for general discussions and the encouragement and Ivan Voitalov for the advice on detection and classification of power law tails as well as long discussions about random geometric graphs. We also express our gratitude to the anonymous reviewers for very helpful comments.Author contributions: S.T. and A.N. conceived the project and planned the structure of the paper. S.T. wrote the paper, implemented the models, run the simulations and performed the analyses.
Funding. A.N. acknowledges the support of a grant from Polish National Science Center (DEC-2011/02/A/HS6/00231).
Notes
- Social spaces in the works of Blau and Bourdieu are two quite different concepts, but they are both formulated in explicit geometric terms.
- https://www.comses.net/codebases/1adc39e5-344c-428c-9a20-fd53d791709b/releases/1.1.0/.
- Fermi-Dirac distribution is used in quantum physics and is usually defined with a slightly different but equivalent parametrization. Here we present it in a form that is most easily interpreted in terms of homophily. The larger system size, the better the approximation.
- In practice one would want to use a more efficient algorithm such as TOMS 748 (Alefeld et al. 1995), which is exactly the method we used in our implementation of the model.
Appendix
A: Example social spaces and network realizations (SDA)
B: SDC algorithm pseudo-code
Let \(k_1, k_2, ..., k_N\) be a degree sequence for \(N\) nodes (must sum to an even number), \({P}_N = (p_{ij}) \in [0, 1]\) be a \(N\)-by-\(N\) connection probabilities matrix derived from SDA model and \({A}_N = (a_{ij}) = 0\) be an empty adjacency matrix filled with zeros.
- Set \(p_{\text{malformed}} \in (0, 1)\) to some preferably very small, but non-zero value (i.e. \(10^{-9}\)).
- For \(i, j = 1, ..., N\):
- If \(p_{ij} = 0\): set \(p_{ij} = p_{\text{malformed}}\).
- For \(i = 1, ..., N\):
- If \(k_i = 0\): set \(p_{ij} = 0\) for \(j = 1, ..., N\).
- Select a node \(n_i\) at random with selection probabilities \(p(n_i) = \sum_{k = 1}^N p_{ik} / \sum_{j=1}^N\sum_{k=1}^N p_{jk}\) and decrease its number of stubs \(k_i\) by one.
- Select a node \(n_j\) at random with selection probabilities \(p(n_j) = p_{ij} / \sum_{k=1}^N p_{ik}\) and decrease its number of stubs \(k_j\) by one.
- Set \(a_{ij} = a_{ij} + 1\).
- If \(a_{ij} \geq 1\): set \(p_{ij} = p_{\text{malformed}}\).
- Repeat steps 4-8 until \(k_i = 0\) for all \(i = 1, ..., N\).
Note that steps 5 and 6 ensure that at each iteration every available edge is selected with probability proportional to its current \(p_{ij}\). Morever, the fact that self-loops and multiple edges may be created means that degree sequences do not have to meet the formal realizability conditions (Hakimi 1962).
The algorithm is implemented in Python in the method conf_model of the SDA class in sdnet/sda.py.
C: Simulating power law distributed degree sequences
Simulating power law distributed degree sequences for networks of given size and with given \(𝔼[k]\) is not a trivial task. A standard generator of pseudorandom numbers with, for instance, Pareto distribution will not do, because it may generate numbers bigger than the size of a network and does not guarantee that a sequence will sum to an even number. Moreover, in this case it is absolutely not clear as to what particular value of the characteristic exponent \(\gamma\) should be chosen. To solve all these problems we simulated degree sequences via the standard preferential attachment (PA) process (Barabasi & Albert 1999) with new nodes establishing \(m = [\frac{1}{2}𝔼[k]]\). This fixes the average degree exactly to the desired value and determines proper \(\gamma\). Also PA process will of course never yield values larger than the system size. However, it sets an artificial lower bound on node degrees at \(m\). To solve this, we also add uniform integer noise in the range \([-m, m]\) and cap high values at \(N-1\) (the maximum number of edges a node can have).
| Power law class | |||||
| N | NPL | HPL | PL | DSM | PL or DSM |
| 1000 | 36 | 11 | 3 | 14 | |
| 2000 | 28 | 15 | 7 | 22 | |
| 4000 | 27 | 20 | 3 | 23 | |
| 8000 | 25 | 17 | 8 | 25 |
We tested validity of this approach using the methods for classifying tail behavior developed by Voitalov et al. (2019). Table 1 shows the results. Degree sequences for higher values of \(N\) tend to be classified as PL or DSM more often. Moreover, all degree sequences have been classified at least as HPL. This, together with the fact that PA process yields power laws only asymptotically, indicates that our method is reasonably effective.
D: Example degree sequences and network realizations (SDC)
References
AIELLO, L. M., Barrat, A., Schifanella, R., Cattuto, C., Markines, B. & Menczer, F. (2012). Friendship prediction and homophily in social media. ACM Transactions on the Web, 6(2), 1–33. [doi:10.1145/2180861.2180866]
ALEFELD, G. E., Potra, F. A. & Shi, Y. (1995). Algorithm 748: Enclosing zeros of continuous functions. ACM Transactions on Mathematical So ware (TOMS), 21(3), 327–344. [doi:10.1145/210089.210111]
ANAGNOSTOPOULOS, A., Kumar, R. & Mahdian, M. (2008). Influence and correlation in social networks. In Proceed-ings of the 14th ACM SIGKDD International Conference on Knowledge Discovery and Data Mining, (pp. 7–15). Las Vegas, Nevada, USA: ACM Press. [doi:10.1145/1401890.1401897]
ANTONIONI, A. & Tomassini, M. (2012). Degree correlations in random geometric graphs. Physical Review E, 86(3), 037101. [doi:10.1103/physreve.86.037101]
BADHAM, J. M. (2013). Measuring the shape of degree distributions: A commentary. Network Science, 1(2), 213– 225. [doi:10.1017/nws.2013.10]
BARABASI, A.-L. & Albert, R. (1999). Emergence of scaling in random networks. Science, 286(5439), 509–512.
BIANCHI, F. & Squazzoni, F. (2015). Agent-based models in sociology: Agent-based models in sociology. WileyInterdisciplinary Reviews: Computational Statistics, 7(4), 284–306. [doi:10.1002/wics.1356]
BLAU, P. M. (1977). A macrosociological theory of social structure. American Journal of Sociology, 83(1), 26–54. [doi:10.1086/226505]
BOGUÑÁ, M., Pastor-Satorras, R., Díaz-Guilera, A. & Arenas, A. (2004). Models of social networks based on social distance attachment. Physical Review E, 70(5), 056122. [doi:10.1103/physreve.70.056122]
BOURDIEU, P. (1986). Distinction : A Social Critique of the Judgement of Taste. London: Routledge.
BOURDIEU, P. (1989). Social space and symbolic power. Sociological Theory, 7(1), 14–25.
BROIDO, A. D. & Clauset, A. (2019). Scale-free networks are rare. Nature Communications, 10(1), 1017. [doi:10.1038/s41467-019-08746-5]
BURDER, R. L. & Faires, J. D. (2010). Numerical Analysis. Boston, MA: Cengage Learning.
CARLETTI, T., Righi, S. & Fanelli, D. (2011). Emerging structures in social networks guided by opinions’ exchanges. Advances in Complex Systems, 14(01), 13–30. [doi:10.1142/s021952591100286x]
CENTOLA, D., Gonzalez-Avella, J. C., Eguiluz, V. M. & Miguel, M. S. (2007). Homophily, cultural dri and the co-evolution of cultural groups. Journal of Conflict Resolution, 51(6), 905–929. [doi:10.1177/0022002707307632]
CENTOLA, D. & van de Rijt, A. (2015). Choosing your network: Social preferences in an online health community. Social Science & Medicine, 125, 19–31. [doi:10.1016/j.socscimed.2014.05.019]
CLAUSET, A., Newman, M. E. J. & Moore, C. (2004). Finding .community structure in very large networks. Physical Review E, 70(6), 066111 [doi:10.1103/physreve.70.066111]
COLLEONI, E., Rozza, A. & Arvidsson, A. (2014). Echo chamber or public sphere? Predicting political orientation and measuring political homophily in Twitter using big data: Political homophily on Twitter. Journal of Communication, 64(2), 317–332. [doi:10.1111/jcom.12084]
CSARDI, G. & Nepusz, T. (2006). The igraph so ware package for complex network research. InterJournal, Complex Systems, 1695.
DALL, J. & Christensen, M. (2002). Random Geometric Graphs. Physical Review E, 66(1), 016121.
ERDŐS, P. & Rényi, A. (1959). On random graphs I. Publicationes Mathematicae, 6, 290–297.
ESTRADA, E. (2011). Combinatorial study of degree assortativity in networks. Physical Review E, 84(4), 047101.
FLACHE, A., Mäs, M., Feliciani, T., Chattoe-Brown, E., Deffuant, G., Huet, S. & Lorenz, J. (2017). Models of social influence: Towards the next frontiers. Journal of Artificial Societies and Social Simulation, 20(4), 2: https://www.jasss.org/20/4/2.html. [doi:10.18564/jasss.3521]
GRANOVETTER, M. S. (1973). The strength of weak ties. American Journal of Sociology, 78(6), 1360–1380. [doi:10.1086/225469]
HAKIMI, S. L. (1962). On realizability of a set of integers as degrees of the vertices of a linear graph. I. Journal of the Society for Industrial and Applied Mathematics, 10(3), 496–506. [doi:10.1137/0110037]
HALBERSTAM, Y. & Knight, B. (2016). Homophily, group size, and the diffusion of political information in social networks: Evidence from Twitter. Journal of Public Economics, 143, 73–88. [doi:10.1016/j.jpubeco.2016.08.011]
HAMILL, L. & Gilbert, N. (2009). Social circles: A simple structure for agent-based social network models. Journal of Artificial Societies and Social Simulation, 12(2), 3: https://www.jasss.org/12/2/3.html.
HILL, R. A. & Dunbar, R. (2003). Social network size in humans. Human Nature, 14(1), 53–72.
HOFF, P. D., Raffery, A. E. & Handcock, M. S. (2002). Latent space approaches to social network analysis. Journal of the American Statistical Association, 97(460), 1090–1098. [doi:10.1198/016214502388618906]
JIANG, Y., Bolnick, D. I. & Kirkpatrick, M. (2013). Assortative mating in animals. The American Naturalist, 181(6), E125–E138. [doi:10.1086/670160]
KOSSINETS, G. & Watts, D. J. (2009). Origins of homophily in an evolving social network. American Journal of Sociology, 115(2), 405–450 [doi:10.1086/599247]
KRIOUKOV, D. (2016). Clustering implies geometry in networks. Physical Review Letters, 116(20), 208302. [doi:10.1103/physrevlett.116.208302]
LATANE, B. (1981). The psychology of social impact. American Psychologist, 36(4), 343–356.
LESKOVEC, J. & Horvitz, E. (2008). Planetary-Scale Views on an Instant-Messaging Network. In Proceedings of the 17th International Conference on World Wide Web, (pp. 915–924). ACM. [doi:10.1145/1367497.1367620]
LUSSEAU, D. & Newman, M. E. J. (2004). Identifying the role that animals play in their social networks. Proceedings of the Royal Society of London. Series B: Biological Sciences, 271(suppl_6). [doi:10.1098/rsbl.2004.0225]
MAC CARRON, P., Kaski, K. & Dunbar, R. (2016). Calling Dunbar’s numbers. Social Networks, 47, 151–155. [doi:10.1016/j.socnet.2016.06.003]
MARSDEN, P. V. (1987). Core discussion networks of americans. American Sociological Review, 52(1), 122 [doi:10.2307/2095397]
MCPHERSON, J. M. (1983). An ecology of affiliation. American Sociological Review, 48(4), 519–532. [doi:10.2307/2117719]
MCPHERSON, J. M. (2004). A Blau space primer: Prolegomenon to an ecology of affiliation. Industrial and Corporate Change, 13(1), 263–280. [doi:10.1093/icc/13.1.263]
MCPHERSON, J. M. & Smith-Lovin, L. (1987). Homophily in voluntary organizations: Status distance and the com-position of face-to-face groups. American Sociological Review, 52(3), 370–379. [doi:10.2307/2095356]
MCPHERSON, J. M., Smith-Lovin, L. & Cook, J. M. (2001). Birds of a feather: Homophily in social networks. Annual Review of Sociology, 27(1), 415–444. [doi:10.1146/annurev.soc.27.1.415]
NEWMAN, M. E. J. (2002). Assortative mixing in networks. Physical Review Letters, 89(20), 208701.
NEWMAN, M. E. J. (2009). Random graphs with clustering. Physical Review Letters, 103(5), 058701.
NEWMAN, M. E. J. (2010). Networks: An Introduction. Oxford: Oxford University Press.
NEWMAN, M. E. J. & Park, J. (2003). Why social networks are different from other types of networks. Physical Review E, 68(3), 036122.
NEWMAN, M. E. J., Strogatz, S. H. & Watts, D. J. (2001). Random graphs with arbitrary degree distributions and their applications. Physical Review E, 64(2), 026118. [doi:10.1103/physreve.64.026118]
NOWAK, A., Szamrej, J. & Latane, B. (1990). From private attitude to public opinion: A dynamic theory of social impact. Psychological Review, 97(3), 362–376. [doi:10.1037/0033-295x.97.3.362]
NOWAK, A. & Vallacher, R. R. (1998). Dynamical Social Psychology. New York, NY: Guilford Press.
POPIELARZ, P. A. & McPherson, J. M. (1995). On the edge or in between: Niche position, niche overlap, and the duration of voluntary association memberships. American Journal of Sociology, 101(3), 698–720. [doi:10.1086/230757]
R CORE TEAM (2019). R: A Language and Environment for Statistical Computing.
SCHEINERMAN, E. R. & Tucker, K. (2010). Modeling graphs using dot product representations. Computational Statistics, 25(1), 1–16. [doi:10.1007/s00180-009-0158-8]
SOBKOWICZ, P. (2009). Modelling opinion formation with physics tools: Call for closer link with reality. Journal of Artificial Societies and Social Simulation, 12(1), 11: https://www.jasss.org/12/1/11.html.
STOCKER, R., Green, D. G. & Newth, D. (2001). Consensus and cohesion in simulated social networks. Journal of Artificial Societies and Social Simulation, 4(4), 5: https://www.jasss.org/4/4/5.html.
STROUD, P., Del Valle, S., Sydoriak, S., Riese, J. & Mniszewski, S. (2007). Spatial dynamics of pandemic influenza in a massive artificial society. Journal of Artificial Societies and Social Simulation, 10(4), 9: https://www.jasss.org/10/4/9.html.
TRAVERS, J. & Milgram, S. (1969). An experimental study of the small world problem. Sociometry, 32(4), 425–443. [doi:10.2307/2786545]
VOITALOV, I., van der Hoorn, P., van der Hofstad, R. & Krioukov, D. (2019). Scale-free networks well done. Physical Review Research, 1(3). [doi:10.1103/physrevresearch.1.033034]
WATTS, D. J. & Strogatz, S. H. (1998). Collective dynamics of ‘small-world’ networks. Nature, 393(6684), 440. [doi:10.1038/30918]