
 Abstract
- This article has two primary objectives: (i) to replicate an agent-based model of social interaction by Bhavnani (2003), in which the author explicitly specifies mechanisms underpinning Robert Putnam's (1993) work on Civic Traditions in Modern Italy, bridging the gap between the study's historical starting point—political regimes that characterized 14th Century Italy—and contemporary levels of social capitalóreflected in a 'civic' North and an 'un-civic' South; and (ii) to extend the original analysis, using a landscape of Italy that accounts for population density. The replication exercise is performed by different authors using an entirely distinct ABM toolkit (PS-I) with its own rule set governing agent-interaction and cultural change. The extension, which more closely approximates a docking exercise, utilizes equal area cartograms otherwise known as density-equalizing maps (Gastner and Newman 2004) to resize the territory according to 1993 population estimates. Our results indicate that: (i) using the criterion of distributional equivalence, we experience mixed success in replicating the original model given our inability to restrict the selection of partners to 'eligible' neighbors and limit the number of agent interactions in a timestep; (ii) increasing the number of agents and introducing more realistic population distributions in our extension of the replication model increases distributional equivalence; (iii) using the weaker criteria of relational alignment, both the replication model and its extension capture the basic relationship between institutional effectiveness and civic change, the effect of open boundaries, historical shocks, and path dependence; and (iv) that replication and docking may be usefully combined in model-to-model analysis, with an eye towards verification, reimplementation, and alignment.
- Keywords:
- Replication, Docking, Agent-Based Model, Italy, Social Capital
Introduction
- 1.1
- In his seminal book entitled Making Democracy Work, Robert Putnam advances a controversial hypothesis: "[that] … social patterns, plainly traceable from early medieval to present day Italy turn out to be decisive in explaining why, on the verge of the twenty-first century, some communities are better able than others to manage collective life and sustain effective institutions" (Putnam 1993, p. 121). Yet, Putnam's work is missing what Margaret Levi (1996, p. 46) refers to as mechanisms for the "production, maintenance, and growth of social capital"-mechanisms to link the historical social context, namely political regimes that characterized 14th Century Italy, with the present social order-leaving the reader to infer how "civic" and "uncivic" communities in contemporary Italy emerged from their historical starting points.[1]
- 1.2
- In an article published in the Journal of Artificial Societies and Social Simulation, Bhavnani (2003) attempts to address this shortcoming by modeling one process by which historical political units could have evolved into more or less civic regions in present day Italy. The agent-based model (ABM) developed in MATLAB is used by Bhavnani to further test Putnam's argument-through a series of counterfactual experiments to assess the impact of political boundaries, historical shocks, and institutional reform-on the formation of civic or uncivic communities. By analyzing how different institutions interact with heterogeneous individuals, the analysis provides additional insight into why contemporary Italy is characterized by a civic North and an un-civic South.
- 1.3
- Specifically, Bhavnani's analysis suggests that: (i) the difference in civicness between North and South is unlikely to have been deterministic, since small changes in the course of history could significantly affect the development of civic communities; (ii) small improvements in institutional effectiveness could lead to large improvements in the quality of reputational information, and thus to more positive interactions among agents; (iii) the absence of political boundaries increases the aggregate level of agent interaction, but decreases civicness since trusting and trustworthy agents from civic regimes interact with others who are less likely to share these traits; (iv) that societies with high levels of civicness which experience exogenous shocks late in their development are less likely to recover to pre-shock level of civicness, compared to societies with relatively lower levels of civicness which experience historical shocks earlier in time; and (v) that once levels of civicness in each political regime approximate "actual" levels of civicness from Putnam's study, the introduction of institutional change has no significant impact on the political culture of the South or that of the North.
- 1.4
- Our concern in this article, as purveyors of ABM, is the extent to which a particular modeling platform shapes and constrains the results we obtain, for "If we cannot determine whether or not two models produce equivalent results in equivalent conditions, we cannot reject one model in favor of another that fits data better; nor are we able to say that one model is a special case of another more general one..." (Axtell, Axelrod, Epstein, and Cohen 1996. p. 7). Applauding the growing awareness for model replication, Wilensky and Rand (2007) note that, with the exception of a few "classic" models, most are never replicated by anyone other than the original modeler, a concern reiterated by Rouchier et al. (2008, 1.1) who note that "Despite a growing interest in model-to-model analysis, there is arguably still not enough of it being done."[2]
- 1.5
- In reviewing the state of the art in model-to-model analysis, Wilensky and Rand (2007) parse the literature into "ambitious" attempts at docking (i.e. the alignment of models developed for different purposes to demonstrate their capacity to produce similar results) and replications (i.e. the re-implementation of an original model). Included in their list of docking exercises are Axtell, Axelrod, Epstein and Cohen's (1996) attempt to "dock" different simulation models, Grimm et al.'s (2005) demonstration that models constrained by dissimilar theories can generate similar patterns, Bigbee, Cioffi-Revilla, and Luke's (2005) implementation of the Epstein and Axtell Sugarscape model (1996) using MASON, as well as North and Macal's (2002) implementation of the beer game (Forrester 1961) in Mathematica, Swarm, and Repast. Among the replications, Wilensky and Rand (2007) include Cohen, Axelrod and Riolo's (1998) replication of eight "classic" ABM models, Edmonds and Hale's (2003) replication of the tag-tolerance model developed by Riolo, Cohen and Axelrod (2001), Fogel, Chellapilla, and Angeline's (1999) replication of Arthur's (1994) El Farol model, Rouchier's (2003) replication of Duffy's (2001) multi-agent model, Galan and Izquierdo's (2005) re-examination of Axelrod's (1986) model of norm formation, as well as their own (Wilensky and Rand 2007) replication of Axelrod and Hammond's (2003) ethnocentrism model. Other notable efforts at replication in the Journal of Artificial Societies and Social Simulation alone include Izquierdo, Izquierdo, and Gotts (2008) replication of Macy and Flache's (2002) work on the dynamics of reinforcement learning, Oliver Will and Rainer Hegselmann's (2008) and Will's (2009) attempts to replicate Macy and Sato's (2002) model addressing the issues of trust, cooperation and market formation, as well as Merlone, Sonnessa and Terna's (2008) use of different implementation approaches and multiple modeling implementations to highlight both the intricacies and advantages of replication.
- 1.6
- Our efforts contribute to the growing demand among modelers for standards to enhance the comparative analysis of social simulations. In an effort, then, to endorse the emerging culture of replication-whether two models can produce sufficiently similar outcomes-we replicated Bhavnani's original model (hereafter referred to as BMM for Bhavnani Model MATLAB) using an entirely different ABM toolkit, PS-I (Political Science-Identity)- geared towards the construction of identity-based models-with its own rule set governing agent-interaction and cultural change.[3] We refer to the "replication model" as PSIR (Political Science Identity Replication) and begin with a discussion of replication criteria and standards, as well as the challenges entailed in replicating models across platforms in section 2. In section 3, we extend PSIR (PSIR-L, PSIR-C) in an effort to better align it with BMM, utilizing an equal area cartogram (also known as a density-equalizing map [Gastner and Newman 2004]) to resize the territory of Italy according to 1993 population estimates. We present our results in section 4, and conclude in section 5 with a discussion of the challenges presented by model replication.[4] In many respects, our analysis lies somewhere in the grey area between replication and docking-reconstructing the results of an original model by adhering closely to its assumptions versus aligning distinct models to produce a common set of outcomes-in so far as we were unable to replicate every aspect of BMM with PSIR, this despite the latter being ostensibly well-suited for the exercise.
 BMM Replication: PSIR
Replication Criteria
- 2.1
- Wilensky and Rand (2007) note that an original model and a replicated model can differ across at least six dimensions, ordered in decreasing likelihood of the replication producing results similar to those of the original model: (i) time; (ii) hardware; (iii) languages; (iv) toolkits; (v) algorithms; and (vi) authors. We note that BMM and PSIR differ on each of these six dimensions: (i) the models were written at different points in time; (ii) implemented on different machines using different platforms or hardware (BMM on a Mac, PSIR on Windows Vista); (iii) written with different programming languages (BMM was written in MATLAB, PSIR in pseudo code that calls various functions written into the PS-I C++ source code); (iv) utilized different toolkits -BMM did not utilize a modeling toolkit per se whereas PSIR used PS-I; (v) different algorithms (given constraints on implementing
interactions between discrete pairs of agents in PS-I as opposed to interactions between
an agent and all adjacent agents); and (vi) replicated by different authors (Cartrite and Miodownik), albeit with considerable correspondence and discussion between the latter and the original model's author.
Replication Standards
- 2.2
- If "a successful replication is one in which the replicators are able to establish that the replicated model creates outputs sufficiently similar [emphasis added] to the outputs of the original model," (Wilensky and Rand 2007) then deciding upon the criterion by which "success" is gauged-the "replication standard"-is key. Axtell et al. (1996) provide a three-fold categorization of standards: (i) numerical identity or the replication of exactly the same numerical results-a high but potentially unattainable standard; (ii) distributional equivalence, or statistically significant similarity; and (iii) relational alignment, which refers to the existence of similar relationships between model parameters and outputs (e.g. the more effective the local institutional edifice the greater the level of civicness in a region). We opt for the standard of distributional equivalence in the exercise at hand, given the difficulty of achieving identical results, even with the very same model (Belding 2000). Following Axtell et al. (1996), we compare the distribution of results across a range of experimental conditions using the Mann-Whitney U goodness-of-fit measure to evaluate whether or not two sets of data (original and replication) were drawn from the same population; in other words, where differences between the data are insignificant, they cannot be said to be drawn from different populations.[5]
The Original Model (BMM)
- 2.3
- In BMM (see Table 1 for a description of the model using ODD and here for the model code), the model's landscape is partitioned into four regions that correspond to the four historical political regimes of 14th Century Italy: the ex-communal republics (North-west); the communal republics (North-east); the Papal-states (Center); and the feudal monarchy (South).[6] Institutions in each region differ in terms of their effectiveness-the extent to which they furnish their inhabitants with accurate information on the reputations of neighboring agents-and thus in the extent to which they promote interaction among agents. In the communal republics-the most civic of the four regimes-institutions provide agents with reputational information that is highly accurate. In the ex-communal republics and Papal-states, reputational information is less accurate. And finally, in the feudal monarchy-the least civic of the four regimes-reputational information is inaccurate.
Table 1: Description of BMM Using ODD (Overview, Design Concepts and Detail) Overview Purpose Operationalize the dynamics, explore and evaluate the shortcomings of Putnam's 1993 work on democracy in Italy State Variables and Scale Landscape: 40 × 40 lattice grid of 320 agents approximates the shape of Italy (excluding Sardinia) Individual agents with five attributes: a0 denotes a "tag" identifying an agent's geo-political location ([1,4]) and a1, a2, a3, a4 denote four "cultural" features ([1,9]) Institutional efficacy α=(1-ai,0 θ): the relative reliability of reputational information for each geopolitical location, with θ drawn from [0.125,0.25] Process Overview and Scheduling For each agent i at each timestep, the following sequence is executed:
Randomly select an attribute ai,k
Randomly select a neighbor j from i's Moore Neighborhood and the same regime (ai,0 = aj,0)
Select the corresponding attribute aj,k on j
Calculate interaction probability: δ = 0.1 [(1 - α) ai,k + αaj,k ]
Limit the maximum number of agent interactions to 100 per timestep
If interaction occurs, update ai,k as follows:
If ai,k(t) < aj,k(t) then ai,k(t+1) = ai,k(t) +1
If ai,k(t) > aj,k(t) then ai,k(t+1) = ai,k(t) - 1
If ai,k(t) = aj,k(t) then ai,k(t+1) = ai,k(t)Design Concepts BMM was designed to provide a causal mechanism to link the 14th Century Italian socio-political context to present day political institutional performance, and explain the emergence of a "civic" North and "uncivic" South. This linkage was suggested, but not explicitly specified, by Putnam (2003). In BMM, initial levels of agent civicness are randomly assigned, and civic and uncivic agent clusters emerge through repeated agent interaction with neighbors and updating, as a function of interpersonal trust and the institutional context in which both agent and neighbor are located. Institutions which afford a higher probability of agent interaction generate higher levels of civicness, relative to those that fail to promote trust and interaction, providing a mechanism by which the impact of 14th Century political contexts could persist to the present. Details Initialization Model duration set to 10,000 episodes θ set to .225 Initial agent civicness values randomly seeded ([1,9]) Input No additional data are input into the models once initialized Submodels Varying levels of institutional reputation (θ) to test the robustness of baseline results across settings (θ is set to .125, .175, or .25) Open Boundaries: relaxing requirement of regime-type sameness (iff ai,0 = aj,0) for agent interaction in baseline model Historical Shocks: reducing the average level of agent civicness by 30% at a specified timestep (t = 1000, 3000, 5000, or 7000) and then continuing the run to t=10000 Path Dependence: at the end of a run, levels of reputational information are inverted and the model then continues to run for an experimentally-set duration (t = 16000, 17000, 18000, or 19000) - 2.4
- Each agent represents an individual citizen of each regime, and is defined by five features a0, a1, ...a4, where a0 denotes a "tag" identifying an agent's geo-political location and a1, a2, a3, a4 denote four "cultural" features. In the communal and ex-communal republics, agent tags are set to 1 and 2, respectively. Agents in the Papal-states have tags set to 3, whereas agents in the feudal monarchy have tags set to 4. The four cultural features correspond to the four dimensions of civicness used by Putnam: engagement, political equality, trust, and membership in associations. Each of these features may assume one of nine integer values that represent an agent's level of civicness on the given feature, with "1" being the lowest possible level of civicness and "9" the highest possible level. Initial levels of agent civicness are randomly assigned to eliminate cultural bias from the model. Agents are stationary, despite historical evidence of large-scale population movements in Italy between the 14th and 20th centuries, to minimize the complexity of the model.
- 2.5
- In order to generate social capital, agents must interact with their neighbors. The frequency of agent interaction is a function of both inherited institutional structures and individual agent characteristics, and repeated agent interaction leads to the formation of either civic or uncivic communities. More formally, the model randomly selects an agent i and randomly selects a cultural feature ai,k, where k = 1, …, 4. Next, a neighbor j (from the same political regime) is randomly selected to interact with i, with the interaction depending, to a variable degree, upon the value of j 's corresponding cultural feature aj,k . The institutional efficacy within i 's home region-the reliability of reputational information-is given by α and equals 1- a i,0 θ (since i and j must be citizens of the same political regime, a i,0 = a j,0). The parameter θ is drawn from the interval [0.125, 0.25]. When θ is drawn from the low end of this interval, institutions in each of the four regimes are most effective (α equals 0.875 if i were located in the communal republics, 0.75 in the ex-communal republics, 0.625 in the Papal States and 0.5 in the feudal monarchy). In contrast, when θ is drawn from the high end of the interval, institutions in each of the four regimes are least effective ( α equals 0.75 if i were located in the communal republics, 0.5 in the ex-communal republics, 0.25 in the Papal States and 0 in the feudal monarchy).
- 2.6
- The likelihood of agent interaction is given by δ = 0.1 [(1 - α) ai,k + α aj,k ] such that i 's decision to interact with neighbor j is a convex combination of her own level of civicness and reputational information on j provided by institutions in i and j 's home region. Note that i 's initial level of civicness is randomly defined, whereas the accuracy of reputational information made available to i is a function of inherited institutional structures. Where institutions are effective (α is high), i 's decision to interact relies more heavily on reputational information about j (and only minimally on her own level of civicness). Correspondingly, where institutions are ineffective (α is low), i 's decision to interact with j relies more heavily on her own level of civicness (and only minimally on reputational information about j).
- 2.7
- If i interacts with someone who is more civic than herself, she in turn becomes more civic (if ai,k < aj,k then ai,k = ai,k + 1). If she interacts with someone who is less civic then herself, she becomes less civic (if ai,k > aj,k then a i,k = ai,k - 1). Finally, if she interacts with someone who is equally civic, interaction has no effect. Note that i 's level of civicness may only change as a result of interaction, a simplification made to ensure that cultural change is initiated voluntarily.
- 2.8
- The landscape of 320 contiguous sites is initially seeded with agents whose cultural features are randomly determined, as depicted in Figure 1. Each agent is located in one of four political regimes, which differ in terms of institutional efficacy-the transmission of reputational information. An agent's location, therefore, determines the degree to which she relies on her own levels of trust or upon reputational information in determining whether or not to interact with a potential partner. A single run of the model consists of 10,000 episodes, with each episode providing 100 opportunities for randomly selected pairs of agents to interact.
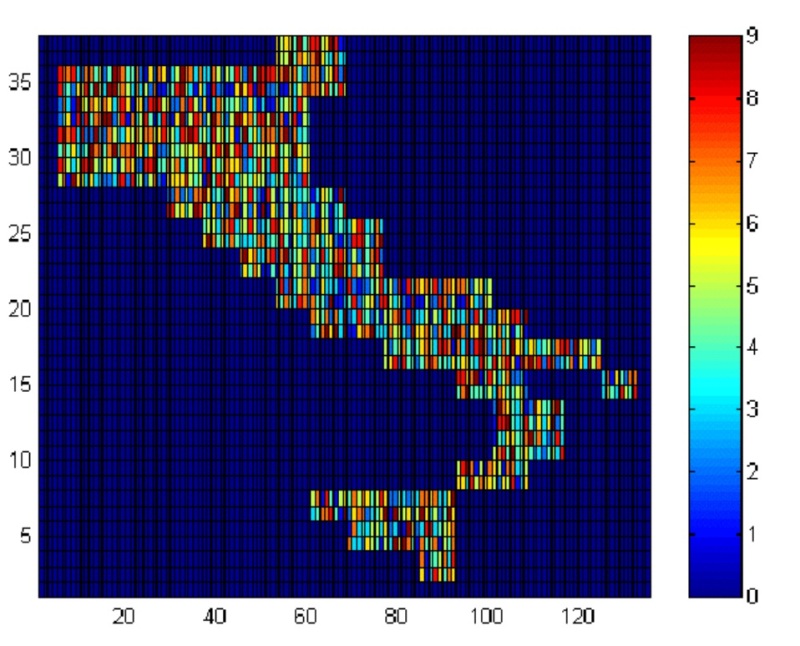
Figure 1. BMM Landscape with Randomly Seeded Cultural Features Note: The map in this figure is generated by MATLAB and displays a population of 320 agents with randomly assigned cultural features. In this figure, each cultural feature of an agent is assigned a color to denote its value, as indicated by the key to the right of the map. Four adjacent cells on the map represent one agent. Agent tags are not displayed. Each set of results from BMM is based upon averages from 10 runs of the model (with θ set equal to 0.225 unless otherwise noted).
The Replication Platform (PS-I) and Model (PSIR)
PSI
- 2.9
- PS-I is an ABM platform originally developed to operationalize, refine, and test competing versions of constructivist identity theory. Based on an earlier prototype-the ABIR (Agent-Based Identity Repertoire) model-agents with repertoires of identities interact in localities of specifiable size influenced by landscape-wide values attached to particular identities. These values change over time, thereby simulating conditions in which individuals may express latent identities or learn to use new identities in response to local pressures toward conformity and/or overall shifts in the relative attractiveness of particular identities. Large batches of controlled virtual histories may be used for comparative and statistical analysis.
- 2.10
- PS-I was designed with two imperatives in mind: ease of deployment by untrained users and systematic correspondence between the algorithms for agent behavior and theoretical approaches in political science and social psychology. Non-technical users-those with limited programming skills-can therefore use PS-I to build and execute sophisticated models with academic and policy relevance within the contours of the platform. However, this advantage of PS-I also presents a drawback, in that it places significant constraints on the development of models that push the platform's boundaries.
- 2.11
- Our choice of PS-I, a simulation package geared towards the construction of identity-based models, was motivated by the following attributes: (i) PS-I agents are defined by a repertoire of traits, each of which may vary with respect to saliency; (ii) agents compare their traits to those of others and utilize a set of algorithmic rules to update individual identity repertoires; (iii) agents can also be grouped into classes, defined by sets of attributes that delineate membership in a group.
- 2.12
- As such, the basic characteristics of PS-I-formulated to explicitly test key constructivist insights about the relevance of identity-suggested a reasonably high degree of equivalence with the basic intuition underlying BMM, so as to facilitate replication: the notion of an identity repertoire resonated with the four dimensions of social capital; the social comparison mechanism in PS-I closely approximated the one used in BMM; and agents in BMM were situated in regions, each with an inherited institutional legacy.
PSIR
- 2.13
- PS-I therefore appeared to be a particularly well-suited platform for replicating BMM, given: (i) the need to utilize a lattice-based framework in which agents interact with neighboring agents; (ii) the need for randomly seeded (initial) agent attributes; and (iii) that the replication of BMM's stylized Italy landscape would be relatively simple to implement in PS-I. On closer inspection we nonetheless realized that using the standard PS-I architecture (i.e. the GUI or a template model downloadable with the program) to design an approximation of BMM proved inadequate; replicating the underlying dynamics of BMM more accurately required changes to four principle components of PS-I:
- Agent Civicness: First, PSIR needed to assign values to the various dimensions of civicness defining an agent. In PS-I agents are defined by a repertoire of identities-one activated and the remainder latent—although these identities do not have different values (e.g. identity 5 may be more or less popular than identity 6, but each carries no intrinsic value). Agents replace/discard their activated and/or latent identities from their repertoire following a process of "social" comparison with every agent in their neighborhood. In contrast, agents in PSIR needed to keep their repertoire intact (retaining all four dimensions of civicness), altering, when eligible, only the value of one cultural feature—i.e. the level of civicness on that feature. With some fairly extensive recoding of a typical PS-I model, we successfully created agents with the attributes of BMM agents and the ability to randomize initial identity repertoires.
- Agent Interaction: The second issue concerned the number and location of interaction partners. Typically, agents in PS-I interact with all adjacent agents (agents in their Moore neighborhood), and update their identity repertoire on the basis of a neighborhood-wide comparison. In contrast, PSIR required an agent to select one neighbor from the same institutional setting for pairwise interaction, and to update civicness on the basis of the selected partner's traits. We note that, in this respect, the replication is not exact given that PSIR randomly selects one of eight adjacent neighbors. As a result, agents on the institutional perimeter will occasionally be paired with neighbors with whom they cannot ultimately interact, thereby reducing the total number of interactions and making border agents somewhat less likely to update their civicness in comparison to agents surrounded by eligible neighbors.[7]
- Agent Updating-Comparing Civicness: Third, agents in PSIR needed to compare their level of civicness on a selected feature with that of their partner. The update algorithm in PS-I is designed to allow an agent to evaluate the prevalence of each identity in its repertoire vis à vis activated identities held by agents in adjacent cells. Unlike the default comparison in PS-I, to conduct the replication we had to modify the platform to permit an agent to randomly pick a single cultural dimension and compare her level of civicness on that dimension with the corresponding level of civicness held by a randomly chosen neighbor (see above 2), updating her civicness accordingly (see above 1). As a result, we successfully replicated this aspect of BMM with PSIR.
- Agent Updating-Frequency: And fourth, we needed to address the frequency with which agents update their cultural attributes. In PS-I agents update either synchronously or asynchronously. As such, some agents update on even time steps, others update on odd time steps, and still others only once in a set number of time steps. In performing the replication, the likelihood of interaction needed to be an agent-level rather than a group-level attribute. In implementing the BMM criteria for agent interaction (given by δ), we successfully replaced the time-based update criteria in PS-I with a probabilistic agent interaction rule. However, in this process we encountered a second dimension of BMM that we were unable to replicate: limiting the number of interactions to a maximum of 100 per timestep. Given our inability to replicate the "civic change" feature of BMM, which tracks the number of times agents update a dimension of civicness, a comparison of interaction totals across BMM and PSIR was simply not possible. We surmise, however, that given the number of agents in the landscape (320), PSIR generates more updates per timestep than 100/timestep BMM ceiling.
- 2.14
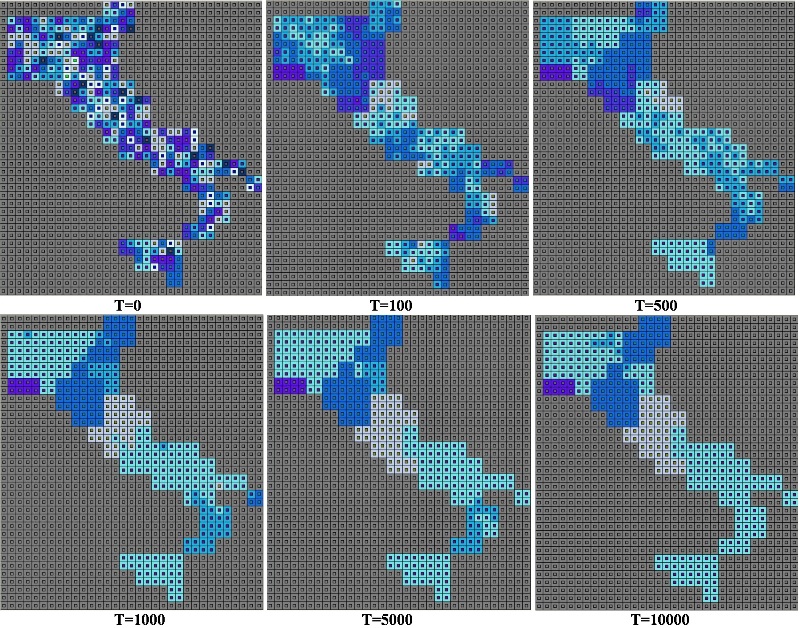
- Properties of the PS-I platform initially suggested a reasonably simple replication process with BMM-a relatively basic and uncomplicated ABM. The replication exercise, however, required nothing short of a fundamental reworking of how agents in PS-I interact. The resultant model, PSIR, arguably captures key dynamics and processes in BMM but differs from the same on two dimensions: (i) restricting the selection of an interaction partner to eligible neighbors; and (ii) limiting the number of interactions in any given timestep to 100. Snapshots from a run of the baseline PSIR model are depicted in Figure 2.
Average Civicness
PS-I Color1-3 
3-4 
4-4.5 
4.5-5 
5-5.5 
5.5-6 
6-7 
7-9 
Figure 2. PSIR Snapshots
Note: These snapshots were generated for the baseline PSIR model (θ = 0.225, closed borders). Numbers in each color-box have no substantive meaning.
BMM Extension: PSIR-L and PSIR-C
- 3.1
- As part of the exercise, we also explored the extent to which an increase in model realism affected replication "success." One attribute of the PS-I platform is the relative ease with which maps can be used to design landscapes. Our creation of a landform-based Italian landscape used a simple political map of Italy (for the year 2000) that demarcated 103 administrative regions. Using Photoshop, each region was assigned a unique color. The image size was then reduced to fit on a 100 × 100 pixel image (using the "nearest neighbor" color sampling to avoid the creation of blended colors). Using the freeware program BMP2COORD, the color and coordinates of each pixel were then generated as a text file, which was then copied and pasted into the PSIR code.[8] As a result, each colored pixel represents a single agent, with agents of the same color belonging to the same administrative region.
- 3.2
- A byproduct of this approach was the ability to recode the PSIR landscape by administrative region, rather than assigning individual agents to one of the four regime types. In addition, we included Sardinia-excluded both from Putnam's original study as well from BMM and PSIR. The resulting PSIR-L landscape has 2445 active agents, compared to 320 for BMM/PSIR. However, the use of an administrative landform map to populate the PSIR landscape immediately raised an issue: if agents represent individuals and we construct a virtual landscape of Italy based on a landform map, the resultant landscape fails to account for spatial variation in population density.
Table 2: Agents Per Administrative Region (PSIR-L, PSIR-C) PSIR-L PSIR-C Mean 28.9809 24.4532 St. Dev. 39.5988 3.9272 Range 306.8056 31.2056 Max 311.1833 47.7500 Min 4.3777 16.5444 - 3.3
- We addressed this concern by creating a cartogram based on demographic size. A freely available shape file that included census data was obtained.[9] Using GeoViz, which relies on a cartogram algorithm developed by Gastner and Newman (2004), the landscape was skewed so that the area of each of the 103 Italian administrative regions was a function of demographic size.[10] With the same process used to generate PSIR-L, we generated PSIR-C-the cartogram-based landscape-to fit on a 100 × 100 grid. The resultant landscape contains 2291 active agents.
- 3.4
- PSIR-C does not perfectly distort administrative area by demographic size, but it does represent a significant correction in the average number of agents per region, as demonstrated in Table 2, as well as correct the agent-population for specific regions, as depicted in Figure 3. For example, Roma (pop. 3.774m) consists of 39 agents (96,000 inhabitants per agent) in PSIR-L but 142 agents in PSIR-C (26,577 inhabitants per agent), Milano (pop. 3.734m) 12 (311,167 per agent) and 138 (27,058 per agent) agents respectively, and Napoli (pop. 3.061m) 12 (255,084 per agent) compared to 104 (29,433 per agent). At the other extreme, Bolzano (pop. 446k) has 67 (6,657 per agent) and 18 (24,778 per agent) agents respectively, Nuoro (pop. 273k) 59 (4627 per agent) and 11 (24,818 per agent), and Valle D'Aosta (pop. 118k) 27 (4370 per agent) and 7 (16,857 per agent) respectively. This approach, which allows for the use of data to create landscapes, was only somewhat more difficult to implement than the more conventional landform map approach (explicitly in PSIR-L and implicitly in BMM and PSIR) yet holds much potential for models developed with an eye towards verisimilitude.
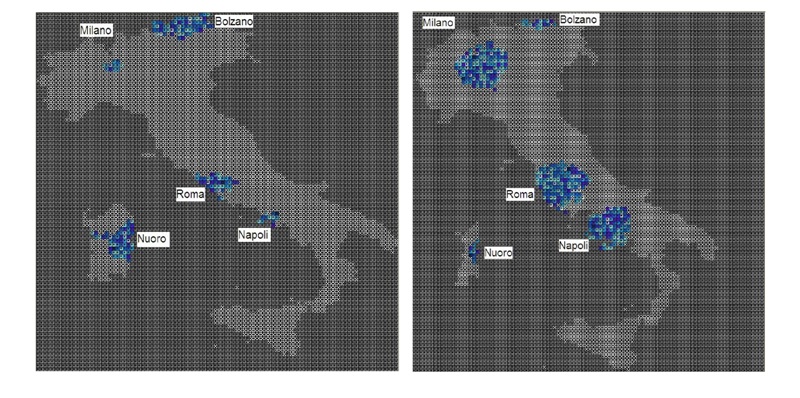
Figure 3. Population Correction for Specific Regions: PSIR-L vs. PSIR-C
Results
BMM and PSIR: Institutional Effectiveness and Aggregate Civicness
- 4.1
- As noted earlier, Axtell et al. (1996) establish a three-fold scale for evaluating the alignment of computational models: numerical identity, distributional equivalence, and relational alignment. Given that BMM and PSIR (as well as its variants, PSIR-L and PSIR-C) involve a number of stochastic elements (initial levels of civicness, neighbor and attribute selection, the probability of interaction), achieving numerical identity would have been unrealistic.[11] Rather, we aim for distributional equivalence, whereby results obtained from the original and replication model are not expected to differ statistically. This standard is more difficult to achieve than relational alignment -requiring a similar patterns of results, absent statistical significance.
- 4.2
- We begin our analysis by comparing mean levels of civicness generated by BMM and PSIR in each of the four historical regions, across four levels of institutional effectiveness, reporting statistical equivalence with a Mann-Whitney U statistic (for each data-pair).[12]
- 4.3
- As reported in Table 3, of the sixteen pairwise data comparisons, five are not significantly different, the differences between one pair are significant at the 0.05 level, while the differences between ten other pairs are significant at the 0.02 level. Average levels of civicness generated by each model across levels of institutional effectiveness suggest that the closest replication occurred under the θ = 0.175 condition, whereas the other three conditions (θ = 0.125, θ = 0.225, θ = 0.250) satisfy the standard of relational alignment, with only mixed support for distributional equivalence.
- 4.4
- More specifically, we note that the replication results diverge from those of the original model as the level of institutional efficacy decreases, albeit without a corresponding divergence as one moves from more to less civic regimes. Recall that the higher an agent's (or neighbor's) civicness score and/or the greater the level of institutional effectiveness, the greater the probability of agent interaction. On the former dimension, no clear pattern of increased interaction generating indistinguishable results emerges, whereas on the latter dimension, such a pattern does emerge.
- 4.5
- That said, and as noted above, the criteria for relational alignment is satisfied in the replication exercise conducted with PSIR. Reported means decrease as one moves across the rows in Table 3 (from left to right)-reflecting a decrease in civicness across regimes, holding institutional effectiveness constant-and as one moves from top to bottom within a column-reflecting a decrease in the institutional effectiveness of a given regime. In sum, only one row does not adhere to the expected pattern (CR under θ = 0.125 is too low), while three of the four columns have a single cell not in agreement with the expected pattern (BMM adhered to the expected pattern in all cases).
Note: Cells display mean levels of civicness from 10 runs of the model (t =10,000) for various values of α = 1- a i,0·θ. The goodness of fit statistic is the Mann-Whitney U: "not significant" suggests that the results are statistically indistinguishable (the models are equivalent). We omit from Bhavnani's (2003) results the reporting of "civic change" (the count of agent changes) given that this summary statistic was not obtainable in PSIR.Table 3: Institutional Effectiveness and Aggregate Civicness (PSIR)
Communal
Republics
Ex-
Communal
Republics
Papal
States
Feudal
Monarchy
Average
Civicnessai,0 = 1 2 3 4 θ = 0.125 BMM 6.0284 5.7750 5.5474 5.0609 5.6029 PSIR 5.1442 5.4492 5.2250 5.0943 5.2282 (p<0.02) (n.s) (p<0.05) (n.s) (p<0.02) θ = 0.175 BMM 5.8683 5.4655 4.8057 4.2887 5.1070 PSIR 5.3923 5.3717 5.0250 4.6727 5.1154 (p<0.02) (n.s) (n.s) (p<0.02) (n.s) θ = 0.225 BMM 5.8091 5.1734 4.3672 3.3728 4.6806 PSIR 5.3005 5.0609 4.9000 4.2389 4.8751 (p<0.02) (n.s) (p<0.02) (p<0.02) (p<0.05) θ = 0.250 BMM 5.7990 5.0948 4.1021 2.9072 4.4758 PSIR 5.3072 5.1682 4.9250 4.1465 4.8867 (p<0.02) (p<0.02) (p<0.02) (p<0.02) (p<0.02) - 4.6
- Thus, while the precise percentage of statistically indistinguishable data pairs required to satisfy the criteria of distributional equivalence remains subjective, the experiments reported in Table 3 provide mixed (and at times weak) support for a strict interpretation of this replication standard, albeit with stronger support for relational alignment.
BMM and PSIR Variants: Institutional Effectiveness and Aggregate Civicness
- 4.7
- In extending the replication to PSIR variants, Figure 4 plots average levels of civicness in each political regime across two independent runs of BMM, PSIR, and PSIR-L. We note that with the exception of the feudal monarchy, agents in PSIR frequently reach an "equilibrium" or steady state before the end of the model run, whereas agents in BMM and PSIR-L continue to interact with their neighbors. We attribute this effect to our inability to limit PSIR agent interactions to 100 per timestep; the higher rate of interaction enables PSIR agents to reach a steady state earlier than BMM agents, which is not the case in PSIR-L, where the large number of agents facilitates ongoing agent interaction.
Note: Cells display mean levels of civicness from 10 runs of the model (t =10,000), θ = 0.225. The goodness of fit statistic is the Mann-Whitney U: "not significant" suggests that the results are statistically indistinguishable (the models are equivalent). We omit from Bhavnani's (2003) results the reporting of "civic change" (the count of agent changes) given that this summary statistic was not obtainable in PSIR.Table 4: Institutional Effectiveness and Aggregate Civicness (PSIR, PSIR-L, PSIR-C) Communal
RepublicsEx-Communal
RepublicsPapal
StatesFeudal
MonarchyAverage
CivicnessBMM 5.8091 5.1734 4.3672 3.3728 4.6806 PSIR 5.3005 5.0609 4.9000 4.2389 4.8751 (p<0.02) (n.s) (p<0.02) (p<0.02) (p<0.05) BMM 5.8091 5.1734 4.3672 3.3728 4.6806 PSIR-L 5.3997 5.1069 4.6242 4.1481 4.8197 (p<0.02) (n.s) (n.s) (p<0.02) (n.s) BMM 5.8091 5.1734 4.3672 3.3728 4.6806 PSIR-C 5.2613 5.1229 4.3610 4.1151 4.7151 (p<0.02) (n.s) (n.s) (p<0.02) (n.s) PSIR 5.3005 5.0609 4.9000 4.2389 4.8751 PSIR-L 5.3997 5.1069 4.6242 4.1481 4.8197 (n.s) (n.s) (n.s) (n.s) (n.s) PSIR 5.3005 5.0609 4.9000 4.2389 4.8751 PSIR-C 5.2613 5.1229 4.3610 4.1151 4.7151 (n.s) (n.s) (p<0.02) (n.s) (p<0.05) PSIR-L 5.3997 5.1069 4.6242 4.1481 4.8197 PSIR-C 5.2613 5.1229 4.3610 4.1151 4.7151 (n.s) (n.s) (p<0.05) (n.s) (n.s) - 4.8
- In Table 4, we compare aggregate levels of civicness (generated by multiple model runs for the θ = 0.225 condition) across all model variants. From the perspective of relational alignment, the replication exercise is successful with a clearly identifiable trend: the stronger a region's civic legacy, the higher the level of aggregate civicness in the region. From a distributional equivalence perspective, and in contrast to our initial replication effort with PSIR, PISM-L and PSIR-C both appear to more effectively replicate BMM given that four of the eight regional comparisons yield statistically indistinguishable results, as does a comparison of aggregate civicness.
BMM, PSIR, and PSIR Variants: Political Boundaries and Aggregate Civicness
- 4.9
- A second experiment reported in Bhavnani (2003) assessed the impact of political boundaries-relaxing the assumption that agents can only interact with neighbors within the same regime type, which might reasonably be expected to have a significant impact given that 93 of the 320 agents on the BMM landscape have an adjacent neighbor in a different regime.[13] We replicate this experiment with PSIR, PSIR-L and PSIR-C and report our results in Tables 5 and 6.
Note: Cells display mean levels of civicness from 10 runs of the model (t =10,000), θ = 0.225. The goodness of fit statistic is the Mann-Whitney U: "not significant" suggests that the results are statistically indistinguishable (the models are equivalent). We omit from Bhavnani's (2003) results the reporting of "civic change" (the count of agent changes) given that this summary statistic was not obtainable in PSIR.Table 5: Political Boundaries and Aggregate Civicness (PSIR, PSIR-L, PSIR-C) Communal
RepublicsEx-Communal
RepublicsPapal
StatesFeudal
MonarchyAverage
CivicnessBMM-Close 5.8091 5.1734 4.3672 3.3728 4.6806 BMM-Open 5.3369 5.3242 4.3479 3.4736 4.6207 (p<0.02) (n.s) (n.s) (n.s) (n.s) PSIR-Close 5.3005 5.0609 4.9000 4.2389 4.8751 PSIR-Open 5.2221 5.2239 5.00313 4.2803 4.9324 (n.s) (n.s) (n.s) (n.s) (n.s) PSIR-L-Close 5.3997 5.1069 4.62421 4.1481 4.8197 PSIR-L-Open 5.2362 5.3006 4.28592 4.1366 4.7398 (n.s) (p<0.02) (p<0.05) (n.s) (n.s) PSIR-C-Close 5.2613 5.1229 4.3610 4.1151 4.7151 PSIR-C-Open 5.4169 5.4245 4.3703 4.0979 4.8274 (n.s) (p<0.02) (n.s) (n.s) (n.s) - 4.10
- In Table 5, aggregate levels of civicness for each model variant are presented for the open and closed political boundary condition. We note that opening boundaries has little effect within models, as attested by the statistically indistinguishable results of most regional pairwise comparisons (including BMM in three of four cases). As such, PSIR with open and closed boundaries yields non-distinguishable results (in all four regimes), and while both PSIR-L (two of the four regimes) and PSIR-C (three of the four regimes) generate data which occasionally differ across experimental conditions, the overall pattern (and averages across regions) suggests that boundaries make little difference to each model.
Note: Cells display mean levels of civicness from 10 runs of the model (t =10,000), θ = 0.225. The goodness of fit statistic is the Mann-Whitney U: "not significant" suggests that the results are statistically indistinguishable (the models are equivalent). We omit from Bhavnani's Bhavnani's (2003) results the reporting of "civic change" (the count of agent changes) given that this summary statistic was not obtainable in PSIR.Table 6: Open Boundaries Across Experimental Conditions (PSIR, PSIR-L, PSIR-C) Communal
RepublicsEx-Communal
RepublicsPapal
StatesFeudal
MonarchyAverage
CivicnessBMM 5.3369 5.3242 4.3479 3.4736 4.6207 PSIR 5.2221 5.2239 5.00313 4.2803 4.9324 (n.s) (n.s) (p<0.02) (p<0.02) (n.s) BMM 5.3369 5.3242 4.3479 3.4736 4.6207 PSIR-L 5.2362 5.3006 4.28592 4.1366 4.7398 (n.s) (n.s) (n.s) (p<0.02) (n.s) BMM 5.3369 5.3242 4.3479 3.4736 4.6207 PSIR-C 5.4169 5.4245 4.3703 4.0979 4.8274 (n.s) (n.s) (n.s) (p<0.02) (p<0.05) PSIR 5.2221 5.2239 5.00313 4.2803 4.9324 PSIR-L 5.2362 5.3006 4.28592 4.1366 4.7398 (n.s) (n.s) (p<0.02) (n.s) (n.s) PSIR 5.2221 5.2239 5.00313 4.2803 4.9324 PSIR-C 5.4169 5.4245 4.3703 4.0979 4.8274 (n.s) (n.s) (p<0.02) (n.s) (n.s) PSIR-L 5.2362 5.3006 4.28592 4.1366 4.7398 PSIR-C 5.4169 5.4245 4.3703 4.0979 4.8274 (n.s) (n.s) (n.s) (n.s) (n.s) 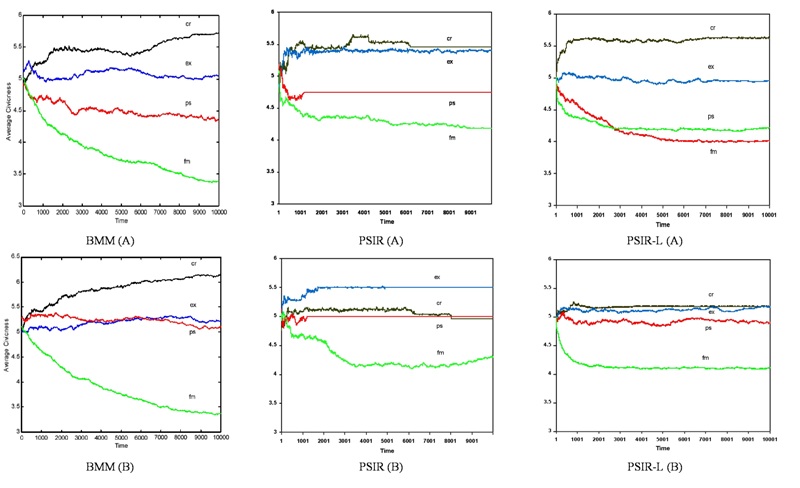
Figure 4. Evolution of Civicness by Region (PSIR, PSIR-L) - 4.11
- In Table 6, we compare the effect of open boundaries across various models. Given the absence of a significant difference between the open and the closed boundary conditions (Table 5), it is not that surprising that results of the current comparison seem to resonate with those presented above. As such, we find support for the replication exercise, in that PSIR results are indistinguishable from BMM results in two of four regimes, as are the PSIR-L and PSIR-C results in three of the four regimes. Interestingly, the difference in average civicness across regions is not statistically distinguishable in the BMM-PSIR comparison, whereas the difference is distinguishable in the BMM-PSIR-C comparison, this despite greater concurrence at the regional level, raising questions about the appropriate level of comparison in model replications.
BMM, PSIR, and PSIR Variants: Historical Shocks and Aggregate Civicness
- 4.12
- Bhavnani's third experiment assessed the effect of historical "shocks"-an immediate reduction of average civicness by 30% at a specified timestep. Specifically, one run of the BMM baseline model was executed for a shock introduced at timestep 1000, 3000, 5000, and 7000. The original experiment generated considerable rebounding in civicness after the introduction of a shock, confirming Putnam's argument of path dependence.
- 4.13
- That said, the BMM operationalization of the historical shock remains somewhat unclear, with the main text of the article stating that "The shocks I introduce reduce the average civicness of an agent by 30%…" while the note below Table 4 states that "Historical shocks that lowered the civicness of the republic's inhabitants by 30% were introduced..." As such, the original article fails to convey whether a reduction in civicness was realized by lowering each agent's civicness (and whether this was lowered equally across attributes or distributed in some other fashion) or whether aggregate civicness within a region was reduced, albeit unequally across inhabitants. These differences are not trivial.
- 4.14
- A second issue involves the impact of the shocks, as depicted in Figure 5. For the shock at timestep 1000, average civicness is reduced from about 5.25 to approximately 4.5 in BMM, but a 30% reduction should generate an average civicness of 3.675. Likewise, the shock at timestep 3000 lowered average civicness from approximately 5.4 to 4.7 but should have reduced it to 3.78 (the shock at timestep 5000 reduced civicness from 5.8 to 4.7 but should have reduced it to 4.06; the shock timestep 7000 lowered civicness from 5.9 to about 4.7 but should have reduced it to 4.13). It follows that the 30% reduction of civicness was not, in fact, implemented.
- 4.15
- Given the ambiguity in the operationalization of a 30% reduction in the original article, we opt for the most straightforward operationalization in PSIR, PSIR-L, and PSIR-C: we simply multiply each agent's individual attribute score by 0.7 at the appropriate timestep (with rounding error this generates an average level of civicness equal to 0.68 of the pre-shock value). We note that this approach imposes a ceiling of "6" for each civic attribute:
ai,k(t) = 0.7 · ai,k(t-1) (1) 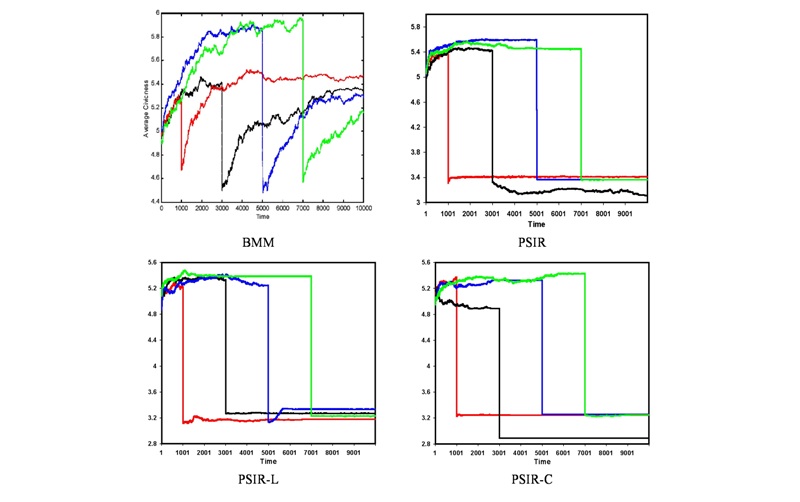
Figure 5. Evolution of Civicness with Historical Shocks (PSIR, PSIR-L, PSIR-C) - 4.16
- As depicted in Figure 5, the impact of the experimental treatment on aggregate civicness is much more dramatic in the PSIR variants relative to BMM. It is also evident that the PSIR models, unlike BMM, generally fail to rebound from the shock.
Note: The BMM data are end of run results from a single model run. The PSIR data are end of run averages with standard deviations from ten model runs in parentheses.Table 7: Historical Shocks and Aggregate Civicness Timing
of ShockCommunal
Republics
(sd)Ex-Communal
Republics
(sd)Papal
States
(sd)Feudal
Monarchy
(sd)Average
Civicness
(sd)BMM 1000 5.4760 5.1033 4.3854 3.0840 4.5122 PSIR 3.1288 (0.2530) 2.9633 (0.2779) 3.0000 (0.2887) 2.4373 (0.1386) 2.8824 (0.2396) PSIR-L 3.8703 (0.1356) 3.5895 (0.1698) 3.0838 (0.2307) 2.9308 (0.1319) 3.3686 (0.1688) PSIR-C 3.3112 (0.1349) 2.9390 (0.2247) 2.7525 (0.1869) 2.2975 (0.0756) 2.8182 (0.1555) BMM 3000 5.3413 5.3016 4.9740 3.2461 4.7158 PSIR 3.1365 (0.2146) 2.9978
(0.2016)2.8500 (0.2108) 2.5562 (0.2397) 2.8851 (0.2167) PSIR-L 3.8835 (0.1910) 3.5303 (0.1101) 3.1039 (0.2296) 2.8779 (0.1091) 3.3489 (0.1599) PSIR-C 3.2119 (0.1364) 3.0685 (0.2179) 2.6934 (0.1341) 2.3448 (0.0930) 2.8295 (0.1453) BMM 5000 5.2837 5.2935 4.8438 3.2520 4.6683 PSIR 3.1904 (0.2303) 3.0747 (0.2376) 2.9250 (0.3129) 2.4412 (0.1983) 2.9078 (0.2198) PSIR-L 3.8591 (0.2278) 3.6007 (0.1183) 3.0149 (0.2374) 2.8269 (3.3254) 3.3254 (0.1631) PSIR-C 3.2801 (0.1221) 2.9627 (0.1942) 2.6835 (0.2716) 2.3381 (0.0760) 2.8161 (0.1660) BMM 7000 5.1587 5.4429 4.7760 3.6348 4.7531 PSIR 3.2058 (0.1601) 3.0712 (0.1706) 2.8250 (0.1207) 2.4809 (0.1302) 2.8957 (0.1454) PSIR-L 3.8337 (0.1810) 3.6924 (0.1486) 3.2004 (0.2092) 2.8113 (0.0812) 3.3844 (0.1550) PSIR-C 3.2208 (0.1421) 3.1247 (0.1680) 2.6824 (0.1652) 2.3763 (0.1109) 2.8511 (0.1466) - 4.17
- Table 7 summarizes the effect of the historical shocks on the aggregate levels of civicness (in models under the θ = 0.225 condition) across the various models and regime types. From the perspective of distributional equivalence, the results suggest that all the PSIR variants fail to replicate BMM, with BMM results three or more standard deviations higher than those from PSIR. From the perspective of relational alignment, however, the models do appear similar (average civicness decreases across regime types).
- 4.18
- Based on the expectation that a different operationalization might yield a more satisfactory docking result, in PSIR-L(2) an agent's attributes are summed and then reduced as follows: [14]
(2) Thus, while each attribute was individually reduced 30% in PSIR-L, in PSIR-L(2) the reduction occurs randomly across the four attributes (constrained by a minimum attribute value of 1) until aggregate agent civicness is reduced by 30%. This allows for the possibility of high attribute values remaining in the population.
- 4.19
- As Table 8 indicates, the PSIR-L(2) averages are all quite close. In contrast to BMM, variations in the timing of the shock had only a limited effect on the end of run averages (t = 10,000). What is most clear, however, is that the results from the BMM experiment, based on a single run for each of the four shock treatments, are dramatically different from the PSIR-L and PSIR-L(2) averages.
Note: The BMM data are estimated from Figure 5, with values for relative change given in parentheses. The PSIR data are end of run averages with values for relative change and standard deviations from ten model runs in parentheses.Table 8: Historical Shocks with a Second PSIR Variant
Timing of Shock
Civicness at Shock
(sd)
Civicness after Shock (relative change)
(sd)
Civicness End of Run (relative change)
(sd)BMM 1000 5.25 4.65 (-.11) 5.4 (+.03) PSIR-L 4.9137
(0.1365)3.3288 (-.32)
(0.1048)3.3686 (-.31)
(0.1688)PSIR-L(2) 4.9043
(0.1777)3.3337 (-.32)
(0.1306)3.5426 (-.28)
(0.1353)BMM 3000 5.4 4.5 (-.17) 5.35 (-.01) PSIR-L 4.8725
(0.1458)3.3056 (-.32)
(0.1120)3.3489 (-.31)
(0.1599)PSIR-L(2) 4.8550
(0.1322)3.2927(-.32)
(0.0997)3.5134 (-.28)
(0.1157)BMM 5000 5.85 4.5 (-.23) 5.3 (-.09) PSIR-L 4.8202
(0.1777)3.2708 (-.32)
(0.1244)3.3254 (-.31)
(0.1631)PSIR-L(2) 4.8016
(0.1361)3.2529 (-.32)
(0.1004)3.4892 (-.27)
(0.1412)BMM 7000 5.95 4.55 (-.24) 5.15 (-.13) PSIR-L 4.8992
(0.1850)3.3236 (-.32)
(0.1309)3.3844 (-.31)
(0.1550)PSIR-L(2) 4.8217
(0.2027)3.2814 (-.32)
(0.1472)3.4984 (-.27)
(0.1526) - 4.20
- That the BMM models appear to sometimes meet and even exceed pre-shock levels suggests that either these model runs constitute outliers (in terms of the overall distribution of post-shock configurations) or that there are deeper issues with the operationalization of the shock than we could determine. Moreover, the PSIR models all appear to have become reasonably static fairly early while BMM continued to be dynamic, which is likely a function of the inability in PSIR to put a ceiling on agent interactions as was done in BMM. Finally, the PSIR models fail to rebound as did all BMM runs, what we attribute to differences in operationalization, the relative stability of the PSIR models quite early in the run, or the result of an interaction between these factors. Thus, while we clearly failed to achieve distributional equivalence in the historical shock experiment, the problems may very well lie with the original model and implementation rather than with our replication.
BMM, PSIR, and PSIR Variants: Path Dependence and Aggregate Civicness
- 4.21
- A fourth and final experiment reported in Bhavnani (2003) tested Putnam's claim of "path dependence." After running the model for 10,000 timesteps, levels of institutional effectiveness in each of the four regimes were inverted, with the feudal monarchy becoming the most effective and the Communal Republics becoming the least effective. This experiment was relatively simple to replicate with PSIR and its variants.
- 4.22
- Table 9 presents data on aggregate levels of civicness (in models run with the θ = 0.225 condition) for various model durations. In Bhavnani (2003), the author concluded that institutional effectiveness had only minor effect on aggregate levels of civicness in the communal and ex-communal republics, and a moderate effect in the Papal-states and feudal monarchy (comparing averages with and without the experimental treatment). Recalculating the standard deviations of Bhavnani's original study suggests that averages of the path dependence experiments were not statistically distinguishable from those generated without the experimental condition. The replication exercise generates data reflecting similar tendencies. It follows that path dependence plays a weak role in the replication and the original analysis conducted by Bhavnani (2003).
Note: The BMM data are end of run results from a single model run. The PSIR data are end of run averages with standard deviations from ten model runs in parentheses.Table 9: Path Dependence and Aggregate Civicness Number of
EpisodesCommunal
Republics
(sd)Ex-Communal
Republics
(sd)Papal
States
(sd)Feudal
Monarchy
(sd)BMM 16000 6.0962 5.3207 5.1667 3.4023 PSIR 5.2135 (0.4986) 5.2071
(0.3591)4.7750 (0.4322) 4.3646 (0.2937) PSIR-L 5.4046 (0.1578) 5.2016
(0.2390)4.8479 (0.2396) 4.1584 (0.1014) PSIR-C 5.3720 (0.2030) 5.1684
(0.2338)4.6422 (0.2888) 4.2002 (0.1325) BMM 17000 5.7163 5.0380 4.5521 3.6074 PSIR 5.1692 (0.4014) 5.1011
(0.3852)4.8500 (0.4116) 4.3287 (0.2458) PSIR-L 5.3785 (0.1451) 5.2791
(0.1888)4.6328 (0.3217) 4.1633 (0.1587) PSIR-C 5.3070 (0.1893) 5.2263
(0.2171)4.8279 (0.4020) 4.1669 (0.1321) BMM 18000 5.6827 4.7962 3.8750 3.6367 PSIR 5.1173 (0.6800) 5.2880
(0.2408)4.7500 (0.4249) 4.3316 (0.2267) PSIR-L 5.3226 (0.2567) 5.2948
(0.2645)4.8812 (0.4257) 4.2533 (0.2082) PSIR-C 5.2847 (0.2228) 5.1538
(0.2762)4.7658 (0.3749) 4.2239 (0.1399) BMM 19000 6.2260 5.2582 4.9115 3.3359 PSIR 5.3038 (0.3389) 5.2136
(0.2688)4.6750 (0.3545) 4.4523 (0.3266) PSIR-L 5.3821 (0.1836) 5.1582
(0.2164)4.6246 (0.3062) 4.2039 (0.1180) PSIR-C 5.2973 (0.1405) 5.0884
(0.3403)4.5721 (0.1191) 4.1953 (0.1379) BMM Experiment
Average5.9303 (0.2721) 5.1033
(0.2379)4.6263 (0.5608) 3.4956 (0.1490) PSIR 5.2010 (0.4797) 5.2025
(0.3135)4.7625 (0.4058) 4.3693 (0.2732) PSIR-L 5.3720 (0.1858) 5.2334
(0.2272)4.7466 (0.3233) 4.1947 (0.1466) PSIR-C 5.3153 (0.1889) 5.1592
(0.2669)4.7020 (0.2962) 4.1966 (0.1356) BMM Average w/o
Experiment5.8091 (0.2887) 5.1734
(0.2471)4.3672 (0.3970) 3.3728 (0.1851) PSIR 5.3005 (0.2573) 5.0609
(0.3834)4.9000 (0.4116) 4.2389 (0.2618) PSIR-L 5.3997 (0.1878) 5.1069
(0.1416)4.6242 (0.3299) 4.1481 (0.0441) PSIR-C 5.2613 (0.2282) 5.1229
(0.2442)4.3610 (0.2212) 4.1151 (0.1024)
Discussion
- 5.1
- The process of model replication generates two distinct payoffs. First, and as Wilensky and Rand (2007) note, a successful replication should demonstrate that the results of an original simulation are not driven by the particularities of software or hardware. And second, the process of replication should push computational modelers towards greater transparency-to more explicitly describe underlying mechanisms and, in so doing, uncover implicit assumptions that could be driving their models-effectively contributing to the development of a culture of replication.
- 5.2
- Our experience confirms the notion that perfect replication is a difficult, indeed perhaps unattainable, standard (Axtell et al. 1996). As Table 10 demonstrates, while we were able to replicate almost all aspects of BMM with PSIR and its variants, we could not: (i) restrict random neighbor selection to "eligible" neighbors; or (ii) limit updating frequency to 100 per timestep. Deviating from a strictly comparable model in terms of agent numbers and population density (PSIR-L and PSIR-C) effectively increased distributional equivalence, leading us to classify our exercise as lying somewhere in the grey area between replication and docking.
Table 10: Summary Comparison of BMM and all PSIR Variants BMM PSIR Model design variables
LandscapeSquare lattice grid; 320 active cells; Rough shape of mainland Italy. PSIR: identical to BMM
PSIR-L: Square lattice grid; 2445 active cells; “landform” map of mainland Italy and Sardinia
PSIR-C: PSIR-L map skewed to account for population density; 2291 active cellsGeo-Political Location (a0) Communal republics (north-west); ex-communal republics (north-east); Papal states (central); Feudal monarchy (south). Civic Attributes
(a1… a4)Engagement; Political Equality; Trust; Membership in Associations
Level of civicness on each feature ranges from 1 to 9.Institutional Efficacy
(1-θ)θ = 0.125, 0.175, 0.225, or 0.25 Model processes Random Neighbor Selection i selects j from Moore Neighborhood iff ai,0 = aj,0 & aj,k ≥ 1 i selects j from Moore Neighborhood
but if ai,0 ≠ aj,0 then ai,k(t+1) = ai,k(t)Attribute Selection ai,k randomly selected with equal probability Reliability of Reputational Information (α) α = 1-ai,0 θ Interaction Probability (δ) δ = 0.1 [(1 - α) ai,k+ α aj,k ] Updating Frequency Up to 100 agent updates per timestep No ceiling
Updating RuleAgent (i) randomly selects a neighbor (j) and civicness attribute (a k )
If a i,k(t) < a j,k(t) then a i,k(t+1) = a i,k(t) +1
If a i,k(t) > a j,k(t) then a i,k(t+1) = a i,k(t) - 1
If a i,k(t) = a j,k(t) then a i,k(t+1) = a i,k(t)Experimental variants Open Boundaries i selects j from Moore Neighborhood, excluding ocean i selects j from Moore Neighborhood
Historical Shocks
t = 1000, 3000, 5000, or 7000PSIR-L: ai,k(t) = 0.7 · ai,k(t-1)
PSIR-L(2):
Reductions occur randomly across all attributes per agentPath Dependence θ values inverted at t = 10,000; variants are model durations - 5.3
- To be clear, we view replication as targeted primarily towards examining the susceptibility of one's results to small, unspecified, and at times, hidden assumptions or programming errors. Given that a replication exercise aims to perfectly reproduce the operationalization of an original model, and given that the requisite information for model reimplementation is not always reported, it is difficult to determine whether discrepancies between the original and replicated model are indicative of a failed replication or the inability to fully implement primary assumptions. We view docking, on the other hand, as a more measured exercise that principally involves the alignment of admittedly dissimilar models, based on different sets of assumptions, in an effort to produce a shared set of outcomes.
- 5.4
- In key respects, then, our exercise involves a combination of the two. We attempt, where possible, to replicate, fully acknowledging that limitations-either with respect to the specification of the original model or to differences in hardware and software-make exact replication an unachievable standard. As a result, we modify the PSIR models to better align their results with BMM, while maintaining fidelity to the core BMM assumptions. Replication and docking therefore constitute components of an integrated approach toward model-to-model analysis, more usefully combined (in this case) under the rubric of model comparison, with an eye towards verification, reimplementation, and alignment (Rouchier, Cioffi-Revilla, Polhill and Takadama 2008).
- 5.5
- In closing, we note that considerable work was needed to get PSIR and its variants to behave as required-including modification to the PS-I platform itself-which suggests that there may be more to a successful model-to-model analysis than the use of apparently "well-suited" platforms. We note, further, that the inability of even well-qualified users to modify the basic operational dynamics of PS-I (either via the source code or the GUI) is something the platform's developers need to address. Other more general and flexible simulation platforms like NetLogo or RePast Symphony designed to help programmers and non-programmers alike build models may, in retrospect, have provided a more suitable starting point. The constraints imposed by PS-I nonetheless allowed us to investigate features of the original model that may, on closer inspection, have been arbitrary given the absence of specific evidence, either theoretical or empirical, to justify one representation rather over another.[15]
- 5.6
- Finally, the exercise led us back to question what an appropriate measure of "success" should be, as well as the appropriate level for comparing model-to-model results. If the field is to develop a "suite of best practices" (Jones 2000) then a clear understanding of how replication and docking exercises can be evaluated on the basis of specific criteria (i.e. on the basis of how different or similar the models in question are and on the basis of whether the intent is to capture a process, distribution of results, or some aggregate outcome) should be developed. Ideally, modelers would then keep these benchmarks in mind as they build models and execute experiments.
- 5.7
- So what do the new findings imply for Putnam's original analysis? In the absence of a clearly articulated analytic framework, judgments about how closely different models approximate Putnam's original argument are difficult, if not impractical. In redesigning models to capture Putnam's argument, however, an approach that provides a limited menu of rules for neighbor selection, updating, and scheduling would afford a more robust analysis, permitting sensitivity tests of each model mechanism utilized. Used in conjunction with mapping techniques to seed models with more historically accurate data, these refinements would improve the internal validity of the overall exercise.
Appendix
- A.1
- Agent interaction in BMM is constrained to select, with equal probability, an adjacent, non-ocean agent from the same regime type. As a result, a neighbor with whom an agent can interact is always selected. We were unable to constrain random neighbor selection in the PSIR models to eligible neighbors. Rather, a random neighbor is selected from a Moore neighborhood, with any interaction between an agent and either an ocean agent or a neighbor from a different regime having no effect. This causes agents on the geographic or administrative periphery to be more "isolated" than other agents, insofar as they have a correspondingly lower likelihood of interacting. Ceteris paribus, this reduces the overall number of agent interactions in PSIR relative to BMM. The larger number of agents in both PSIR-L and PSIR-C, however, increases the number of agents with full neighborhoods (an eligible neighbor count of 8) to 60% from 29% in PSIR. Table A1 provides a summary of eligible neighbor counts.
Table A1: Agent Interaction Number of Eligible Neighbors Number of Agents (Proportion in Landscape) BMM & PSIR PSIR-L PSIR-C 8
7
6
5
4
3
2
1
092 (.29)
27 (.08)
54 (.17)
84 (.26)
8 (.03)
55 (.18)
0
0
01440 (.59)
266 (.11)
210 (.09)
267 (.11)
153 (.06)
74 (.03)
24 (.01)
7 (.00)
4 (.00)1371 (.60)
251 (.11)
187 (.08)
237 (.10)
151 (.07)
56 (.02)
27 (.01)
6 (.00)
5 (.00) - A.2
- A second assumption in BMM is the restriction of random neighbor selection to agents of the same regime type. As depicted in Table A2, a byproduct of relaxing the closed boundary assumption is to increase the number of agents in PSIR-open models that have complete neighborhoods (an eligible neighbor count of 8). As a result, agents with full neighborhoods increase from 28% to 51% in BMM and PSIR, and from 60% in PSIM-L and PSIM-C to approximately 74%.
Table A2: Agent Interaction with Open Boundaries Number of Eligible Neighbors Number of Agents (Proportion in Landscape) BMM & PSIR PSIR-L PSIR-C 8
7
6
5
4
3
2
1
0164 (.51)
21 (.07)
42 (.13)
60 (.19)
4 (.01)
29 (.09)
0
0
01810 (.74)
179 (.07)
145 (.06)
154 (.06)
94 (.04)
41 (.02)
12 (.00)
6 (.00)
4 (.00)1686 (.74)
172 (.08)
129 (.06)
155 (.07)
94 (.04)
31 (.01)
15 (.01)
4 (.00)
5 (.00)
Notes
-
1 These regimes vary in the extent to which they promoted a civic culture. The feudal monarchy founded by Normans in the Mezzogiornio (Southern Italy) and the Papal states (Central Italy) were the least civic of the four regimes. In contrast, the ex-communal republics (North-east) and the communal republics (North-west) were the most civic.
2 Summarizing a series of three workshops held between 2003-2007, they emphasize that in spite of significant progress, several topics still require more attention and may increase the ability to use social simulations comparatively: (a) comparison, replication, reimplementation, and docking (or alignment); (b) validation; (c) taxonomy and classification; (d) multi-scale analysis, abstraction, and models of models; (e) cross-paradigm comparison; (f) reuse; (g) standards, protocols, and methodologies.
3 See Lustick (2002). Additional articles using PS-I have also been published in JASSS (e.g. Miodownik 2006).
4 We consequently follow Axtell et al. (1996), whose aims were to: (i) determine if equivalent results were produced in equivalent conditions; (ii) demonstrate the effects of relaxing some of the equivalent conditions; and (iii) be able to report problems that occurred and their resolutions, thus taking first steps in establishing the practice of equivalence testing more generally in social science computational modeling.
5 As Axtell et al. (1996) note, this approach seeks to confirm rather than reject the null hypothesis, which may serve to encourage smaller sampling in order to increase the likelihood of not rejecting the null hypothesis.
6 Note that portions of the original model description are taken from Bhavnani's (2003) article.
7 See Appendix Table A1 for further details.
8 Available at http://plutomail.huji.ac.il/~miodownik/Bmp2Coord.zip
9 Some Italian regions have been consolidated since 2000, which could have been addressed in PSIR-L by using newer administrative maps. However, the latest available shape file relied on the 103 regions and 1993 population data; for consistency, we therefore used the same administrative regions for PSIR-L.
10 For a description of GeoViz see: http://www.geovista.psu.edu/grants/cdcesda/software/. The strength of this approach is that the resulting cartogram, while skewed, retains some semblance to the original map shape as well as retaining appropriate administrative boundaries. Additional detail describing the cartogram algorithm developed by Gastner and Newman may be found at: http://www.pnas.org/content/101/20/7499.abstract.
11 Although PSIR allows for a replication of the stochastic elements associated with an experimental run, the use of identical algorithm "seeds" is not possible given that BMM and PSIR do not use exactly the same platform-independent random number generator.
12 While Bhavnani (2003) only reports mean values for ten runs but not the results of each single run, we were able to conduct the Mann Whitney test using additional data generated in the original experiments.
13 Specifically, 31/52 (60%) agents in the communal republics, 32/92 (35%) agents in the ex-communal republics, 20/48 (42%) in the Papal states, and 10/128 (8%) agents in the feudal monarchy.
14 In attempting to dock to the BMM data, we opted to modify the PSIR-L model, as this model tended to generate results closer to BMM compared to either PSIR or PSIR-C.
15 See Flache and Hegselmann (2001) for an example of how space can affect model behavior and Bigbee et al. (2005) for an analysis of how scheduling affects model outcomes.
References
-
ARTHUR, W (1994) Inductive Reasoning and Bounded Rationality. The American Economic Review 84(2): 406-411.
AXELROD, R, and Hammond, R (2003) The Evolution of Ethnocentric Behavior. Paper presented at the Midwest Political Science Convention, Chicago, IL.
AXELROD, R (1986) An Evolutionary Approach to Norms. American Political Science Review, 80 (4), pp. 1095-1111. [doi:10.2307/1960858]
BELDING, T C (2000). Numerical replication of computer simulations: Some pitfalls and how to avoid them. arXiv:nlin/0001057v1 [nlin.AO] http://arxiv.org/abs/nlin/0001057
AXTELL, R, Axelrod, R Epstein, J and Cohen, M (1996) Aligning Simulation Models: A Case Study and Results. Computational and Mathematical Organization Theory 1: 123-141. [doi:10.1007/BF01299065]
BHAVNANI, R (2003) Adaptive Agents, Political Institutions and Civic Traditions in Modern Italy. Journal of Artificial Societies and Social Simulation 6 (4) 1 https://www.jasss.org/6/4/1.html
BIGBEE, G, Cioffi-Revilla, C and Luke, S (2005) Replication of Sugarscape using MASON. Paper presented at the European Social Simulation Association, Koblenz, Germany.
COHEN, M, Axelrod, R and Riolo, R (1998) CAR Project: Replication of Eight "Social Science" Simulation Models. http://www.cscs.umich.edu/Software/CAR-replications.html.
DUFFY, J (2001) Learning to Speculate: Experiments with Artificial and Real Agents. Journal of Economic Dynamics and Control 25, pp 295-319. [doi:10.1016/S0165-1889(00)00028-2]
EDMONDS, B and Hales, D (2003) Replication, replication and replication: Some hard lessons from model alignment. Journal of Artificial Societies and Social Simulation 6 (4) 11 https://www.jasss.org/6/4/11.html
EPSTEIN, J and Axtell, R (1996) Growing Artificial Societies: Social Science from the Bottom Up. Cambridge, MA, MIT Press.
FLACHE, A and Hegselmann, R (2001) Do Irregular Grids make a Difference? Relaxing the Spatial Regularity Assumption in Cellular Models of Social Dynamics. Journal of Artificial Societies and Social Simulation 4 (4) 6 https://www.jasss.org/4/4/6.html
FOGEL, D, Chellapilla, K and Angeline, P (1999) Inductive Reasoning and Bounded Rationality Reconsidered. IEEE Transactions on Evolutionary Computation 3(2): 142-146. [doi:10.1109/4235.771167]
FORRESTER, J (1961) Industrial Dynamics. Cambridge, MA: MIT Press
GALN, J and Izquierdo, L (2005) Appearances Can Be Deceiving: Lessons Learned Re-Implementing Axelrod's 'Evolutionary Approach to Norms' Journal of Artificial Societies and Social Simulation 8 (3) 2 https://www.jasss.org/8/3/2.html.
GASTNER, M and Newman, M (2004) Diffusion-Based Method for Producing Density Equalizing Maps. Proc. Natl. Acad. Sci. USA 101:7:499-7504. [doi:10.1073/pnas.0400280101]
GRIMM, V, Revilla, E et al (2005) Pattern-Oriented Modeling of Agent-Based Complex Systems: Lessons from Ecology. Science 310: 987-991. [doi:10.1126/science.1116681]
IZQUIERDO, S, IZQUIERDO, L and GOTTS, N (2008) Reinforcement Learning Dynamics in Social Dilemmas Journal of Artificial Societies and Social Simulation 11 (2) 1 https://www.jasss.org/11/2/1.html
JONES, C (2000) Software Assessments, Benchmarks, and Best Practices. Boston, MA, Addison-Wesley Longman Publishing Co., Inc.
LEVI, M (1996) Social and Unsocial Capital: A Review Essay of Robert Putnam's Making Democracy Work. Politics and Society 24:1 (March): 45-55. [doi:10.1177/0032329296024001005]
LUSTICK, I (2002) PS-I: A User-Friendly Agent-Based Modeling Platform for Testing Theories of Political Identity and Political Stability. Journal of Artificial Societies and Social Simulation 5 (3) 7 https://www.jasss.org/5/3/7.html
MACY, M. and A. Flache. 2002. Learning Dynamics in Social Dilemmas. Proceedings of the National Academy of Sciences, 99: 7229-36. [doi:10.1073/pnas.092080099]
MACY, M. and Y. Sato. 2002. Trust, Cooperation, and Market Formation in the U.S. and Japan. Proceedings of the National Academy of Sciences, 99: 7214-20. [doi:10.1073/pnas.082097399]
MANN, H and Whitney, D (1947) On a Test of Whether One of Two Random Variables is Stochastically Larger than the Other. Annals of Mathematical Statistics 18: 50-60. [doi:10.1214/aoms/1177730491]
MERLONE, U, Sonnessa, M and Terna. P (2008) Horizontal and Vertical Multiple Implementations in a Model of Industrial Districts Journal of Artificial Societies and Social Simulation vol. 11(2) 5 https://www.jasss.org/11/2/5.html
MIODOWNIK, D (2006) Cultural Differences and Economic Incentives: an Agent-Based Study of Their Impact on the Emergence of Regional Autonomy Movements. Journal of Artificial Societies and Social Simulation 9 (4) 2 https://www.jasss.org/9/4/2.html
NORTH, M and Macal, C (2002). The Beer Dock: Three and a Half Implementations of the Beer Distribution Game. Paper presented at Swarmfest.
PUTNAM, R (1993) Making Democracy Work: Civic Traditions in Modern Italy. Princeton: Princeton University Press.
RIOLO, R, Cohen, M and Axelrod, R (2001) Evolution of Cooperation Without Reciprocity. Nature 411:441-443. [doi:10.1038/35106555]
ROUCHIER, J (2003). Re-implementation of a multi-agent model aimed at sustaining experimental economic research: The case of simulations with emerging speculation. Journal of Artificial Societies and Social Simulation 6 (4) 7 https://www.jasss.org/6/4/7.html
ROUCHIER, J, Cioffi-Revilla, C Polhill, J and Takadama, K (2008) Progress in Model-To-Model Analysis. Journal of Artificial Societies and Social Simulation 11(2) 8 https://www.jasss.org/11/2/8.html.
WILL, O (2009) Resolving a Replication That Failed: News on the Macy & Sato Model. Journal of Artificial Societies and Social Simulation 12 (4) 11 https://www.jasss.org/12/4/11.html
WILL, O and Hegselmann, R (2008) A Replication That Failed: On the Computational Model in 'Michael W. Macy and Yoshimichi Sato: Trust, Cooperation and Market Formation in the U.S. and Japan. Proceedings of the National Academy of Sciences, May 2002.' Journal of Artificial Societies and Social Simulation 11 (3) 3 https://www.jasss.org/11/3/3.html
WILENSKY, U and Rand, W (2007) Making Models Match: Replicating an Agent-Based Model." Journal of Artificial Societies and Social Simulation 10 (4) 2 https://www.jasss.org/10/4/2.html