
Introduction
Blockchain can be defined as a distributed shared database generated based on cryptography technology. It maintains a reliable database in a decentralized way: a large number of participators commute through a peer-to-peer (P2P) network, and the data they generated is digitally signed using cryptography protocols. More importantly, such data will be packed as a block, and appended to a chain of blocks, i.e., the blockchain. Hence, the blockchain can be viewed a large public ledger maintained collectively on the P2P network based on consensus protocol (Antonopoulos 2014).
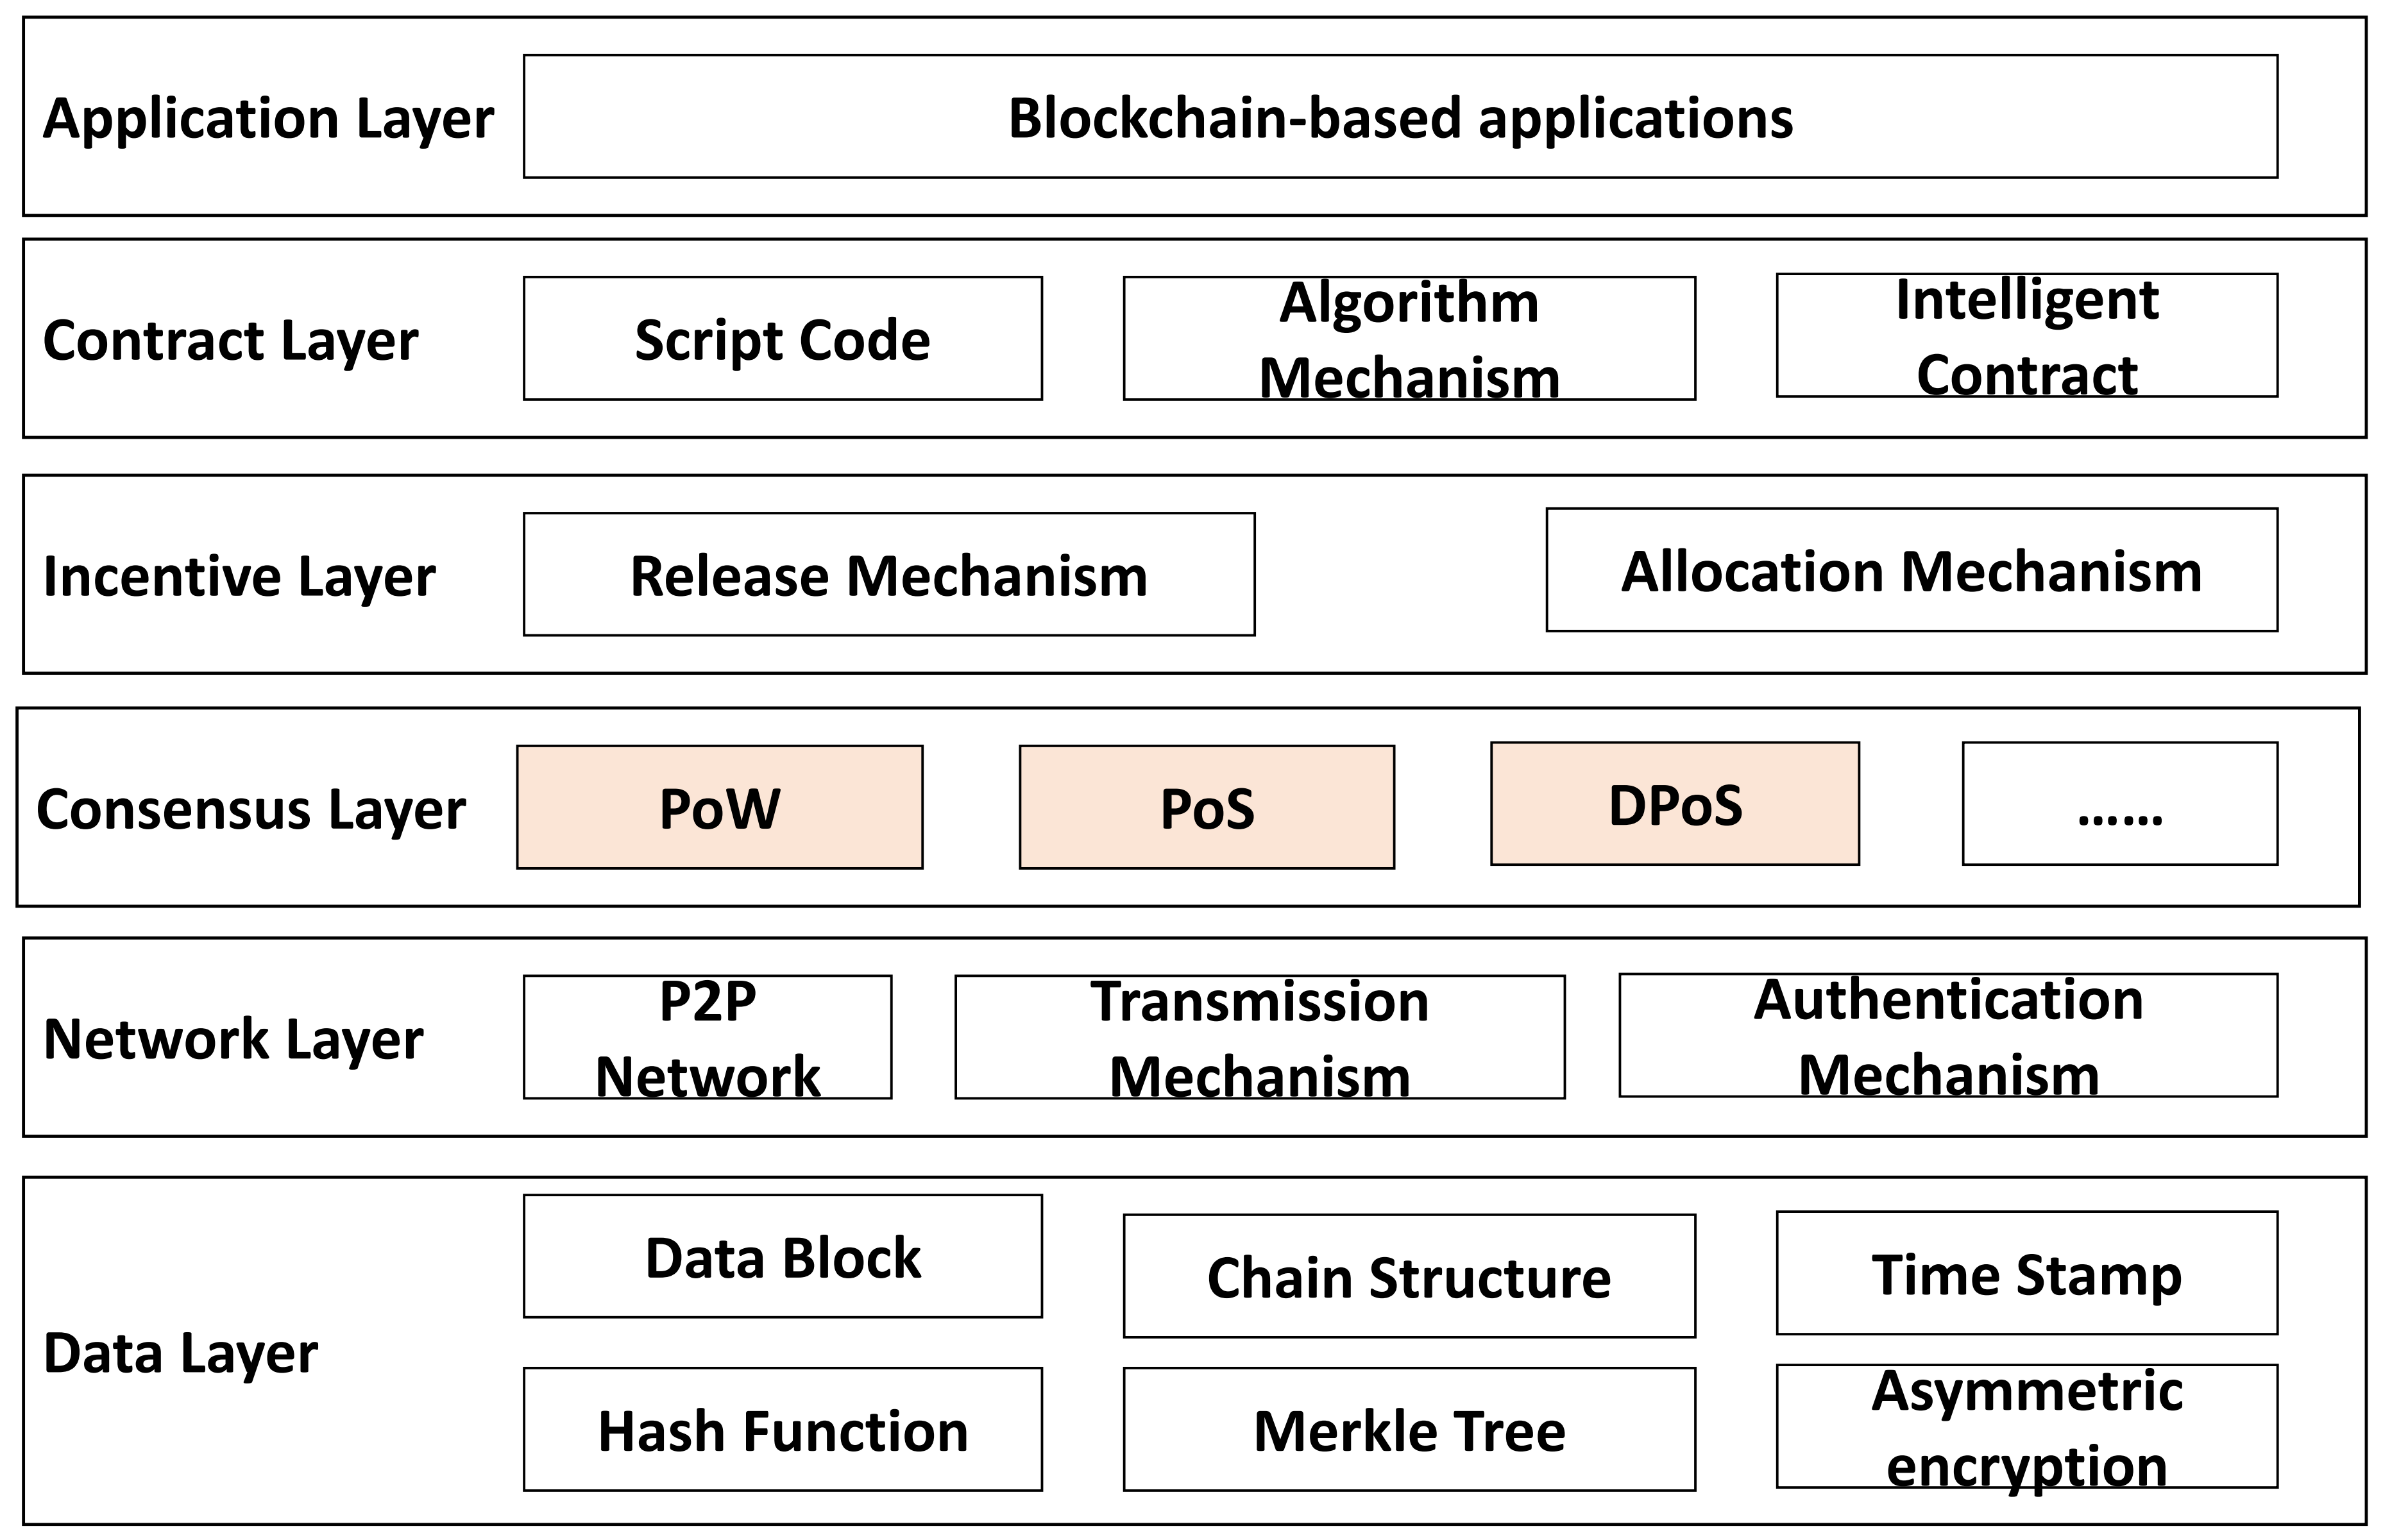
The technical architecture of blockchain can be divided into six layers (Yuan & Wang 2016), as demonstrated in Figure 1. The consensus layer is a very unique and fundamental part of the blockchain system, because many consensus protocol have been developed to ensure the sustainability of the system (Du et al. 2017). Another interesting feature of blockchain system is the trade network among autonomous traders, which is different from the P2P network of hardware devices. Unlike the stock market, traders in the blockchain system have no central counter party which provides clearing and settlement services (Nakamoto 2008). Instead, they have to trade with the neighbors in the trade network. Therefore, we are interested in how different consensus protocols and trade network topologies affect the performance of a blockchain system, which has not been studied in the literature yet.
In this paper, we propose an agent-based model to simulate a blockchain system with different consensus protocols and trade network topologies. In particular, we investigated three consensus protocols introduced later in Section Preliminaries and Model Assumptions, namely proof-of-work (PoW), proof-of-stake (PoS), and delegated proof-of-stake (DPoS). We also studied three common trade network topologies: random, small-world, and scale-free. The performance of a blockchain is measured by three indicators explained in Section Numerical Simulation: coin price index, request-satisfied ratio, Gini index of all participators. The later two indicators quantify the trade efficiency of the system and wealth inequality among agents, respectively.
The contribution of this paper is three-folder. Firstly, it is one of the first attempts to simulate blockchain system using agent-based modeling and simulation (ABMS) technique. Secondly, the consensus protocols and trade network topologies have been well-modeled and comprehensively studied in the context of blockchain system. Thirdly, the results we obtained from computational experiments reveal that the system performance is affected by consensus protocols and trade network topologies. In particular, when designing a sustainable blockchain system, it is crucial to increase the connectivity among participants for obtaining higher trade efficiency and lowering wealth inequality, by means of not only using better consensus protocols such as PoS or DPoS, but also incentivizing apathetic or newly-joined participants to link with others. We suggest that our findings could be useful to the designers, practitioner and researchers of blockchain system and token economy.
The rest of the paper is organized as follows. In Section Literature Review we survey related research streams, followed by the section of preliminaries and assumptions. We describe the model in detail in Section Model Description, and design the simulation experiments in Section Numerical Simulation. Next, we present the experimental results and discuss our research findings in Section Results and Discussion. Finally, we conclude the paper and suggest potential topics for future research in Section Conclusion.
Literature Review
Consensus protocol
Since blockchain is a distributed computing system, it is essential to tackle the Byzantine generals problem named by Lamport et al. (1982). This problem requires that participators must agree on a concerted strategy to avoid catastrophic system failure, but some of the participators are unreliable. Lamport et al. (1982) discussed several solutions assuming a loyal general as the Commander. Later, Lamport (1998, 2001) proposed the Paxos algorithm in which there are many roles such as client, voter, proposer, learner and leader. A well-known implementation of Paxos is the Raft algorithm (Ongaro & Ousterhout 2014). Since Castro & Liskov (1999) proposed the practical Byzantine fault tolerance (PBFT) algorithm with significantly-improved performance, many variants were developed, such as HQ (Cowling et al. 2006), MinBFT (Veronese et al. 2011), and RBFT (Aublin et al. 2013).
The first blockchain-based consensus protocol has been proposed by Nakamoto (2008), who called it “Proof of Work” (PoW) protocol. Using the hash function, it is very difficult to find the right input so that a certain number of characters in the hash output string are all zeros. The general who finds the right input first is able to create a block, and other generals will verify the hash string and accept the block. As the blockchain grows, unreliable participators can barely attack the system unless their computation power is greater than 51%. Although PoW has been successfully applied in the BitCoin system, vast energies are wasted because participators have to increase their computation power to win the competition of solving cryptographic puzzles. Therefore, many other blockchain consensus protocols have been proposed. For example, King & Nadal (2012) introduced the proof-of-stake (PoS) protocol and it was applied to the PPCoin system. It was improved by Ethereum, a blockchain-based distributed computing platform, as the Casper Protocol, i.e., security-deposit based economic consensus protocol (Buterin & Griffith 2017). Larimer (2014) created the delegated proof-of-stake (DPoS) protocol, which was employed by Steemit, a well-known blockchain-based social media platform (Li & Palanisamy 2019). Other blockchain-based consensus protocols include proof of retrievability (Juels & Kaliski Jr 2007), proof of space (Dziembowski et al. 2015), etc. For recent surveys of consensus protocols, we refer the reader to Du et al. (2017) and Wang et al. (2018). To the best of our knowledge, however, how to quantify the system-wide impact of a blockchain-based consensus protocol remains unexplored.
Agent-based model
An agent-based model (ABM) is a class of computational models for simulating the actions and interactions of autonomous agents (both individual or collective entities such as organizations or groups) with a view to assessing their effects on the system as a whole (Macal & North 2009). Based on the complex adaptive systems theory (Holland 1996), agent-based models have been widely used in many fields, such as supply chains (Lin & Lin 2006), online-to-offline food ordering and delivery markets (He et al. 2019a), waste treatment systems (He et al. 2017), housing market (Schelling 1978; He et al. 2018), financial systems (Hoffmann et al. 2007; Oldham 2017), and economic systems (Farmer & Foley 2009).
Recently, agent-based models have been developed to study blockchain systems. Currently, there are three studies most relevant to our work. Cocco & Marchesi (2016) created an ABM to simulate the economy of the Bitcoin mining process, and successfully reproduced the unit root property, the fat tail phenomenon and the volatility clustering of Bitcoin price series. Kaligotla & Macal (2018) proposed a generalized agent-based conceptual framework of a blockchain system, in which essential elements (such as market agent, miner agent, transactions, public ledger) were well defined and modeled. They also investigated how the strategy scenario in which agents choose verification blocks affect energy efficiency of blockchain system. The other similar agent-based blockchain model was proposed by Lee et al. (2018), which integrated inverse reinforcement learning to generate the behavioral rules of traders in blockchain system. Based on the bitcoin transactions data, the bitcoin demand and supply protocols were simulated in the model, so that the movement of bitcoin price can be emerged from agent interactions. Although these two insightful studies have enriched our understanding of the blockchain system, they did not consider the impact of consensus protocols and trade network topologies on blockchain system performance.
Summary
Motivated by above findings, we studied the research problem proposed in Section Introduction using the ABMS technique, because each participator in the blockchain system is an autonomous decision-maker interacting with his/her network neighbors, the dynamic of which can barely be modeled by other approaches such as mathematical models.
Preliminaries and Model Assumptions
Consensus protocol
Consensus protocol is an important component of a blockchain system. The goal of developing and applying consensus protocol is to make all honest nodes maintain a public distributed blockchain, while satisfying two properties: 1) Consistency. All honest nodes hold exactly the same blockchain. 2) Effectiveness. Information published by one honest node is eventually recorded by all other honesty nodes in their own blockchains. Currently, there are three popular consensus protocols, and the key difference among them is the way to select a participator (i.e., a miner) for creating a new block. Usually, the selected miner will be rewarded with a certain number of new coins, so that miners are willing to verify transactions and to maintain the sustainability of the blockchain system.
PoW (proof-of-work) is the first consensus protocol as it was used in the BitCoin system (Nakamoto 2008). The basic idea of PoW is to ensure data consistency and consensus security by repeatedly running a competition of solving cryptographic puzzles. In particular, miners compete with each other based on their computing power in order to be the first one who finds the right number that makes the hash value of the block head less than or equal to the difficulty target (Antonopoulos 2014). The miner fastest in solving puzzles will be rewarded by the system with a certain number of coins, and a new block is created by this miner. Many miners decided to purchase high-performance computation devices (i.e., mining rigs) to enhance their computation power, so that the probability of being rewarded will be enlarged. Hence, we propose an assumption for modeling the PoW consensus protocol:
PoS (proof-of-stake) developed a different approach to miner selection (Wang et al. 2018). A concept, stake, was introduced. In some blockchain system, a miner’s stake is measured by his/her coin age, which is the product of the number of coins multiplied by the number of days the coins have been held by the miner:
| $$stake = (\#~coins) \times (\#~days~the~coins~have~been~held).$$ | (1) |
DPoS (delegated proof-of-stake) blockchain system is similar to a joint-stock company, in which active delegates are voted into their roles by token holders (Bach et al. 2018). Usually, the delegates are chosen with the best interest of the network at heart as they keep the blockchain system running smoothly and safely. To encourage voting, a miner may need to show he/she owns considerable coins, so that his/her trade partners are willing to vote. If a rich miner also has many traders (i.e., large degree in the trade network), he/she is likely to be elected. Hence, we propose an assumption for modeling the DPoS consensus protocol:
Trade network topology
Although many blockchains are public, we cannot identify the network topology of traders because typical users have multiple coin accounts and the transactions are anonymous (Antonopoulos & Wood 2018). Therefore, we have to assume that the type of trade network topology could be one of three common network topologies: random, small-world, or scale-free.
We suggest that the trade network could be a random network, which is often introduced in many studies as a benchmark case (see, e.g., Huang et al. 2005). In a random network, every possible trade connection between two users occurs independently with a fixed probability. Hence, we propose an assumption for modeling the trade network in blockchain system:
Small-world networks have short average distance between two nodes. The distance is defined as the number of edges in a shortest path connecting them. We suggest that the trade network in blockchain system could be a small-world network because many empirical graphs show the small-world effect (i.e., short chain of acquaintances), including social networks (Zeppini & Frenken 2018). Hence, we propose an assumption for modeling the trade network in blockchain system:
Scale-free networks are often created in a way of preferential attachment: new users prefer to make a trade connection to the more popular existing users. Consequently, the more connected a node is, the more likely it is to receive new links. Under this mechanism, the degree distribution of scale-free networks follows a power law, which means that very few nodes have lots of connections while the vast majority of nodes are those with small degree (Ohdaira & Terano 2011). Hence, we propose an assumption for modeling the trade network in blockchain system:
Model Description
Notation
In this study, we proposed an agent-based model to simulate a blockchain system in which digital coins are traded by agents as currency. Our model consists of multiple trader agents, miner agents, and one system agent. Table 1 summarizes agent-related variables used in our model, where initial values of many exogenous variables are determined arbitrarily.
| Agent | Variable | Typea | Remark | Value assignment |
| System | \(N_n\) | XV | Number of noisy traders | 200 |
| \(N_h\) | XV | Number of herd traders | 200 | |
| \(N_g\) | XV | Number of game traders | 200 | |
| \(\mathcal{T}\) | XV | Set of all traders | ||
| \(M_n\) | XV | Number of noisy miners | 100 | |
| \(M_h\) | XV | Number of herd miners | 100 | |
| \(M_g\) | XV | Number of game miners | 100 | |
| \(\mathcal{M}\) | XV | Set of all miners | NULL | |
| \(\alpha\) | XV | Price sensitivity to the exceed demand | 4000 | |
| \(\beta\) | XV | Price sensitivity to the new coins | 10 | |
| \(\gamma\) | XV | The weight parameter of miner’s stake | 0.5 | |
| \(W_t\) | XV | New coins added to miners at time \(t\) | 10 | |
| \(\theta_t\) | XV | Maximum number of transactions in a block at time \(t\) | 10 | |
| \(P_t\) | NV | Coin price index at time \(t\) | \(P_0 = 100\) | |
| \(\varDelta_t\) | NV | Change of coin price index at time \(t\) | Equation 6 | |
| \(B_t\) | NV | Total demand of coin at time \(t\) | Equation 17 | |
| \(S_t\) | NV | Total supply of coin at time \(t\) | Equation 18 | |
| \(X_t\) | NV | Number of total transactions at time \(t\) | ||
| \(G_t\) | NV | Gini index of system at time \(t\) | ||
| \(R_t\) | NV | Average ratio of satisfied coin request at time \(t\) | ||
| Trader \(i\) | \(Q_{i}\) | XV | Trader \(i\)’s maximum percentage of tradable coins | 0.5 |
| \(\lambda_{i}\) | XV | Trader \(i\)’s sensitivity to price index change | 0.05 | |
| \(\mathcal{H}_{i}\) | XV | Set of trader \(i\)’s neighbors in trade network | ||
| \(\deg_{i}\) | XV | Degree of trader \(i\) | Equation 10 | |
| \(m_i\) | XV | Number of previous minor decisions of trader \(i\) | 2 | |
| \(L_i\) | XV | Number of considering policies of trader \(i\) | 100 | |
| \(A_{i, t}\) | NV | Trader \(i\)’s cash balance at time \(t\) | \(A_{i, 0} = 10000\) | |
| \(C_{i, t}\) | NV | Trader \(i\)’s coin balance at time \(t\) | \(C_{i, 0} = 100\) | |
| \(Pr^B_{i, t}, Pr^S_{i, t}, Pr^H_{i, t}\) | NV | The probabilities of trader \(i\)’s decisions at time \(t\) | ||
| \(q_{i, t}\) | NV | Trader \(i\)’s coin trade request at time \(t\) | Equation 9 | |
| \(r_{i, t}\) | NV | The percentage of satisfied coin request of trader \(i\) at time \(t\) | Equation 11 | |
| Miner \(j\) | \(U_{j}\) | XV | Computation power of miner \(j\) | \(U(10, 110)\) |
| \(K_{j, t}\) | NV | Stake of miner \(j\) at time \(t\) | Equation 14 | |
| \(V_{j, t}\) | NV | Stake-degree value of miner \(j\) at time \(t\) | Equation 16 |
In the following we explain the behavior of each agent type in a static time step \(t\).
Trader’s behavior
Each trader agent (e.g., \(i\)) is initialized with two accounts (time step index \(t=0\)): a cash account with balance 10000 (denoted by \(A_{i, 0} = 10000\)) and a coin account with balance 100 (\(C_{i, 0} = 100\)). At time \(t\), each trader agent has to make his/her trade decision: to buy, sell or hold coins. In our model, the probabilities that trader \(i\) at time \(t\) decides to buy, to sell or to hold coins are denoted by \(Pr^B_{i, t}, Pr^S_{i, t}, Pr^H_{i, t}\), respectively. Note that the sum of these three probabilities is always 1.
Making trade decision
Similar to the classification of stock traders in the study by Liu & Serguieva (2018), there are three groups of traders in our model: noisy traders, herd traders, and game traders. Since it is difficult to obtain the empirical percentages of traders and miners in blockchain systems, we simply let three groups have same traders and miners, i.e., \(N_n=N_h=N_g=200\) and \(M_n=M_h=M_g=100\) as displayed in Table 1 .
Noisy traders. The noisy traders make random decision on buying/selling/holding coins. Such agents represent the traders who use the blockchain system for payment, instead of investment. Therefore, their trade decisions are independent of coin price changes. Following Cocco & Marchesi (2016) who suggest that “buy and sell orders are always issued with the same probability (by random traders)”, the decision probabilities of noisy trader \(i\) at time \(t\) are:
| $$Pr^B_{i, t} = 0.33,$$ | (2) |
| $$Pr^S_{i, t} = 0.33$$ | (3) |
| $$Pr^H_{i, t} = 0.34.$$ | (4) |
Herd traders. Herd traders are very sensitive to the fluctuation of coin price index (denoted by \(P_t\), because such agents represent the coin investors. Following Liu & Serguieva (2018), the probability that a herd trader \(i\) will hold his/her coins at time \(t\) is computed as follows:
| $$Pr^H_{i, t} = \frac{1}{1+\lambda_{i} |\varDelta_t|}$$ | (5) |
| $$\varDelta_t = P_t - P_{t-1}.$$ | (6) |
| $$Pr^B_{i, t} = (1-Pr^H_{i, t}) \frac{e^{\varDelta_t}}{e^{\varDelta_t} + e^{-\varDelta_t}}.$$ | (7) |
| $$\Pr^S_{i, t} = 1 - Pr^H_{i, t} - Pr^B_{i, t}.$$ | (8) |
Game traders. In financial markets, there are always a minority of traders who try to outwit others (Tanaka-Yamawaki & Tokuoka 2006). They buy coins while others are selling and sell coins while others are buying, for the purpose of chasing larger profits than behaving as herd traders. Therefore, game traders make decision based on the previous minor decisions released by the system agent.
To model the decision-making process of game traders, we assume that game trade \(i\) only considers previous \(m_i=2\) steps following Liu & Serguieva (2018). Since there are three possible decisions (Buy, Sell, Hold), the number of possible two-stage minor decisions is \(3^2 = 9\), as listed in the first column of Table 2 . The number of policies to deal with all possible scenarios is \(3^9\) = 19,683. For example, the first policy can be all “B”, which means that no matter what the minor decisions in previous two time steps are, the game trader using Policy 1st will buy coins at current time step. If Policy 2nd is applied, the game trade will sell coins only if the previous minor decisions are “HH”.
In our model, each game trade is initialized with \(L_i = 100\) randomly-selected policies as his/her policy pool because it is infeasible for a trader to examine all 19,683 policies. Besides, a fitness is associate with each selected policy to indicate policy value. Similar to the selection mechanism of genetic algorithm, the game trade in each time step will select and apply a policy selected from the pool according its fitness. At time \(t+1\), the fitness of some policies will be increased if the decision given by these policies is the minor decision at time \(t\), and will be decreased if not. By doing so, the game traders are “smarter” than other traders since the policies are applied dynamically and the trade decisions are made adaptively.
| Possible two-stage minor decisions | Policy 1st | Policy 2nd | . . . | Policy 39-th |
| BB | B | B | . . . | H |
| BS | B | B | . . . | H |
| BH | B | B | . . . | H |
| SB | B | B | . . . | H |
| SS | B | B | . . . | H |
| SH | B | B | . . . | H |
| HB | B | B | . . . | H |
| HS | B | B | . . . | H |
| HH | B | S | . . . | H |
Computing coin trade request
Once trader \(i\) has decided to buy, to sell or to hold coins, his/her coin trade request at time t is expressed as follows:
| $$q_{i, t} = \begin{cases} 0, & \text{if hold};\\ Q_i A_{i, t}/P_{i, t}, & \text{if buy};\\ -Q_i C_{i, t}, & \text{otherwise}.\end{cases}$$ | (9) |
Trading with available neighbors
Due to the absence of central counter party in the blockchain system, trader \(i\) has to trade with neighbors in his/her trade network. Each trader agent (e.g., \(i\)) has a set of neighbors denoted by \(\mathcal{H}_{i}\), the number of which is the degree of trader \(i\), i.e.,
| $$\deg_{i} = |\mathcal{H}_{i}|.$$ | (10) |
Because of agent heterogeneity and different trade decisions, trader \(i\)’s coin request could not be satisfied. For example, a coin buyer seeks coin sellers from neighbors. He/She will continue seeking until his/her coin request has been fulfilled, or there is no more available seller in neighbors. If all the neighbors are also coin buyers, then trader \(i\)’s satisfied ratio (denoted by \(r_{i, t}\)) is 0. Formally, the trader \(i\)’s satisfied ratio is computed as follows:
| $$\displaystyle r_{i, t} = \dfrac{ \min\big\{|q_{i, t}|, \sum_{j\in \mathcal{H}_{i}} |q_{j, t}| {1}(-q_{i, t} q_{j, t}) \big\}}{|q_{i, t}|} ,$$ | (11) |
Miner’s behavior
The miner agents are special traders. Hence, miners are also divided into three groups: noisy, herd, and game miners. They have the same endowment (initial cash, coins, neighbors) with traders, same trade behaviors, e.g., making trade decision, computing coin trade request, and trading with available neighbors.
However, miners have additional attributes (e.g., computation power, stake) because some of them will be selected by the system agent to create blocks and get a certain number of coins as reward. Let \(Pr(j)\) denote the probability that miner \(j\) will be selected, Assumption H1 can be expressed as follows:
| $$\displaystyle Pr(j) = \dfrac{e^{U_{j}} }{\sum_{l\in \mathcal{M}} e^{U_{l}} },$$ | (12) |
Similarly, Assumption H2 can be expressed as follows:
| $$\displaystyle Pr(j) = \dfrac{e^{K_{j}} }{\sum_{l\in \mathcal{M}} e^{K_{l}} },$$ | (13) |
| $$\displaystyle K_{j, t+1} = K_{j, t} + C_{j, t}.$$ | (14) |
Finally, Assumption H3 can be expressed as follows:
| $$\displaystyle Pr(j) = \dfrac{e^{V_{j}} }{\sum_{l\in \mathcal{M}} e^{V_{l}} },$$ | (15) |
| $$V_{j, t} = \gamma \times \dfrac{K_{j, t}}{\max\{K_{l, t}\}_{l \in \mathcal{M}}} + (1-\gamma) \times \dfrac{\deg_{j, t}}{\max\{\deg_{l, t}\}_{l \in \mathcal{M}}},$$ | (16) |
System’s behavior
The system agent in our model performs many important tasks. First, it creates trader and miner agents and initializes their exogenous variables. Second, if the model meets the stop criterion, the simulation will be terminated and all important data will be saved for further analysis. Third, in each time step, the system agent needs to collect coin supply-demand information, such as the minor trade decision of agents for game traders, the number of total transactions \(X_t\), and the total request of buying coins \(B_t\):
| $$\displaystyle B_t = \sum_{i \in \mathcal{T} \cup \mathcal{M} } q_{i, t} {1}(q_{i, t}),$$ | (17) |
| $$\displaystyle S_t = \sum_{i \in \mathcal{T} \cup \mathcal{M} } -q_{i, t} {1}(-q_{i, t}).$$ | (18) |
Following the popular price update rule by LeBaron (2006) who suggested that the price of an artificial financial market is anchored to the previous price and price change is a proportion of demand/supply excess, the coin price index can be updated as follows:
| $$\displaystyle P_{t+1} = P_{t} + \dfrac{B_t-S_t}{\alpha} - \dfrac{W_t}{\beta},$$ | (19) |
Summary
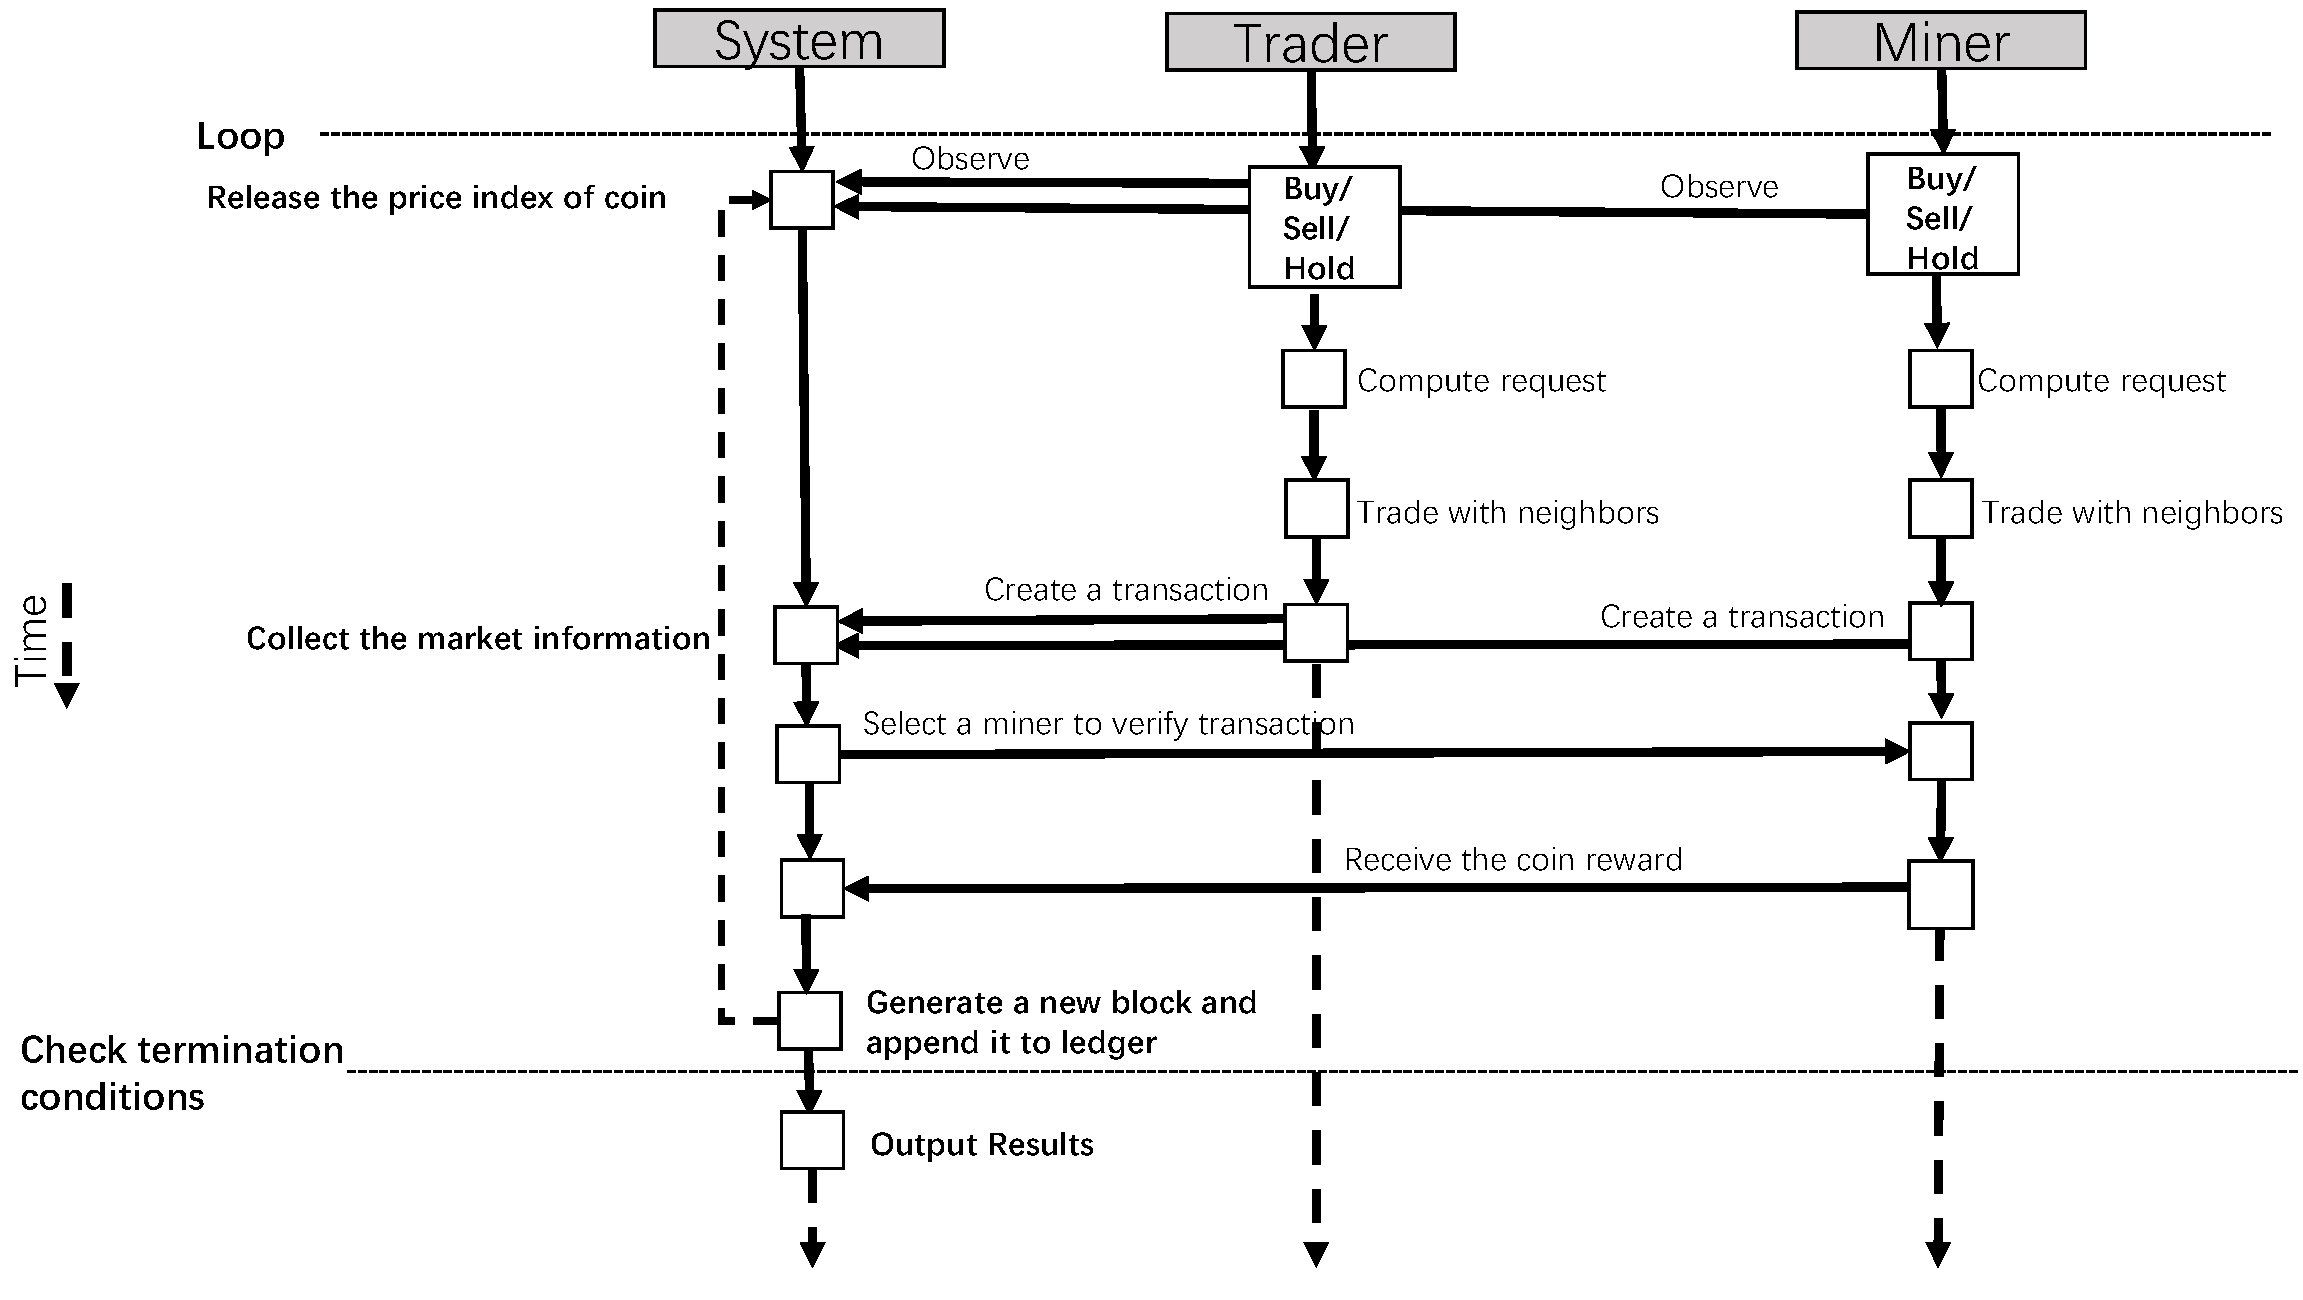
Before we start the simulation experiments, the agents’ behavior should be scheduled in a time step for implementation in the computer simulation programs. Figure 2 summarizes the sequence of events in our model in the form of a unified modeling language behavior diagram, in which parallel vertical lines indicate different processes or objects that live simultaneously, and horizontal arrows represent messages exchanged between them in the order in which they occur. All the components in Figure 2 have been discussed above.
Numerical Simulation
We first conduct nine experiments – (H1, H2, H3) \(\otimes\) (H4, H5, H6) – with different consensus protocols and trade network topologies. Only three trade networks are generated, the node degree distributions of which are presented in Figure 3. We develop the model using Python, and perform each experiment 100 times to ensure robust outputs against randomness in initializing the computation power, miner selection, policy selection, and so on. All the 100 independent tests of each experiment can be well compared and reproduced by assigning \(\{0, 1, 2, ..., 99\}\) as random seeds, which means that the differences among experiments almost only depend on the configuration of its consensus protocol and trade network topology.
| Trade network topology | Max degree | Min degree | Avg. degree | Median degree |
| Random | 21 | 1 | 10.09 | 10 |
| Small-world | 17 | 6 | 10.09 | 10 |
| Scale-free | 656 | 1 | 4.27 | 2 |
The events presented in Figure 2 were carried out 1000 times for each test, i.e., each simulation stops at \(t=1000\). Therefore, the total computation load is: 9 experiments \(\times\) 100 tests with different random seeds 1000 time steps. During simulation, we collect necessary data to evaluate the performance of a blockchain, which is measured by three indicators:
- Price index of coin \(P_t\), as updated by Equation 19.
- Request-satisfied ratio \(R_t\) is the division of total satisfied coin requests by total coin requests. The larger the \(R_t\) is, the higher the trade efficiency of blockchain system is.
- Gini index of all traders and miners, denoted by \(G_t \in [0, 1]\), measures the degree of wealth inequality among agents. In our model, an agent’s wealth is the sum of his/her cash balance and coin value (i.e., \(A_t+C_t \times P_t\)). A large \(G_t\) implies that rich agents receiving much larger percentages of the total wealth of the agent population, which may change the blockchain system from decentralized to centralized.
Results and Discussion
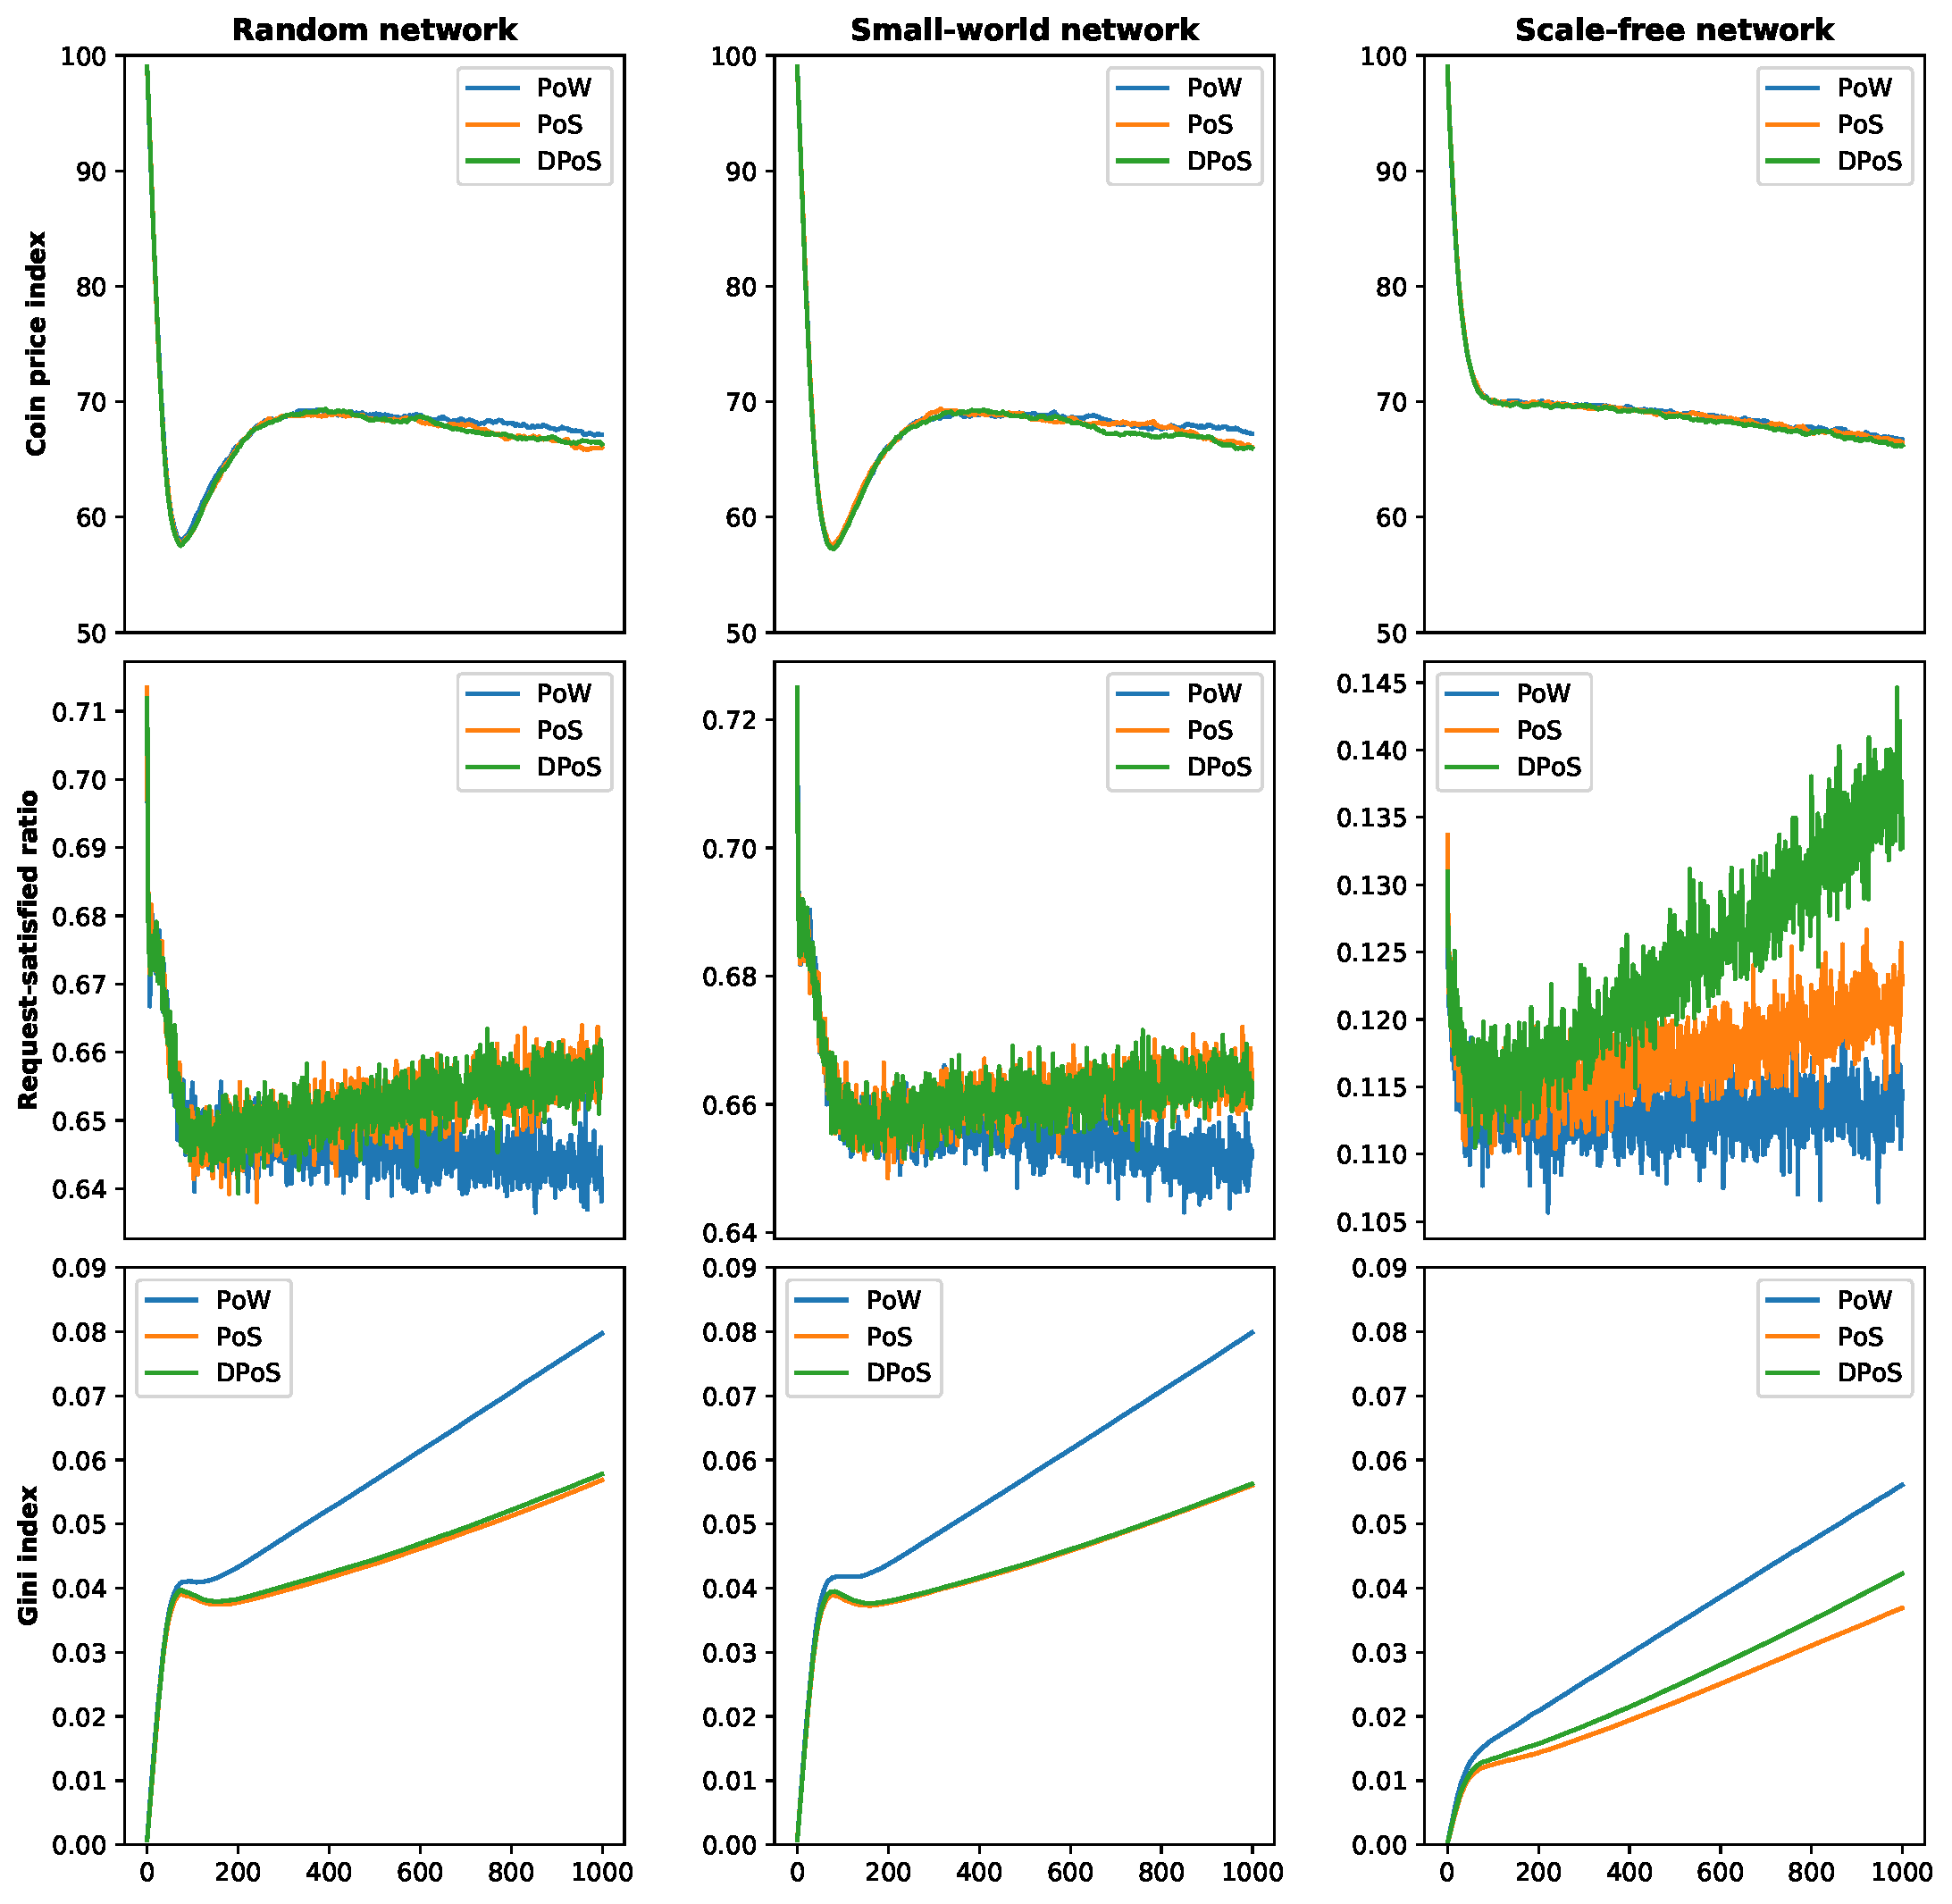
The averaged time series data of performance indicators are illustrated in Figure 3. The simulation results at the final time step are presented in Table 4, in which the values are averaged across 100 samples, and the standard deviations are given in brackets. Table 4 also reports the numbers of coin buyers/sellers/holds, as well as the total coin demand and supply requests at the final time step.
The impact of different consensus protocols
From three subplots in the first row of Figure 3, we observe that three curves, which respectively denote the three consensus protocols, are very similar. After about 500 time steps, however, the coin prices with PoW consensus protocol become larger than those with other two protocols, but only in random and small-world networks. Regarding the request-satisfied ratio, we find that the performances of PoS and DPoS are very close, and they are greater than that of PoW, as demonstrated in the second row of of Figure 3. Similar situation also happens when we compare the performance of Gini index shown in the third row of Figure 3.
Why is the choice of consensus protocol able to significantly affect the performance of blockchain system, and why is the PoW different? We suggest that PoW forms a positive feedback between large probability of being selected and better condition in miner selection; while PoS and DPoS reset the stake of current selected miner and thus suppress such feedback. Hence, only few miners will be rewarded with new coins under PoW, because this consensus protocol chooses miners only according to their computation powers, which are fixed in our experiment. In contrast, the miner under PoS or DPoS will be unlikely to be selected in several time steps later, leading to the situation that more miners will be rewarded. The impact caused by this difference is three-fold. First, it directly changes the wealth distribution among agents. The blockchain system under PoW has the largest Gini index because of fewer miners being rewarded, which could harm the sustainability of blockchain system. Second, it changes the balance between total coin demand and supply, and thus indirectly affects the coin price index. For example, the PoW consensus protocol leads to fewer new-coin sellers and consequently higher price, as demonstrated in Table 4 (coin price index, # coin sellers). Third, it also impacts the request-satisfied ratio. the PoS and DPoS are able to enlarge the request-satisfied ratio, probably due to the smaller wealth inequality. In other words, if agents have the similar amount of coin demand-supply request which mainly depends on the wealth (see Equation 9), two of them could reach a prefect deal if there is a direct trade connection between these two agents. Under PoW consensus protocol, however, a rich agent has to deal with many relatively poorer agents to fulfill his/her coin request, leading to the low request-satisfied ratio. Therefore, we suggest that PoS and DPoS bring greater trade efficiency to the blockchain system.
| Indicator | Network topology | PoW | PoS | DPoS |
| Coin price index | Random | 67.158(2.388) | 66.030(2.350) | 66.316(2.376) |
| Small-world | 67.265(2.570) | 66.076(2.317) | 65.991(2.031) | |
| Scale-free | 66.758(2.151) | 66.460(1.403) | 66.200(1.469) | |
| Request-satisfied ratio | Random | 0.641(0.025) | 0.659(0.027) | 0.660(0.026) |
| Small-world | 0.653(0.033) | 0.665(0.026) | 0.661(0.033) | |
| Scale-free | 0.115(0.022) | 0.123(0.021) | 0.133(0.033) | |
| Gini index | Random | 0.080(0.003) | 0.057(0.002) | 0.058(0.002) |
| Small-world | 0.080(0.003) | 0.056(0.002) | 0.056(0.002) | |
| Scale-free | 0.056(0.002) | 0.037(0.001) | 0.042(0.002) | |
| # coin buyers | Random | 213.740(11.447) | 213.390(12.513) | 211.900(13.543) |
| Small-world | 214.899(11.630) | 213.640(11.988) | 211.960(11.005) | |
| Scale-free | 212.200(11.903) | 212.910(11.652) | 213.690(13.549) | |
| # coin sellers | Random | 213.830(13.512) | 215.660(12.050) | 216.170(12.184) |
| Small-world | 211.566(10.327) | 214.620(12.525) | 214.130(11.940) | |
| Scale-free | 213.680(13.597) | 213.790(10.985) | 211.950(12.087) | |
| # coin holders | Random | 472.430(11.335) | 470.950(12.486) | 471.930(12.248) |
| Small-world | 473.535(12.838) | 471.740(11.646) | 473.910(11.478) | |
| Scale-free | 474.120(12.242) | 473.300(11.525) | 474.360(12.285) | |
| # coin demand | Random | 15627.701(1162.537) | 15648.812(1053.905) | 15579.353(1166.880) |
| Small-world | 15597.787(1219.318) | 15813.614(1064.904) | 15577.361(1065.464) | |
| Scale-free | 15785.627(1036.439) | 15851.415(980.607) | 15912.821(1248.891) | |
| # coin supply | Random | 11582.661(972.720) | 11802.796(856.230) | 11799.113(791.639) |
| Small-world | 11589.891(835.521) | 11837.646(874.807) | 11728.049(849.268) | |
| Scale-free | 11858.211(1127.771) | 11908.552(697.611) | 11794.795(912.233) |
In sum, the consensus protocol is truly important to a blockchain system as it can significantly affect the coin price index, request-satisfied ratio and Gini index. In particular, both PoS and DPoS consensus protocol yield relatively higher request-satisfied ratio and smaller Gini index; while PoW weakens the trade efficiency and enlarges the wealth inequality among agents, resulting in higher coin price index.
The impact of different trader network topologies
When comparing the performance of different trader network topologies, we find that random network and small-world network produce alike results, mainly due to the similar node degree distribution listed in Table 3. In fact, it is somewhat unfair to the scale-free trade network because the number of average degree (4.27) is smaller than that (10.09) in random network and small-world network, because we have to maintain the power law degree distribution. Therefore, scale-free trade network has serious “connectivity inequality”, which can explain the following four phenomena.
The first difference is the V-shape fluctuation of coin price index in random and small-world trade networks, which cannot be found in scale-free trade network. At the beginning of simulation, coin price drops because of the extra coin supply, i.e., coins are rewarded to selected miners. Consequently, herd agents try to sell their coins, which in turn decreases the coin price index. The price becomes stable or even starts to climb because of the game trades and miners who keep buying coins when many herd agents are selling. Therefore, it is not surprising that the standard deviation of coin price index is small in Table 4 . However, the above balancing feedback loop will lead to the V-shape fluctuation of coin price index only if both herd and game agents can well engage in trade, which is relatively easy in random and small-world trade networks due to the high connectivity. On the other side, the connectivity inequality of scale-free trade network moderates the price fluctuation because the trade probability between herd and game agents is lower.
The smaller price fluctuation could be a favorable feature of connectivity inequality, but the cost is the much smaller trade efficiency. As we can see from Table 4, the request-satisfied ratio in scale-free trade network is about 11-13%, while it is 64-66% (almost six-fold) in other two networks. This big difference is caused not only by the distance between average node degree (\(10.09 / 4.27 = 2.36\)), but also by the connectivity inequality. Although the high-degree node is connected with many neighbors, a deal can only be reached with his/her partial neighbors when the node has non-zero trade request.
Due to the low trade efficiency, the third phenomenon is understandable: the Gini index in scale-free trade network is smaller than that in others. However, it is still worrying that the Gini index climbs in all combinations of consensus algorithm and trade network topology, indicating that the “winner-takes-all” situation could happen in many blockchain systems.
The last finding is that in scale-free trade network, the performance difference between PoS and DPoS is sharpened: DPoS has greater request-satisfied ratio and Gini index than PoS. Under DPoS consensus protocol, a miner’s degree is considered for miner selection, as described by Equation 16. If a miner is the high-degree node, he/she will be likely to be selected again even if his/her stake is reset, resulting in the greater Gini index. Consequently, when this miner decides to buy or sell coins, the absolute coin request will be larger than that under PoS consensus protocol, and thus more coin supply or demand requests from his/her neighbors will be satisfied.
In sum, the trade network topology can comprehensively affect the performance of blockchain system. In par-ticular, compared with random and small-world trade networks, the scale-free trade network has slight price fluctuation and small Gini index due to its much smaller request-satisfied ratio. In a scale-free trade network, the DPoS consensus protocol will obtain better trade efficiency at the cost of great wealth inequality.
The impact of different node degree distributions in random and small-world networks
Since the performances of random and small-world networks are similar due to the almost identical range degrees, it becomes interesting to investigate the impact of different node degree distributions on system performance[1]. Therefore, we randomly generate eight more networks, the node degree information of which is presented in Table 5. Four of new networks have smaller average node degree, while other four have larger av-erage degree. Note that Rd3 and Sw3 are the current random and small-world networks in our model, serving as the baseline.
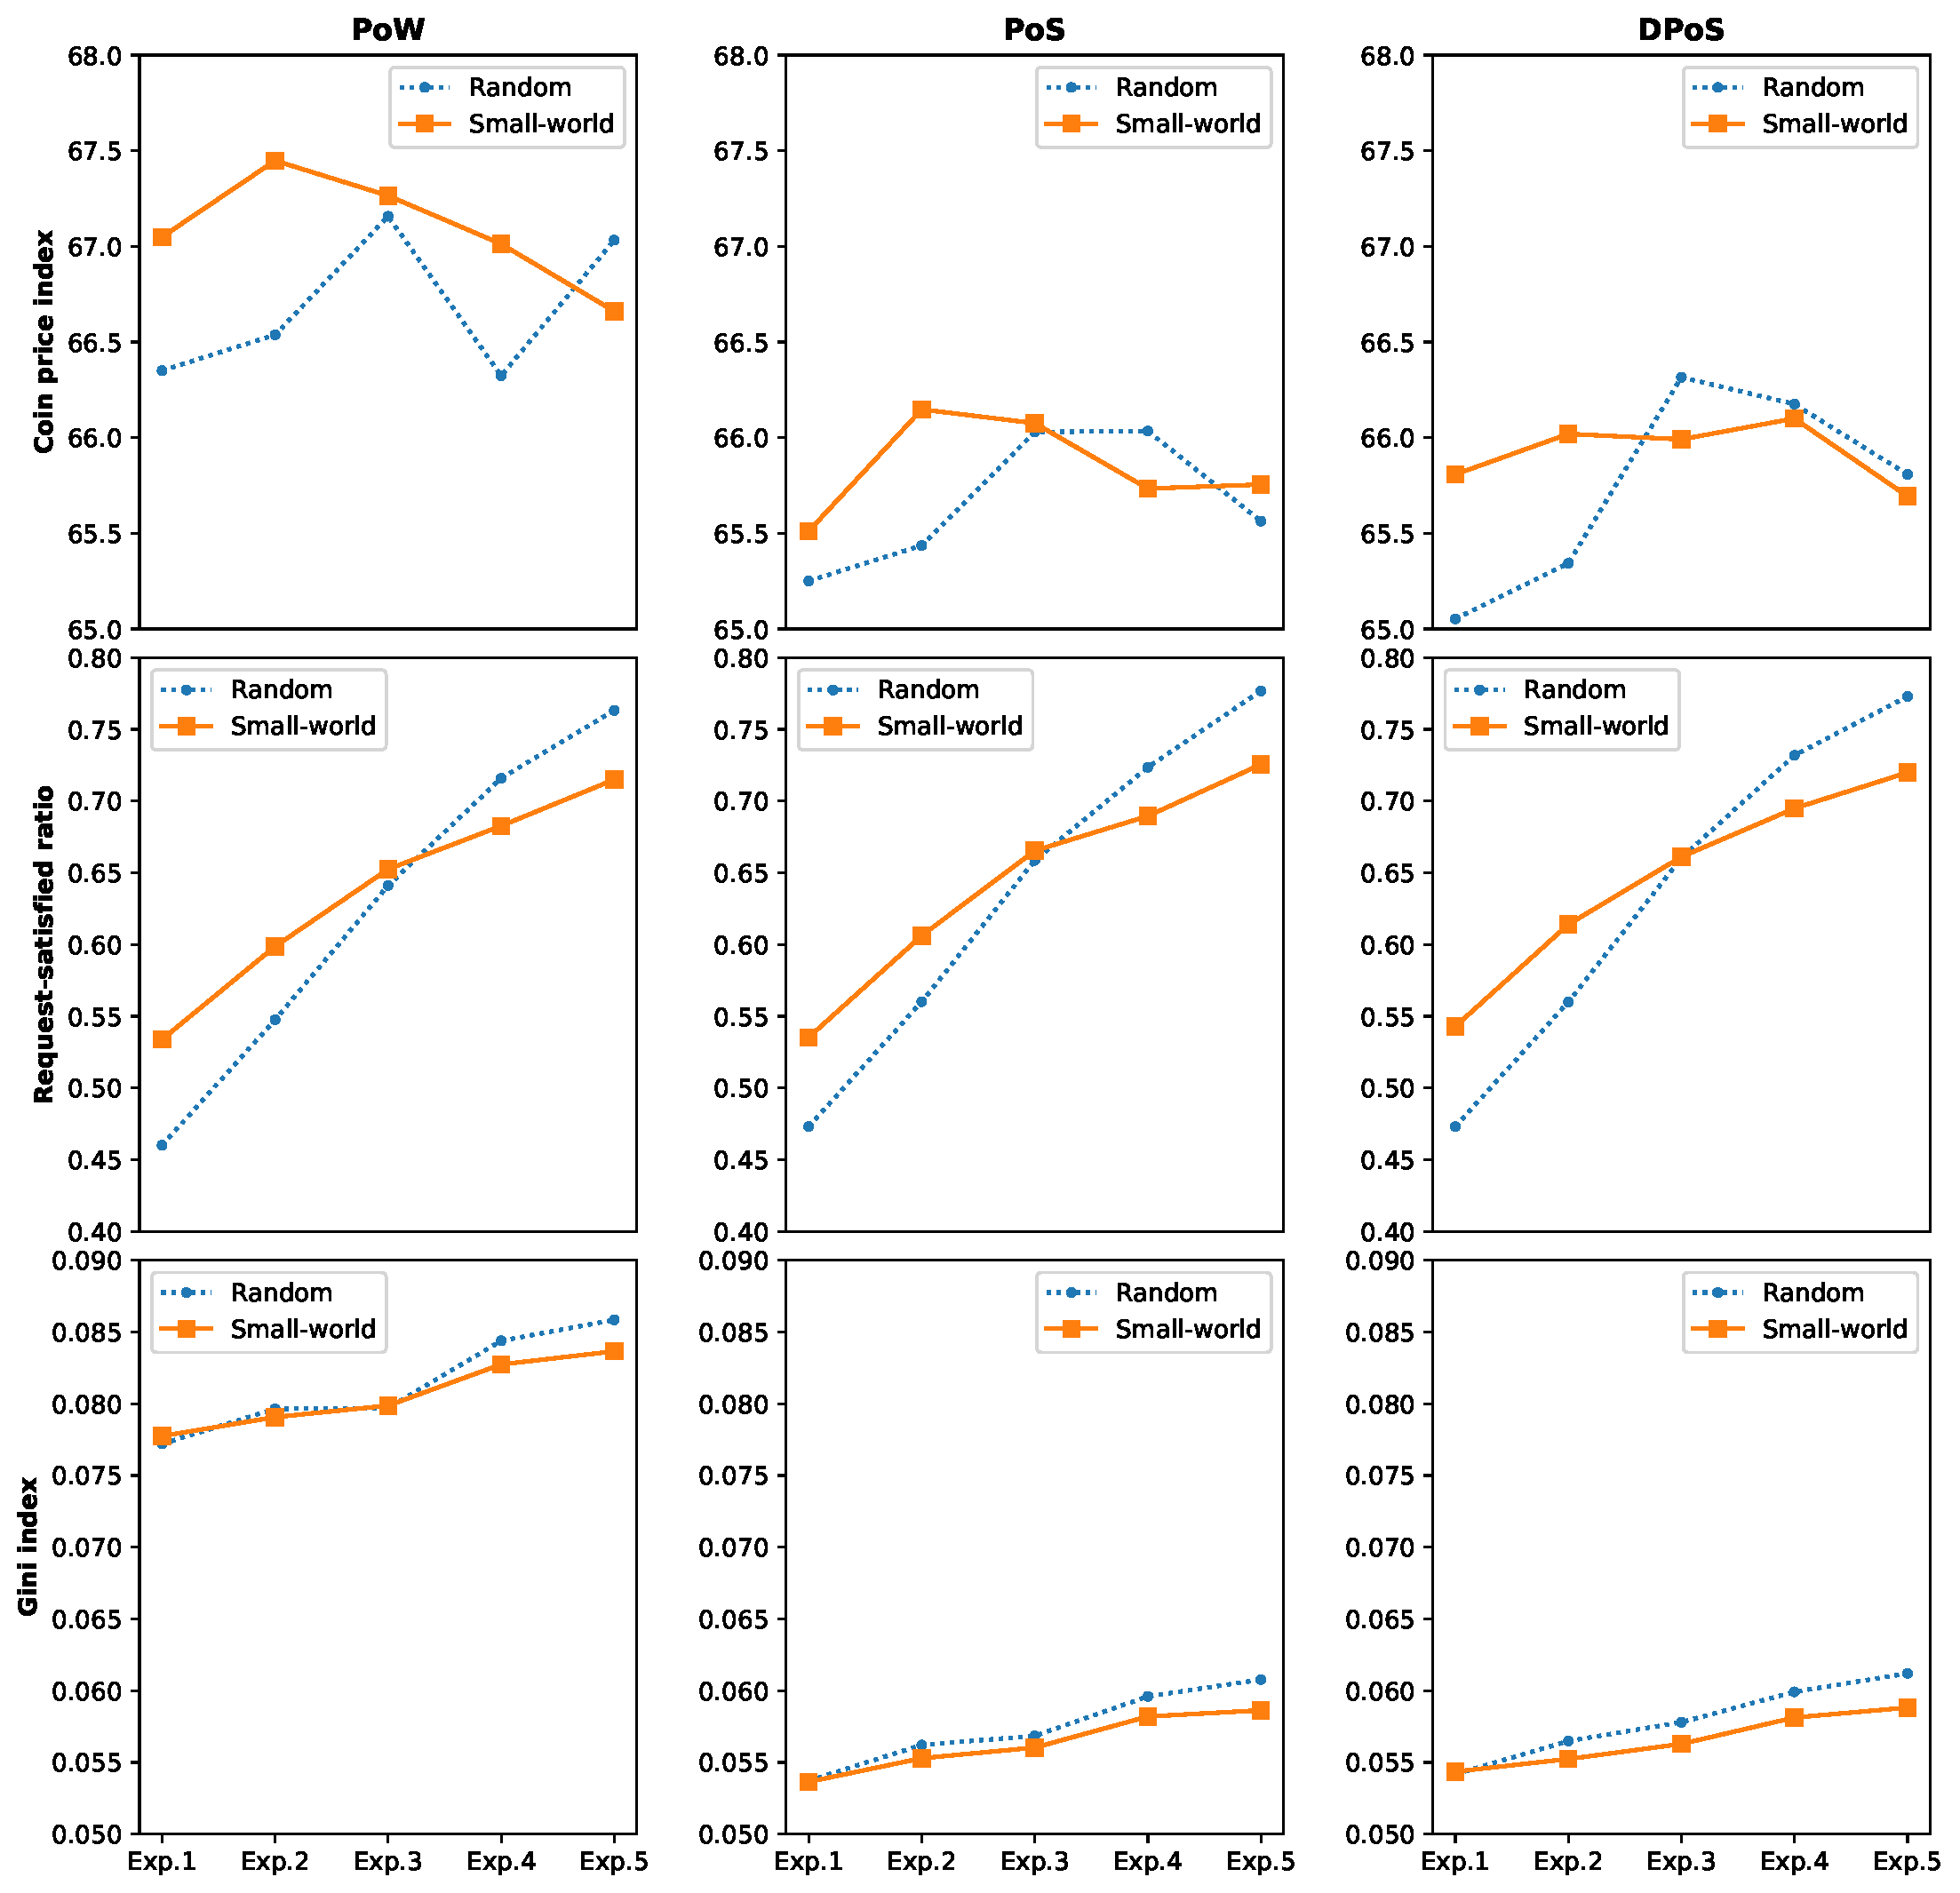
Table 6 and Figure 4 report the system performance with different random and small-world networks. We first observe that the PoW consensus protocol can truly raise the coin price, increase Gini index, and lower the request-satisfied ratio. These results are consistent with the findings when analyzing the impact of different consensus protocols. However, when all other factors are fixed, the price change is seemingly not correlated with the average node degree of these two network types. In contrast, when the average node degree is increased, both request-satisfied ratio and the Gini index monotonously grow, indicating that higher network connectivity accelerates the flows of information and wealth. This finding can also be obtained from current economic globalization empowered by information technology: the participants (traders, nations) are closely connected by the Internet; they share information and exchange values; although more deals have been made, the gap between the rich and the poor is enlarged.
When investigating the performance difference caused by trader network topology, we find that the request-satisfied ratio is strongly affected by the average node degree. Subplots in the second row of Figure 4 demonstrate that the two curves under different consensus protocols cross only in the baseline cases because they have the same average node degree (10.09). Another finding is that random networks often have same or slightly larger Gini index than small-world networks, possibly due to the greater upper bound and smaller lower bound of node degree, as listed in Table 5. Based on the analyses of different trader network topologies and node degree distributions, we hence may be able to draw a conclusion: connectivity inequality determines wealth inequality.
In sum, this additional study on node degree distribution proves the findings observed from previous nine experiments. We also find that average node degree is positively associated with request-satisfied ratio and the Gini index in random and small-world trade networks. We conclude that connectivity inequality determines wealth inequality, and thus suggest that when designing a sustainable blockchain system, it is crucial to increase the connectivity among participants, by means of not only using better consensus protocols such as PoS or DPoS, but also incentivizing apathetic or newly-joined participants to link with others.
| Trade network topology | Exp. Name | Max degree | Min degree | Avg. degree | Median degree | Total edges |
| Random | Rd1 | 11 | 0 | 5.08 | 5 | 4568 |
| Rd2 | 16 | 1 | 7.14 | 7 | 6428 | |
| Rd3 | 21 | 1 | 10.09 | 10 | 9078 | |
| Rd4 | 31 | 4 | 14.12 | 14 | 12710 | |
| Rd5 | 31 | 6 | 18.21 | 18 | 16392 | |
| Small-world | Sw1 | 10 | 3 | 6.00 | 6 | 5400 |
| Sw2 | 14 | 4 | 8.00 | 8 | 7200 | |
| Sw3 | 17 | 6 | 10.09 | 10 | 9078 | |
| Sw4 | 18 | 7 | 12.00 | 12 | 10800 | |
| Sw5 | 20 | 9 | 14.00 | 14 | 12600 |
| Random | Small-world | |||||||||||
| Indicator | Protocol | Rd1 | Rd2 | Rd3 | Rd4 | Rd5 | Sw1 | Sw2 | Sw3 | Sw4 | Sw5 | |
| Coin price index | PoW | 66.350 | 66.538 | 67.158 | 66.324 | 67.033 | 67.049 | 67.448 | 67.265 | 67.013 | 66.661 | |
| PoS | 65.251 | 65.436 | 66.030 | 66.035 | 65.564 | 65.512 | 66.148 | 66.076 | 65.734 | 65.755 | ||
| DPoS | 65.053 | 65.343 | 66.316 | 66.176 | 65.808 | 65.808 | 66.020 | 65.991 | 66.100 | 65.693 | ||
| Request-satisfied | PoW | 0.460 | 0.548 | 0.641 | 0.716 | 0.763 | 0.534 | 0.599 | 0.653 | 0.683 | 0.715 | |
| ratio | PoS | 0.473 | 0.560 | 0.659 | 0.724 | 0.777 | 0.535 | 0.606 | 0.665 | 0.690 | 0.726 | |
| DPoS | 0.473 | 0.560 | 0.660 | 0.732 | 0.773 | 0.543 | 0.614 | 0.661 | 0.695 | 0.720 | ||
| Gini index | PoW | 0.077 | 0.080 | 0.080 | 0.084 | 0.086 | 0.078 | 0.079 | 0.080 | 0.083 | 0.084 | <|
| PoS | 0.054 | 0.056 | 0.057 | 0.060 | 0.061 | 0.054 | 0.055 | 0.056 | 0.058 | 0.059 | >||
| DPoS | 0.054 | 0.056 | 0.058 | 0.060 | 0.061 | 0.054 | 0.055 | 0.056 | 0.058 | 0.059 | ||
Findings corroboration
Since the general findings above were obtained from our theoretical model, we attempted to confront them in this subsection. Note that it is extremely difficult to validating our model based on real data for the following two reasons. First, although the blockchain data is often available, we cannot identify the network topology of real traders because of anonymized user information. Second, many model settings cannot be empirically determined at present due to the high cost of data collection, preventing us from reproducing the evolution of true blockchain systems.
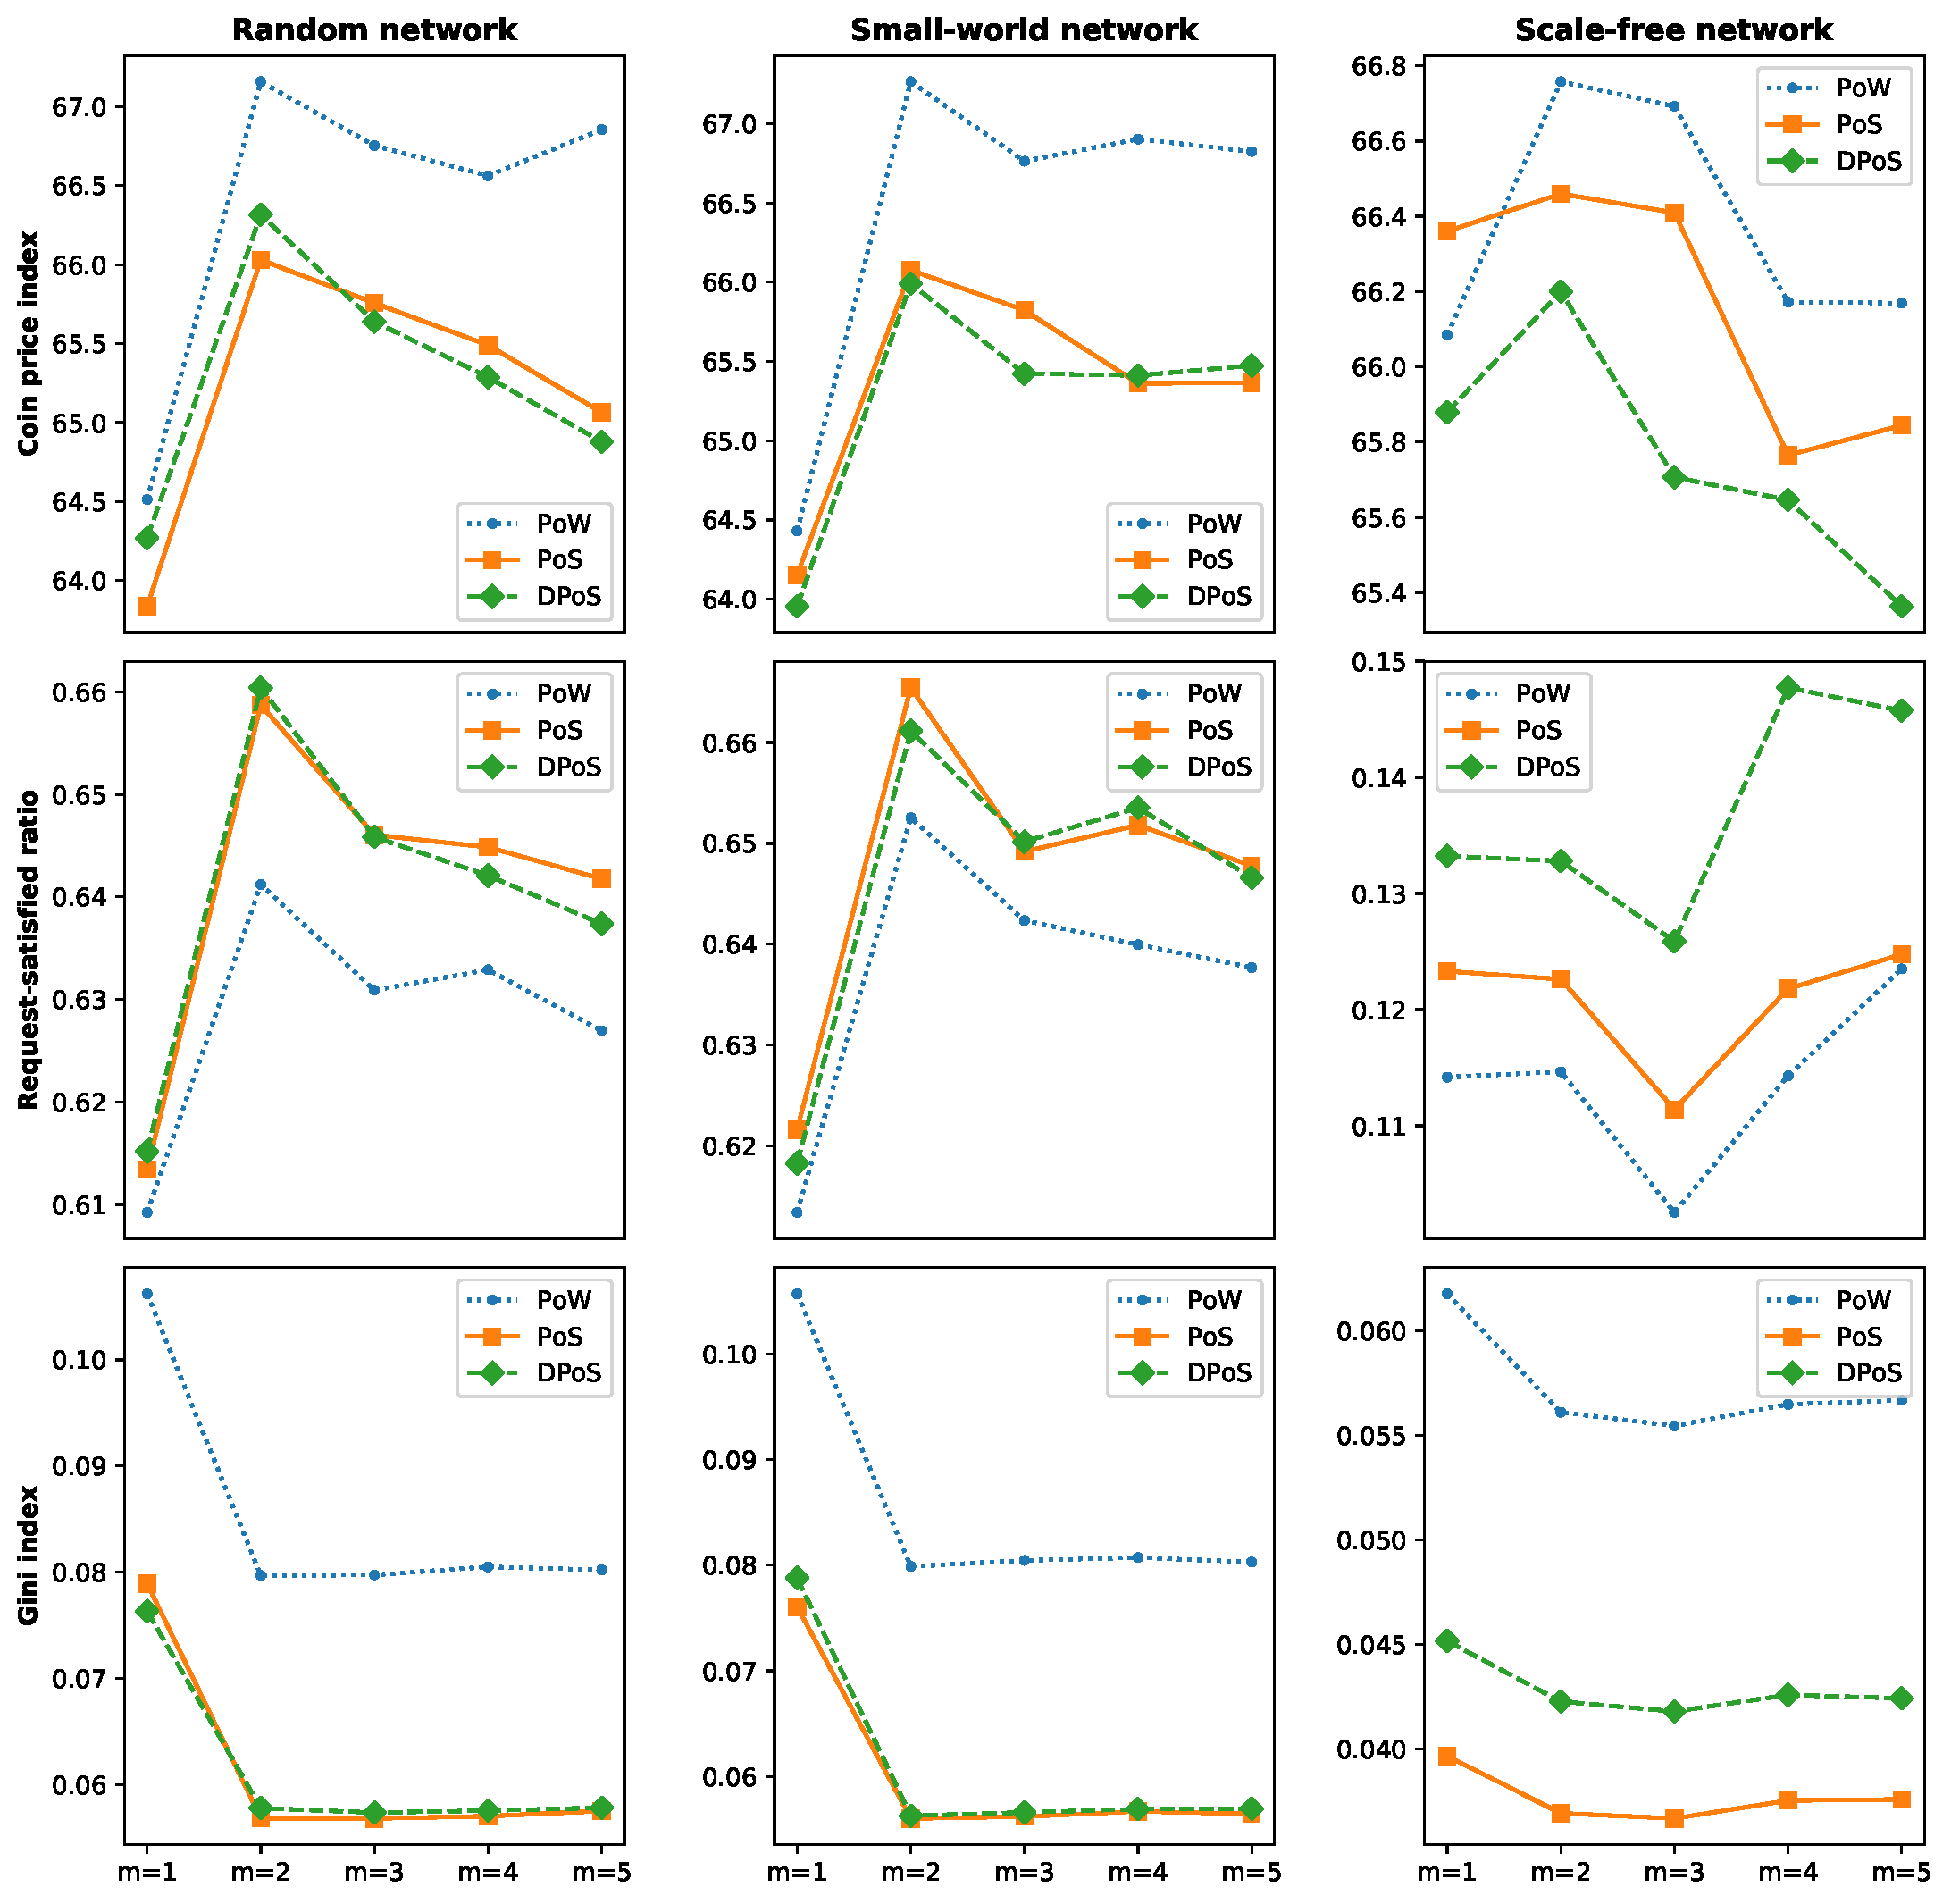
To corroborate our findings, the first way is to compare with previous studies. Tanaka-Yamawaki & Tokuoka (2006) investigated the relationship between \(m\) (number of steps), \(s\) (number of possible policies) and key performance indicators such as the number of winners in Minority Game. They found that when \(s\) was fixed, the system performances were similar under different \(m>1\), except \(m=1\). See Figures 3 and 4 in the paper by Tanaka-Yamawaki & Tokuoka (2006) for details.
Therefore, we conducted four additional experiments (\(m=1, 2, 3, 4, 5\)), together with the existing one (\(m=2\)), to examine the impact of different \(m\). Each experiment ran 100 times to obtain the averaged performance, which is reported in Figure 5. The performance with random and small-world networks implies that when \(m=1\), both price index and request-satisfied ratio are less than those in other four cases, but the Gini index is greater[2]. In other words, we have successfully reproduced the phenomenon observed by Tanaka-Yamawaki & Tokuoka (2006). Hence, our general findings are corroborated by previous studies.
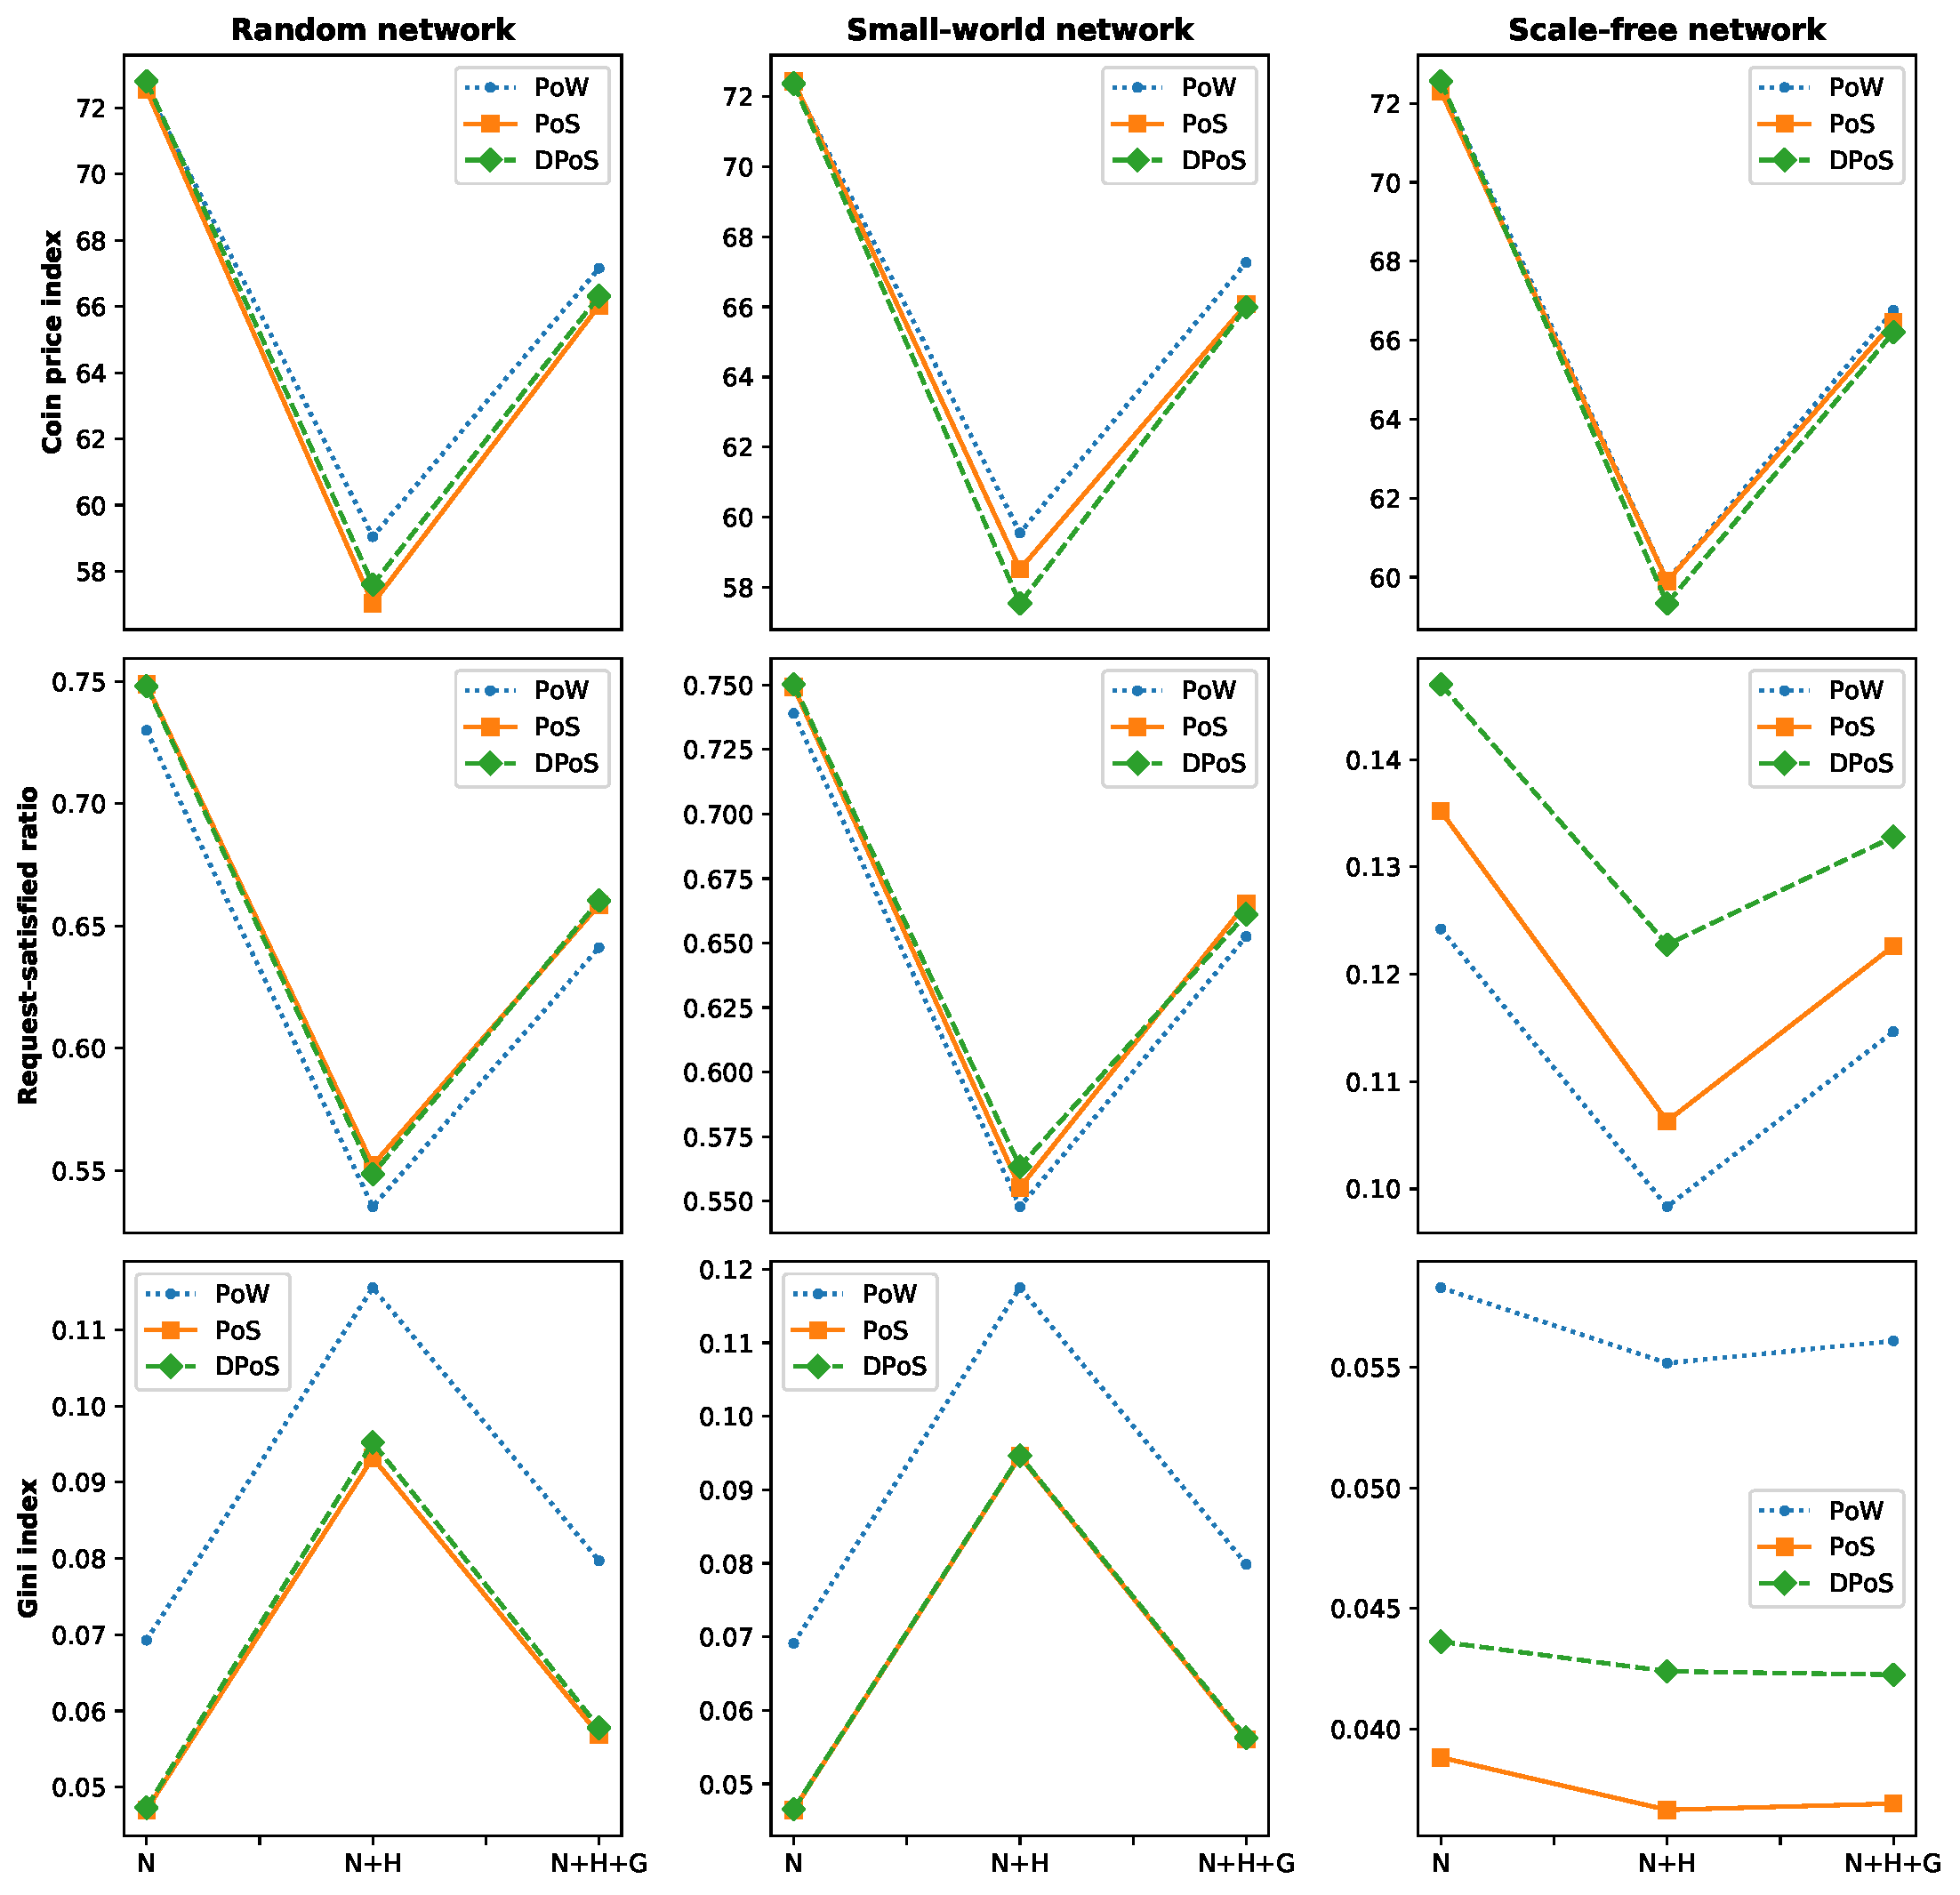
The second approach is to compare with deducted models. Our model consists of three types of agents: noisy, herd, and game traders/miners, denoted by N, H, and G, respectively. We consider three cases. (1) Case N. Suppose that if our model only contains noisy agents, then the model performance can be viewed as a random walk because their decisions are made based on equal probabilities. (2) Case N+H. Based on Case N, if we add herd agents who buy coins when price grows and sell coins when price drops, then these agents should enlarge the change of the model performance, because their behavior and system performance form a reinforcing loop which compound change in one direction with even more change. Therefore, we expect that the performance of this case should be very different with Case N. (3) Case N+H+G. Game traders buy coins while others are selling and sell coins while others are buying. Using the language of system dynamics, game traders introduce a balancing loop which resists further increases in a given direction. Therefore, we expect that the performance of this case should be very different with Case N+H, and should be close to Case N.
Based on above analysis, we conducted two additional experiments (Case N, Case N+H), together with the existing one (Case N+H+G), to examine the impact of different agent types. Note that in all these experiments, the number of total agents is always 900 for fair competition, and the ratio of traders and miners is always 2 to 1 for the same reason. Each experiment ran 100 times to obtain the averaged performance, which is reported in Figure 6. It can be observed that almost all performance changes can be described by v-shaped or inverted v-shaped curves. In other words, we have successfully reproduced the expected phenomenon: the performance of Case N+H+G should be very different with Case N+H, and should be similar to Case N. Hence, our general findings are corroborated by deducted models.
Conclusion
In this paper, we tried to understand how different consensus protocols and trade network topologies affect the performance of a blockchain system, which has not been studied in the literature yet. To simulate a coin-inside blockchain system, we proposed an agent-based model consisting of multiple trader agents, miner agents, and one system agent. Trader agents can be divided into three groups: noisy traders who make random decision on buying/selling/holding coins; herd traders whose decisions are influenced by the fluctuation of coin price index; game traders who buy coins while others are selling and sell coins while others are buying. The miner agents are special traders because some of them will be selected by the system agent to create blocks and get a certain number of coins as reward. The rule of miner selection is determined by the consensus protocols, and we proposed reasonable assumptions about the relationship between consensus protocol and miner selection probability. The change of coin price index is mainly affected by the total supply and demand of coins in the system, but not all supply and demand requests will be satisfied due to the absence of central counter party. Therefore, agents can only trade with their neighbors in the trade network, resulting in low request satisfaction ratio which is also impacted by the trade network topology.
We first conducted nine experiments in which PoW, PoS, DPoS consensus protocols and random, small-world, scale-free trade networks are implemented. Experimental results show that both consensus protocol and trade network topology can impact the performance of blockchain system. PoS and DPoS are generally better than PoW in terms of increasing trade efficiency and equalizing wealth. Besides, scale-free trade network is not favorable because its trade efficiency is quite low, which moderates the price fluctuation and wealth inequality. An additional study on node degree distribution proves the findings observed from previous experiments, and also reveals that connectivity inequality determines wealth inequality.
Based on the above results, we suggest the following two managerial insights to blockchain practitioners. (1) It is very important to design an appropriate consensus protocol for a blockchain system. The PoW consensus protocol is not recommended as its trade efficiency is low even it consumes enormous energy for computation. Moreover, PoW leads to higher wealth inequality which will harm the decentralization of blockchain systems. (2) It is crucial to identify the trade network topology as it significantly affects the trade efficiency of a blockchain system. The scale-free network topology should not be preferred due to its high connectivity inequality. Hence, the blockchain system designer or operator should attempt to increase the connectivity among participants by, e.g., incentivizing apathetic or newly-joined participants to link with others.
We also suggest several future directions to researchers. First, some model settings and value assignment of some parameters can be validated based on empirical data if available. We consider to develop online and/or offline questionnaires for data collection and statistical analysis. Second, the agent’s behavior can be improved. For example, the miners’ behaviors are relatively simple because in reality they may need to make investment decisions, consider acting dishonestly, etc. Third, current model can be extended to investigate the impact of other factors on the performance of blockchain system, or be applied to a specific area such as blockchain-based game design. For example, it could be interesting to develop a better consensus protocol which allocates newly-created coins to miners adaptively for achieving some predefined objectives. This requires an in-depth investigation of the impact of parameter \(W_t\) in Table 1. Finally, to test the robustness of our simulation results against the simulation horizon, we reran all the experiments with 10,000 time steps[3]. Most of important results discussed above still held in most of time, except that DPoS in scale-free networks became highly uncertain due to the connection inequality. This suggests that it is very important for agent-based modelers to study longer (perhaps unrealistically longer) time frames, so that the robustness of simulation results can be confirmed (He et al. 2019b b).
Acknowledgements
This is an extended version of the paper originally prepared for the 22nd International Conference on Principles and Practice of Multi-Agent Systems. We would like to thank the anonymous reviewers for constructive comments and suggestions. This work is supported by the National Natural Science Foundation of China (No. 71932002, 71901202) and the University of Chinese Academy of Sciences.Notes
- We thank an anonymous reviewer for this helpful suggestion.
- Why was this difference not significant with scale-free networks? We speculate that scale-free networks prevent su icient agent interactions due to the power law node degree distribution. In contrast, agents are well mixed in other two networks, similar to the setting in Tanaka-Yamawaki & Tokuoka (2006).
- We thank an anonymous reviewer for this helpful suggestion.
References
ANTONOPOULOS, A. M. (2014). Mastering Bitcoin: Unlocking digital cryptocurrencies. O’Reilly Media.
ANTONOPOULOS, A. M. & Wood, G. (2018). Mastering Ethereum: Building smart contracts and DAPPs. O’Reilly Media.
AUBLIN, P.-L., Mokhtar, S. B. & Quéma, V. (2013). Rb : Redundant byzantine fault tolerance. In 2013 IEEE 33rd International Conference on Distributed Computing Systems, (pp. 297–306). IEEE. [doi:10.1109/icdcs.2013.53]
BACH, L., Mihaljevic, B. & Zagar, M. (2018). Comparative analysis of blockchain consensus algorithms. In 2018 41st International Convention on Information and Communication Technology, Electronics and Microelectron-ics, (pp. 1545–1550). IEEE. [doi:10.23919/mipro.2018.8400278]
BUTERIN, V. & Griffith, V. (2017). Casper the friendly finality gadget. CoRR, abs/1710.09437: http://arxiv.org/abs/1710.09437.
CASTRO, M. & Liskov, B. (1999). Practical Byzantine fault tolerance. In Proceedings of the Third Symposium on Operating Systems Design and Implementation, vol. 99, (pp. 173–186).
COCCO, L. & Marchesi, M. (2016). Modeling and simulation of the economics of mining in the bitcoin market. PLoS ONE, 11(10), e0164603. [doi:10.1371/journal.pone.0164603]
COWLING, J., Myers, D., Liskov, B., Rodrigues, R. & Shrira, L. (2006). Hq replication: A hybrid quorum protocol for byzantine fault tolerance. In Proceedings of the 7th symposium on Operating Systems Design and Implementation, (pp. 177–190). USENIX Association.
DU, M., Ma, X., Zhang, Z., Wang, X. & Chen, Q. (2017). A review on consensus algorithm of blockchain. In IEEE International Conference on Systems, Man, and Cybernetics, (pp. 2567–2572). IEEE.
DZIEMBOWSKI, S., Faust, S., Kolmogorov, V. & Pietrzak, K. (2015). Proofs of space. In Annual Cryptology Conference, (pp. 585–605). Springer-Nature. [doi:10.1007/978-3-662-48000-7_29]
FARMER, J. D. & Foley, D. (2009). The economy needs agent-based modelling. Nature, 460(7256), 685–686. [doi:10.1038/460685a]
HE, Z., Dong, J. & Yu, L. (2018). An agent-based model for investigating the impact of distorted supply–demand information on china’s resale housing market. Journal of Computational Science, 25, 1–15. [doi:10.1016/j.jocs.2018.01.002]
HE, Z., Han, G., Cheng, T. C. E., Fan, B. & Dong, J. (2019a). Evolutionary food quality and location strategies for restaurants in competitive online-to-offline food ordering and delivery markets: An agent-based approach. International Journal of Production Economics, 215, 61–72. [doi:10.1016/j.ijpe.2018.05.008]
HE, Z., Luo, C., Tan, C.-H., Wu, H. & Fan, B. (2019b). Simulating an agent’s decision-making process in black-box managerial environment: An estimation-and-optimisation approach. Journal of Simulation, 13(2), 111–127. [doi:10.1080/17477778.2018.1440946]
HE, Z., Xiong, J., Ng, T. S., Fan, B. & Shoemaker, C. A. (2017). Managing competitive municipal solid waste treat-ment systems: An agent-based approach. European Journal of Operational Research, 263(3), 1063–1077. [doi:10.1016/j.ejor.2017.05.028]
HOFFMANN, A. O. I., Jager, W. & Von Eije, J. H. (2007). Social simulation of stock markets: Taking it to the next level. Journal of Artificial Societies and Social Simulation, 10(2), 7: https://www.jasss.org/10/2/7.html.
HOLLAND, J. (1996). Hidden Order: How Adaptation Builds Complexity. Addison-Wesley.
HUANG, C.-Y., Sun, C.-T. & Lin, H.-C. (2005). Influence of local information on social simulations in small-world network models. Journal of Artificial Societies and Social Simulation, 8(4), 8: https://www.jasss.org/8/4/8.html.
JUELS, A. & Kaliski Jr, B. S. (2007). Pors: Proofs of retrievability for large files. In Proceedings of the 14th ACM conference on Computer and Communications Security, (pp. 584–597). ACM. [doi:10.1145/1315245.1315317]
KALIGOTLA, C. & Macal, C. M. (2018). A generalized agent based framework for modeling a blockchain system. In Proceedings of the 2018 Winter Simulation Conference, (pp. 1001–1012). IEEE Press. [doi:10.1109/wsc.2018.8632374]
KING, S. & Nadal, S. (2012). Ppcoin: Peer-to-peer crypto-currency with proof-of-stake. Tech. rep.
LAMPORT, L. (1998). The part-time parliament. ACM Transactions on Computer Systems, 16(2), 133–169. [doi:10.1145/279227.279229]
LAMPORT, L. (2001). Paxos made simple. ACM SIGACT News, 32(4), 18–25.
LAMPORT, L., Shostak, R. & Pease, M. (1982). The Byzantine generals problem. ACM Transactions on Programming Languages and Systems, 4(3), 382–401. [doi:10.1145/357172.357176]
LARIMER, D. (2014). Delegated proof-of-stake. Tech. rep.
LEBARON, B. (2006). Agent-based computational finance. In L. Tesfatsion & K. L. Judd (Eds.), Handbook of Computational Economics, vol. 2, chap. 24, (pp. 1187–1233). Elsevier, 1 edn. [doi:10.1016/s1574-0021(05)02024-1]
LEE, K., Ulkuatam, S., Beling, P. & Scherer, W. (2018). Generating synthetic bitcoin transactions and predicting market price movement via inverse reinforcement learning and agent-based modeling. Journal of Artificial Societies and Social Simulation, 21(3), 5: https://www.jasss.org/21/3/5.html. [doi:10.18564/jasss.3733]
LI, C. & Palanisamy, B. (2019). Incentivized blockchain-based social media platforms: A case study of Steemit. .In Proceedings of the 10th ACM Conference on Web Science, (pp. 145–154). ACM. [doi:10.1145/3292522.3326041]
LIN, F.-r. & Lin, S.-m. (2006). Enhancing the supply chain performance by integrating simulated and physical agents into organizational information systems. Journal of Artificial Societies and Social Simulation, 9(4), 1: https://www.jasss.org/9/4/1.html.
LIU, F. & Serguieva, A. (2018). A behavioral economic perspective on the financial contagion. Journal of Central University of Finance & Economics, 11, 107–116.
MACAL, C. M. & North, M. J. (2009). Agent-based modeling and simulation. In Proceedings of the 2009 Winter Simulation Conference, (pp. 86–98). IEEE. [doi:10.1109/wsc.2009.5429318]
NAKAMOTO, S. (2008). Bitcoin: A peer-to-peer electronic cash system. Tech. rep.
OHDAIRA, T. & Terano, T. (2011). Scale-free relationships facilitate cooperation in spatial games with sequential strategy. Journal of Artificial Societies and Social Simulation, 14(3), 3: https://www.jasss.org/14/3/3.html. [doi:10.18564/jasss.1771]
OLDHAM, M. (2017). Introducing a multi-asset stock market to test the power of investor networks. Journal of Artificial Societies and Social Simulation, 20(4), 13: https://www.jasss.org/20/4/13.html. [doi:10.18564/jasss.3497]
ONGARO, D. & Ousterhout, J. (2014). In search of an understandable consensus algorithm. In 2014 USENIX Annual Technical Conference, (pp. 305–319).
SCHELLING, T. C. (1978). Micromotives and Macrobehavior. New York: W.W. Norton.
TANAKA-YAMAWAKI, M. & Tokuoka, S. (2006). Minority game as a model for the artificial financial markets. In 2006 IEEE International Conference on Evolutionary Computation, (pp. 2157–2162). [doi:10.1109/cec.2006.1688573]
VERONESE, G. S., Correia, M., Bessani, A. N., Lung, L. C. & Verissimo, P. (2011). Efficient byzantine fault-tolerance. IEEE Transactions on Computers, 62(1), 16–30. [doi:10.1109/tc.2011.221]
WANG, W., Hoang, D. T., Xiong, Z., Niyato, D., Wang, P., Hu, P. & Wen, Y. (2018). A survey on consensus mechanisms and mining management in blockchain networks. arXiv preprint arXiv:1805.02707, (pp. 1–33). [doi:10.1109/access.2019.2896108]
YUAN, Y. & Wang, F.-y. (2016). Blockchain: The state of the art and future trends. Acta Automatica Sinica, 42(4), 481–494.
ZEPPINI, P. & Frenken, K. (2018). Networks, percolation, and consumer demand. Journal of Artificial Societies and Social Simulation, 21(3), 1: https://www.jasss.org/21/3/1.html. [doi:10.18564/jasss.3658]